
Abstract
The availability of disease modifying therapies for spinal muscular atrophy (SMA) has created an urgent need to identify clinically meaningful biomarkers. Biomarkers present a means to measure and evaluate neurological disease across time. Changes in biomarkers provide insight into disease progression and may reveal biologic, physiologic, or pharmacologic phenomena occurring prior to clinical detection. Efforts to identify biomarkers for SMA, a genetic motor neuron disease characterized by motor neuron degeneration and weakness, have culminated in a number of putative molecular and physiologic markers that evaluate biological media (eg, blood and cerebrospinal fluid [CSF]) or nervous system function. Such biomarkers include SMN2 copy number, SMN mRNA and protein levels, neurofilament proteins (NFs), plasma protein analytes, creatine kinase (CK) and creatinine (Crn), and various electrophysiology and imaging measures. SMN2 copy number inversely correlates with disease severity and is the best predictor of clinical outcome in untreated individuals. SMN mRNA and protein are commonly measured in the blood or CSF of patients receiving SMA therapies, particularly those aimed at increasing SMN protein expression, and provide insight into current disease state. NFs have proven to be robust prognostic, disease progression, and pharmacodynamic markers for SMA infants undergoing treatment, but less so for adolescents and adults. Select plasma proteins are altered in SMA individuals and may track response to therapy. CK and Crn from blood correlate with motor function and disease severity status and are useful for predicting which individuals will respond to therapy. Electrophysiology measures comprise the most reliable means for monitoring motor function throughout disease course and are sensitive enough to detect neuromuscular changes before overt clinical manifestation, making them robust predictive and pharmacodynamic biomarkers. Finally, magnetic resonance imaging and muscle ultrasonography are non-invasive techniques for studying muscle structure and physiology and are useful diagnostic tools, but cannot reliably track disease progression. Importantly, biomarkers can provide information about the underlying mechanisms of disease as well as reveal subclinical disease progression, allowing for more appropriate timing and dosing of therapy for individuals with SMA. Recent therapeutic advancements in SMA have shown promising results, though there is still a great need to identify and understand the impact of biomarkers in modulating disease onset and progression.
Introduction
Spinal muscular atrophy (SMA) is a degenerative motor neuron disorder and a prominent genetic cause of infantile death, with an incidence of 1 in 11 000 live births.1,2 SMA is caused by a homozygous deletion or mutation of the survival motor neuron 1 (SMN1) gene. SMN2, a nearly identical gene, is able to produce a small quantity of full-length SMN protein, enough to prevent lethality in humans born with SMA. At least 1 copy of SMN2 is required for survival in utero, with subsequent copies inversely correlating with disease severity.3-7 Though SMN1 and SMN2 only differ by a C to T nucleotide substitution, this single base change causes skipping and exclusion of exon 7 during splicing, resulting in SMNΔ7 mRNA that produces a truncated, nonfunctional protein.8-13 This protein is ultimately ubiquitinated for lysosomal degradation,14-16 and thus is unable to compensate for the full-length SMN normally produced by SMN1. One notable exception to this general trend is the c.859G>C modifier that promotes exon 7 inclusion and allows for a moderately increased amount of full-length SMN mRNA in diseased individuals with 2 copies of SMN2, resulting in a mild type 3b phenotype.13,17,18
Classified based on clinical features, there are 4 main subtypes of SMA, ranging from the earliest (ie, infantile), most severe onset (type 1) to childhood, non-ambulatory onset (type 2) to later childhood, ambulatory onset (type 3), to adult, mild onset (type 4). Sufficient SMN expression arising from increased SMN2 copy number can result in later-onset, mild forms of disease.
In the last decade, significant advancements have been made in SMA treatment, resulting in 3 FDA-approved therapies. Current approved therapies for SMA act by upregulating SMN protein in diseased individuals, either via increasing exon 7 inclusion in mature mRNA (Evrysdi [risdiplam]19,20 and Spinraza [nusinersen] 21 ) or AAV9-mediated gene replacement therapy (Zolgensma [onasemnogene abeparvovec]22,23) with extraordinary success. However, considering the primary target of SMN-restoring therapies is the spinal cord, a feasible method for the longitudinal evaluation of SMN levels in surviving patient populations is still lacking. There remains an urgent need to develop biological markers (“biomarkers”) for improved detection and clinical management of the disease, as well as for understanding variability of therapeutic response between treated patients.
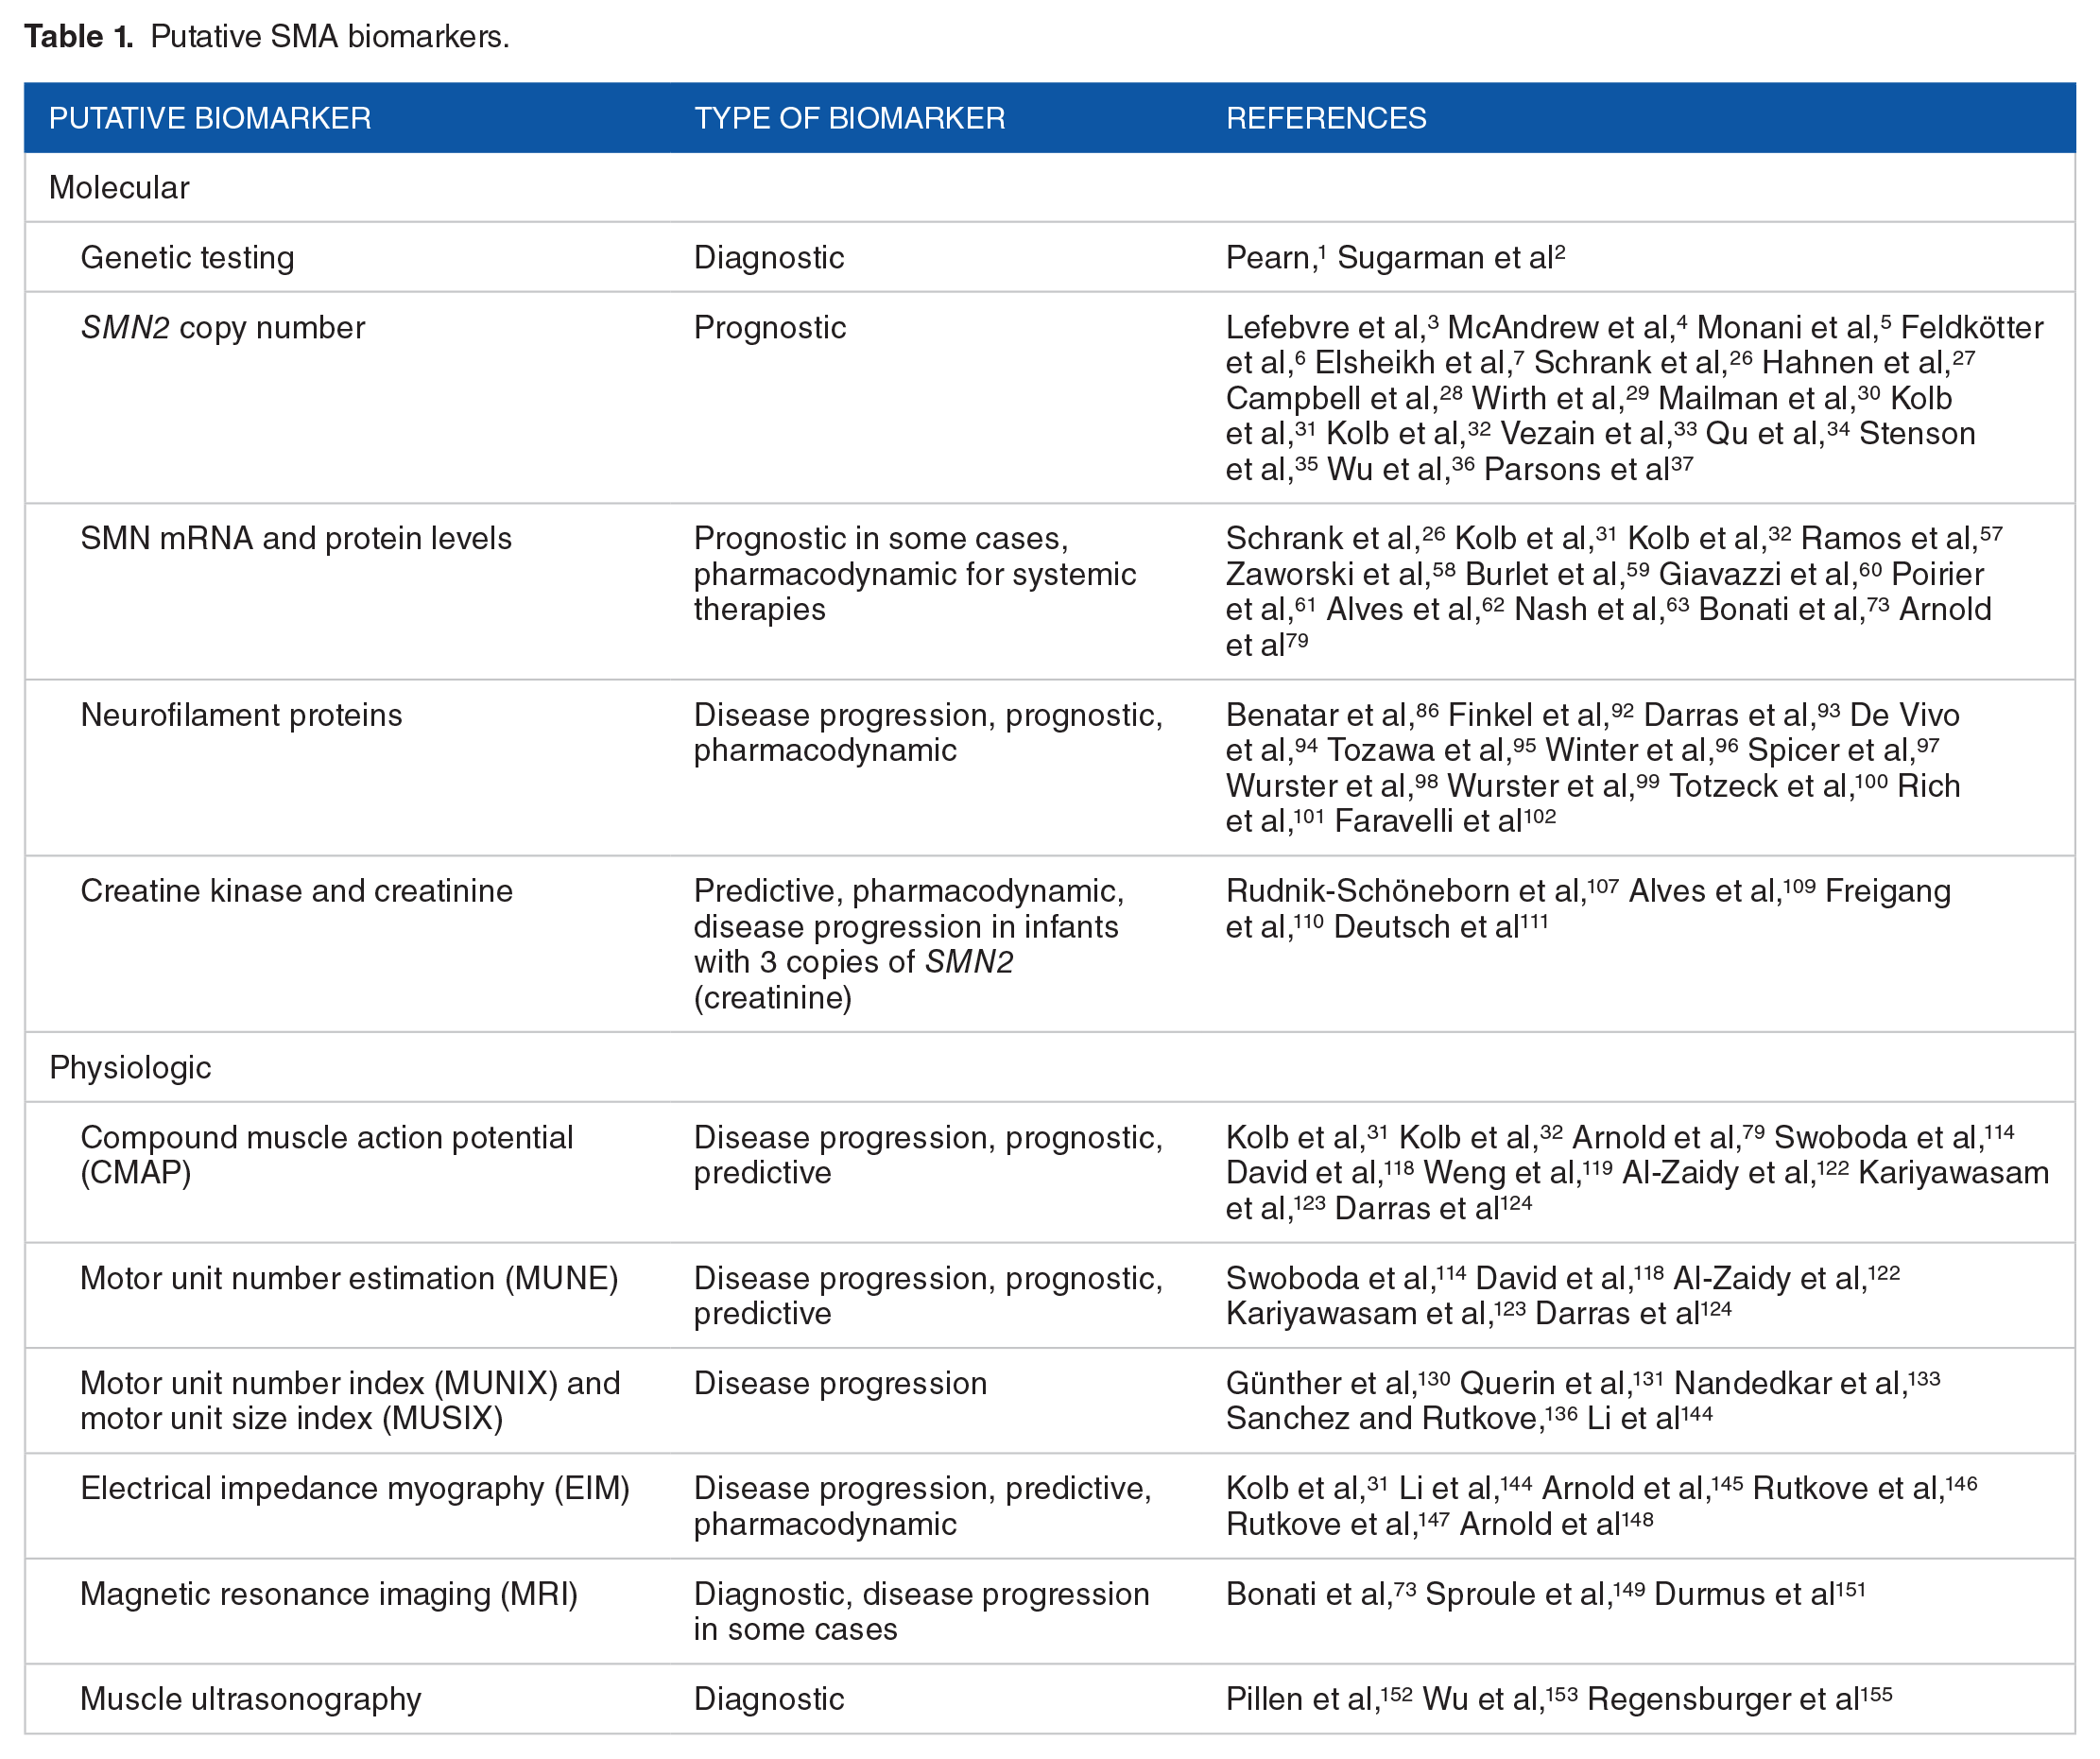
Biomarkers provide a powerful means of measuring and evaluating the spectrum of neurological disease, from diagnosis to death. These measures may include direct evaluations of biological media, such as blood or cerebrospinal fluid (CSF), as well as technologies measuring changes in the physiology or function of the nervous system. In this update, we review the current biomarkers available for detecting and monitoring biological and clinical features of SMA (Table 1). The ideal biomarker for SMA is one that is noninvasive, yet able to reflect systemic SMN levels, particularly those within protected nervous tissue. It must also be accurate and reliable. However, a single biomarker may be useful but not fulfill insights into all areas—disease progression, prognosis, and response to therapy—thus, a combination of biomarkers may provide greater insight and more accurate clinical assessment. Here, we refer to 5 classifications of biomarkers based on points of diagnosis and treatment: Diagnostic, Prognostic, Predictive, Disease Progression, and Pharmacodynamic. Markers of disease phenotype are considered “diagnostic” prior to diagnosis or “prognostic” prior to treatment initiation and afterwards are called “disease progression” markers. Likewise, markers of treatment response are considered “predictive” prior to treatment initiation and afterwards are “pharmacodynamic” markers.
Putative SMA biomarkers.
Molecular Biomarkers
Survival motor neuron 2 (SMN2) copy number
SMN2 is an SMN1 paralog differing by 2 exonic base changes, which result in a significantly decreased ability to splice out intron 7 and thus to produce full-length, functional SMN mRNA, and protein from the SMN2 gene.9,10,24,25 In humans, it is not uncommon for multiple copies of SMN2 to be present. The number of SMN2 copies, known as SMN2 copy number, is proportional to the amount of full-length SMN protein produced in humans and mouse models of SMA.5,26 Further, an inverse relationship exists between SMN2 copy number and phenotypic severity, with a higher SMN2 copy number generally associated with a milder SMA phenotype.4,27-30 In an infantile natural history study, SMA infants with fewer copies of SMN2 exhibited lower motor function scores (MFS) than those with greater copy numbers.31,32 Reduced copy number also correlated with mortality and need for invasive ventilatory support. For copy number ⩾3, however, this relationship is less consistent. Due to its inverse correlation with disease severity, SMN2 copy number remains the best means for predicting future clinical outcome in an individual who has not received therapy and thus is a useful prognostic biomarker, particularly for individuals with fewer than 3 copies of SMN2. Additionally, SMN2 copy number is typically available in conjunction with genetic confirmation of disease. However, SMN2 copy number is fixed and will not change; therefore it has no value as a marker of disease progression or treatment response.
Rare SMN2 variants have been reported that modify the SMA disease phenotype. The c.859G>C variant in exon 7, originally identified in 2 male patients with type 3 SMA, was found to promote exon 7 inclusion and reduce disease severity. 33 One of the 2 patients had only 2 copies of SMN2 (both variant), a rare finding in patients with type 3 SMA. The other patient had 3 copies; 1 variant and 2 wildtype. The c.863G>T variant in exon 7 was reported in 3 individuals (male, 2 copies, type 1; female, 3 copies, type 1b; female, 3 copies, type 2) and shown to disrupt inclusion of exon 7 during splicing, causing SMA. 34 Other small intragenic deletions and missense variants have been reported in individuals with SMA, with variable correlations between SMN2 copy number and clinical phenotype.29,35-37 Consequently, SMN2 copy number is not a reliable prognostic biomarker on its own and can be improved when variants are sought. Additional genetic modifiers outside of the SMN2 locus (Plastin 3,38-40 Coronin 1C, 41 and Neurocalcin Delta 42 ) and splicing regulators (microRNAs,43-45 long non-coding RNAs,46,47 DNA methylation,48-50 and other epigenetic modifications 51 ) have been investigated in pre-clinical settings and have the potential to be valuable prognostic biomarkers in the future.
The pressing need to identify affected individuals in pre-symptomatic or early stages of SMA, coupled with the strong prognostic power of SMN2 copy number, has led to an expansion of newborn screening for SMA. Current approaches involve detection of SMN1 deletion or intragenic mutations and quantification of SMN1 and SMN2 copy number, through a variety of laboratory methods.52,53 While specific newborn screening protocols vary by state and country, the vast majority of initial screening includes detection of SMN1 deletion for diagnostic purposes. In conjunction with or following initial screening, second-tier tests are performed to confirm positive cases, quantify copy numbers, and assess risk for infantile onset of the disease. Carrier screening is also commonly performed in prenatal settings. Identification of SMA individuals through newborn screening, particularly those with lower SMN2 copy numbers who show the greatest benefit from therapeutic intervention, allows for prompt diagnosis and treatment of affected individuals, improving clinical outcomes.
Survival motor neuron (SMN) mRNA and protein levels
SMN mRNA and protein levels reflect the extent of SMN2 gene expression, but also the resultant transcription and translation, respectively. Similar to a greater SMN2 copy number, increased mRNA and protein levels correspond to milder types of SMA.5,26 Hence, SMA therapies have primarily been focused on the development of drugs that increase SMN protein expression, especially in nervous tissue. SMN is ubiquitously expressed and thus can be detected in all cell types, 24 though previous studies have mainly measured SMN levels in blood and, less frequently, CSF. SMN expression varies between tissue types due to developmental and cell-type specific regulation.54-56 This, combined with the multitude of approaches for measuring SMN expression, has resulted in a wide range of reported expression levels and has made comparisons across studies particularly challenging.
An important study recently reported SMA levels in perinatal post-mortem tissues from SMA and control individuals. 57 SMN protein levels in the spinal cord were highest prenatally, then decreased 6.5-fold during the perinatal period (3 months before to 3 months after birth) and remained low through adolescence. 57 This is consistent with previously reported perinatal SMN declines in both mouse 58 and human.59,60 SMN1 and SMN2 gene expression showed similar trends, with the decline in SMN2 slightly preceding that of SMN1, by approximately 0 to 3 months. Developmental expression patterns of both mRNA and protein were comparable across disease-relevant tissues, including spinal cord, cortex, iliopsoas muscle, and diaphragm muscle. Collectively, these studies suggest that there is a greater need for SMN neonatally during normal development.
The ease of access to blood has made it a popular biological fluid for SMN detection, particularly when monitoring disease progression and response to therapy. For example, the first-in-human study of risdiplam demonstrated treatment-induced increases in full-length SMN2 mRNA levels, decreases in SMN2Δ7 mRNA levels, and increases in SMN protein levels in whole blood. 19 Risdiplam has recently been shown to increase SMN in CSF as well as peripheral blood. 61 Another study showed whole blood SMN protein levels negatively correlated with severity of denervation assessed by muscle electrophysiology. 62 Serum exosome-derived SMN protein levels were also reflective of disease state in mice and humans, with the quantity of SMN protein correlating with animal genotype and human disease subtype. 63 Still, there is conflicting data regarding the ability of peripheral blood to accurately reflect central SMN expression and therapeutic potential. SMN mRNA and protein levels increased following administration of valproic acid—a histone deacetylase inhibitor with therapeutic potential for SMA 64 —in multiple human cell lines including fibroblasts, but did not affect blood SMN levels nor clinical course.65-70 Endogenous SMN levels differed between tissue types, with levels in peripheral blood generally lower than those of motor neurons. 71 Importantly, these studies showed that even with the intended pharmacodynamic effect of increased histone acetylation with valproic acid treatment, there was no significant change in SMN levels. Results such as these, where a drug has its intended molecular effect but no clinical effect, shape how negative results should be interpreted in a clinical trial. A direct test of how SMN levels respond when motor neuron levels are changed was performed in a postnatal porcine model of SMA induced by the intrathecal delivery of an shRNA to decrease the porcine Smn expression. 72 While SMN mRNA levels were effectively reduced in motor neurons, as measured from laser captured microdissected motor neuron samples, there was no reduction in SMN mRNA level in blood. 72 This demonstrated a key limitation of peripheral blood biomarkers: mRNA and protein levels measured from blood, while convenient to obtain, do not necessarily reflect biological mechanisms occurring at the motor neuron—highlighting the importance of increasing SMN expression in accessible, as well as relevant, cell and tissue types.
Results from the previously described natural history study of infantile SMA also demonstrated a reduction in SMN protein levels in SMA infants compared to age-matched healthy infants. 31 There was no correlation between age and SMN levels in either cohort, though SMN protein levels varied widely. A later study confirmed reduced SMN levels in SMA patients, but levels remained stable despite rapidly changing motor function—increasing in healthy infants and decreasing in SMA infants—and thus no correlation with MFS was identified. 32 Of note, SMA infants at enrollment were already exhibiting disease symptoms and had reduced motor function compared to controls. Another group also reported stability in SMN mRNA and protein levels over the course of a year, and levels did not correlate with either muscle function or structural muscle integrity as measured by functional clinical scales, such as Motor Function Measure (MFM), 6-Minute Walk Test (6MWT), and quantitative MRI (qMRI) of thigh muscles. 73 Further, in a cross-sectional study evaluating SMN gene and protein expression in whole blood, there was no difference in SMN expression levels nor any other changes in gene expression correlating with disease severity between SMA and healthy cohorts. 74 This suggests that the degree of SMN protein level decline seen in SMA patients is not sufficient to cause a comparable decline in gene expression or splicing in peripheral blood mononuclear cells.
Numerous groups have utilized pharmacologic agents to increase SMN levels,75-78 2 of which ultimately achieved FDA approval (nusinersen and risdiplam).19-21 An additional agent which has not received FDA approval, morpholino antisense oligonucleotide (ASO), was used in an SMNΔ7 mouse line to target ISS-N1, a negative splice regulator downstream of exon 7. 79 ASOs are able to block splice modulating gene sequences to allow for, in the case of SMN2, incorporation of exon 7 and restoration of SMN levels.80-82 A single injection of ASO increased SMN levels in both SMA and heterozygote mice, though not to the levels of control animals. More remarkably, morpholino ASO increased the median survival of SMNΔ7 mice from 2 to over 14 weeks. However, ASO delivery and distribution was systemic rather than tissue-specific as intended, there was a high level of variability in SMN levels between tissue types, and there was an age-related decline in SMN expression in all tissues. This alteration of SMN levels in non-central nervous system (CNS) tissues raises the interesting question of how systemic restoration could affect the utility of peripheral biomarkers in monitoring disease progression or treatment response.
While SMN mRNA and protein may provide some insight into current disease state, they have not been shown to change over time, making them poor candidates for monitoring disease progression and response to therapy. Further, SMN measured in blood is not necessarily reflective of levels in motor neurons or other nervous tissue. Nevertheless, blood SMN levels may prove to be an accessible and useful tool in understanding the systemic response to CNS-targeted therapies aimed at increasing SMN levels.
Neurofilaments (NFs)
Neurofilament (NF) is a cytoskeletal protein that regulates axonal caliber and maintains the structural integrity of the axon. It is released from neurons following injury, and elevated NF levels can be detected in both blood and CSF.83,84 With a half-life nearing 8 months, NF may offer insight into axonal changes occurring many weeks prior to measurement. 84 The majority of NFs are high molecular weight, phosphorylated proteins—known as phosphorylated neurofilament heavy chain (pNF-H)—which display enhanced resistance to protein degradation.83,85 NF also exists in light (NF-L) and medium chain conformations. As markers of active axonal loss, NF proteins have previously been studied in the context of axonal injury, degeneration, and disease. 84 Disease-related elevations in both NF-L and pNF-H have been demonstrated in such disorders as amyotrophic lateral sclerosis (ALS),86-88 Charcot-Marie-Tooth disease, 89 and Alzheimer’s disease.90,91 Over the last few years, there has been a surge in studies investigating the utility of NF proteins as biomarkers for SMA, particularly in patients receiving nusinersen. Nusinersen, now FDA-approved for all patients with SMA, is an antisense oligonucleotide that modifies SMN2 splicing to promote the inclusion of exon 7 in the spliced mRNA transcript, thereby increasing the expression of full-length SMN protein. Due to ease of measurement in blood, NF proteins offer a feasible avenue for monitoring neurodegeneration.
Plasma and CSF NF levels have been shown to be elevated in SMA patients, predict disease severity prior to nusinersen treatment, and decline rapidly within 2 months of treatment onset. Using samples longitudinally collected from participants of the ENDEAR phase III clinical trial of nusinersen in infants with SMA type 1, 92 baseline plasma pNF-H levels were higher in healthy infants (age <1 year) than in older healthy children (age 1-18 years), as well as in symptomatic SMA infants as compared to age-matched healthy infants. 93 This indicated early axonal degeneration consistent with the natural history of SMA. Higher baseline pNF-H correlated with earlier age of diagnosis and symptom onset and lower baseline motor function, and this inverse relationship persisted across age groups. Over time, pNF-H declined to baseline levels in both sham control and nusinersen-treated cohorts, though much more rapidly in the cohort of SMA patients receiving nusinersen therapy. pNF-H levels remained elevated at later timepoints in both cohorts of diseased individuals, regardless of treatment status. Thus, plasma pNF-H may inform and guide future clinical care from both prognostic and pharmacodynamic standpoints. In presymptomatic SMA infants treated with nusinersen as part of the single-arm phase II NURTURE trial, plasma pNF-H at baseline and day 64 correlated with future motor milestones and were the strongest predictors of future motor function achievement. 94 Two independent n-of-1 studies of non-ambulatory SMA type 1 infants with 2 SMN2 copies receiving nusinersen therapy further demonstrated neurofilament trends in CSF.95,96 These studies recapitulate the rapid decline in NF levels observed following nusinersen administration, with additional evidence to correlate NF levels with clinical presentation and support the utility of NF proteins as prognostic and pharmacodynamic biomarkers for SMA.
Though NF proteins appear to be consistently informative biomarkers for infants with SMA, they have been less successful as markers for individuals with chronic forms of SMA. CSF NF protein levels are not elevated in later-onset adolescent and adult SMA patients, and this has been further demonstrated in mice. 97 In a study of 25 adolescent and adult patients with SMA type 2 (n = 9) or 3 (n = 16), no significant difference was identified between median CSF pNF-H or NF-L levels between SMA patients and controls, either at baseline or after 4 injections of nusinersen. 98 The same group then conducted a follow-up study to investigate whether this finding was because NF levels in CSF are less elevated than in blood. Again looking at SMA type 2 (n = 20) and 3 (n = 26) patients receiving nusinersen therapy, they compared NF-L levels in CSF and serum and found no correlation. 99 Additionally, after 14 months of treatment, serum NF-L levels remained nearly constant from baseline levels, demonstrating no change with treatment. Interestingly, higher serum NF-L levels were associated with worse motor performance, though changes in motor function did not correlate with changes in serum NF-L. A third study monitored NF levels in adults with SMA type 3, specifically at the time they were receiving loading doses of nusinersen. 100 Serum and CSF were collected from 11 adults prior to loading with nusinersen and analyzed for several markers of axonal injury, including pNF-H, tau protein, S100B protein, and neuron-specific enolase. SMN2 copy number ranged from 3 to 7 copies, and 9 of the 11 patients had retained the ability to walk at the start of the study. Three nusinersen loading doses were administered at 14-day intervals and then a fourth dose 30 days later. The study found that none of the markers were significantly elevated in CSF and there was no correlation with clinical presentation. In both healthy and SMA adults, an age-related increase in baseline CSF NF levels was observed, though neither plasma nor CSF NF levels changed in SMA adults in response to nusinersen treatment and levels were comparable to healthy controls. 101 A recent publication also demonstrated that serum pNF-H levels in SMA type 2 and 3 patients are slightly reduced compared to healthy controls, which may reflect CNS motor pool exhaustion resulting from chronic disease. 97 Taken together, these studies suggest that NF proteins may not be informative biomarkers for monitoring disease progression or treatment response in adolescent or adult types of SMA, at any point throughout the disease course.
Due to the slower disease progression of SMA types 2 and 3 compared to type 1, in addition to the greater variability in clinical course—especially in type 3—subtle declines in motor function may elicit correspondingly subtle elevations in markers of axonal degeneration. Furthermore, due to the long disease duration prior to receiving treatment, considering that nusinersen did not gain FDA approval until 2016, preexisting loss of motor neurons in the adolescent and adult SMA patients studied as part of the studies outlined above may obscure the true utility of NF proteins as prognostic or pharmacodynamic biomarkers. For example, 1 study assessed changes in pNF-H and NF-L levels in the CSF of 12 adults with SMA type 3—who were on average 6 years younger and had disease durations nearly 10 years shorter than those patients examined in the above adult SMA studies—before and after nusinersen therapy and found significant declines in pNF-H and NF-L after just 6 months of nusinersen therapy. 102 CSF samples were collected immediately prior to the first administration and again 6 months later on the last administration. Except for 1 patient with only 2 copies, all patients had either 3 or 4 copies of SMN2. Further, 9 patients were independently ambulant at initiation of the study. Baseline CSF levels of pNF-H and NF-L were comparable to controls and significantly below those of SMA type 1 patients previously reported. After 6 months of treatment, both pNF-H and NF-L levels significantly decreased while motor function, as assessed by the Hammersmith Functional Motor Scale Expanded (HFMSE) and 6MWT, only slightly improved. However, no correlation existed between NF levels and motor function scores. An important consideration is that many older SMA patients experience significant complications such as scoliosis and joint contractures, in addition to potential floor and ceiling effects, that limit the accuracy of motor function tests. Nonetheless, NF proteins may indicate early biochemical effects of nusinersen treatment on axonal degeneration that precede changes in motor performance. As patients begin to be treated at much earlier timepoints in their disease course given the current availability of approved therapies, there remains promise that NF proteins may provide insight into disease progression and treatment response for SMA patients of all types.
Spinal muscular atrophy multi-analyte panel (SMA-MAP) protein analytes
In 2012, an unbiased effort to identify novel candidate biomarkers through proteomic, metabolomic, and transcriptomic approaches resulted in the identification of protein analytes that were associated with motor function in SMA. The Biomarkers for SMA (BforSMA) study was a cross-sectional-omics study that evaluated blood and urine protein analytes in children (age 2-12 years) with genetically confirmed SMA and age-matched healthy controls. 74 Analytes were assessed for association to the Modified Hammersmith Functional Motor Scale (MHFMS), an instrument for measurement of disease severity. 103 A resulting 200 candidate biomarkers were found to correlate with MHFMS scores, and the most significant markers across all outcome measures were plasma protein analytes. When analyzed in conjunction with MHMFS scores, 3 analytes (dipeptidyl peptidase-IV, osteopontin, tetranectin) showed increased plasma levels and positive correlations with MHMFS, while 2 (fetuin-A, vitronectin) showed decreased plasma levels and negative correlations with MHMFS.74,104 These parallel alterations suggest that changes in SMA phenotype may not be directly attributable to the disease itself or to changing SMN levels, but instead represent compensatory molecular changes that may affect other pathways indirectly influencing the disease course. Twenty-seven of the BforSMA protein analytes were ultimately included in a commercial multi-analyte panel (SMA-MAP) based on correlations with motor function and/or non-motor outcome measures, such as pulmonary function and quality of life. 104 These analytes are listed in Table 2.
SMA-MAP protein analytes.

Excluding SMN2 > 2.
A subset of the protein analytes were studied in an SMNΔ7 mouse model, where a few were shown to be responsive to both SMA phenotype and postnatal SMN restoration. Five analytes (dipeptidyl peptidase-IV, fetuin-A, osteopontin, tetranectin, vitronectin) were significantly altered in SMA mice compared to wildtype controls, and levels normalized following morpholino ASO treatment and subsequent SMN restoration. 79 Four of these 5 analytes—excluding fetuin-A—also correlated with SMN levels in brain, spinal cord, liver, and quadriceps muscle. Further, vitronectin correlated with compound muscle action potential (CMAP) amplitude, a well-established measure of motor function. Thus, there is a pre-clinical suggestion that these analytes may serve as biomarkers of treatment response. At P90, well after ASO efficacy has diminished, 80 tetranectin and vitronectin still showed a significant change in plasma level directionally consistent with earlier time points and with prior studies mentioned here. Thus, these 2 protein analytes may be suitable candidates for pharmacodynamic biomarkers, monitoring long-term response to therapy and assessing both need for and timing of retreatment.
The NeuroNEXT SMA infant biomarker study identified a handful of protein analytes that were altered in the serum of SMA infants (age <6 months)—a much younger population than in the original BforSMA study—compared to healthy infants of the same age. 31 In SMA infants, 5 analytes showed reduced levels (cadherin-13, cartilage oligomeric matrix protein, insulin-like growth factor binding protein 6, peptidase D, tetranectin) while 2 showed increased levels (myoglobin, chitinase-3-like protein 1). These analytes distinguished between healthy and SMA infants at both baseline and later time points. Six analytes showed a negative correlation with age in both cohorts (AXL receptor tyrosine kinase, cartilage oligomeric matrix protein, complement component C1q receptor, fibulin-1C, tenascin-X, thrombospondin-4). Serum concentrations of many analytes were reduced with age in both healthy and SMA infants, suggesting a general trend of declining analyte concentration with increasing age independent of disease status, with 2 notable exceptions being apolipoprotein B and serum amyloid P-component in SMA infants. While no general conclusions can be drawn about the SMA-MAP protein analytes as a whole, the ability of specific analytes to reliably distinguish between SMA and control cohorts supports their utility as potential prognostic markers in infantile SMA.
Creatine kinase (CK) and creatinine (Crn)
The creatine kinase (CK) system is essential for maintenance of energy homeostasis and skeletal muscle function.105,106 CK is an enzyme that catalyzes the reversible transfer of phosphate to creatine, generating phosphocreatine, which acts as a rapidly mobilizable energy reserve primarily in skeletal muscle. Elevated CK activity has been observed in SMA, especially in patients with milder, chronic forms of the disease, likely due to greater preserved muscle mass or degree of activity. 107 Creatinine (Crn) is a metabolic waste product of the CK system and a marker of muscle mass, previously shown to correlate with disease severity in other denervating motor neuron diseases such as spinal and bulbar muscular atrophy (SBMA). 108
Serum Crn inversely correlates with disease severity in children and adolescents, when corrected for age and lean mass. In a study of 238 patients with SMA, Crn was highest in type 3 patients and lowest in type 1 patients, and levels decreased with age regardless of clinical subtype. 109 This trend persisted when patients were grouped based on SMN2 copy number, motor function (categorized as walkers, sitters, or nonsitters based on HFMS performance), and severity of denervation measured through maximum CMAP amplitude and MUNE. Pre-symptomatic infants (n = 22) were further assessed for changes in serum Crn throughout the first year of life. Both CMAP and Crn declined over a period of approximately 3 months, with Crn changes slightly preceding CMAP changes in the sub-population of infants with 3 SMN2 copies. At this early time period, when compensatory reinnervation may be aiding in stabilization of CMAP, serum Crn may present a more sensitive marker of early denervation and disease progression in this specific population.
In adults, serum CK and Crn correlate with motor function and disease severity status, and baseline levels can distinguish nusinersen treatment responders from non-responders. In a study of treatment-naïve adults with SMA types 2 (n = 70) and 3 (n = 136), CK was elevated in SMA type 3 and ambulatory patients, as well as in patients with SMN2 copy number ⩾4. 110 In patients treated with nusinersen (n = 68-85), improvements in motor function were observed over a period of 18 months, in conjunction with a decline in CK and a slight increase in Crn. Baseline measures of CK and Crn were much higher in treatment responders (⩾1 increase on HFMSE score) compared to non-responders (⩾1 decrease on HFMSE score). CK declined more significantly in responders, while Crn increased more notably in non-responders. An additional study found that urine Crn can distinguish healthy (n = 3) from pre-treated SMA (n = 24) cohorts, but that levels are not significantly altered in response to nusinersen therapy. 111 Taken together, these studies suggest that serum CK and serum Crn may be useful predictive and pharmacodynamic biomarkers for SMA.
Electrophysiology and Imaging Biomarkers
Compound muscle action potential (CMAP) and motor unit number estimation (MUNE)
Electrophysiology has long been used as a method for the quantification of neuromuscular function in the setting of motor neuron disorders.112-114 It allows for in vivo assessment of motor unit connectivity and can provide insight into disease progression and the relationship between muscle connectivity and function.115-117 CMAP represents the total electrical output of the motor units innervating a single muscle or group of muscles following supramaximal nerve stimulation. The output of a single motor unit, the single motor unit potential (SMUP), is instead the average of 10 incremental, submaximal nerve stimulations. Motor unit number estimate (MUNE), a quantification of the number of motor units innervating a muscle, can then be easily calculated as ratio of the output of all motor units to that of a single motor unit, equivalent to CMAP divided by SMUP.
Electrophysiology assessments of neuromuscular function during the early postnatal period demonstrated that both CMAP and MUNE were reduced in SMA mice by postnatal week 2, and that these responses could be corrected by day 30 via treatment with morpholino ASO that restored SMN levels. 118 Electrophysiology measurements were performed on the right hindlimb, specifically the triceps surae muscle, of SMNΔ7 mice under anesthesia. Consistent with these findings, a follow-up study verified that CMAP was significantly reduced at day 12 in SMA mice. 79
In humans, CMAP and MUNE are also decreased in SMA and correlate with SMN2 copy number, SMA subtype, and patient age. A study of SMA type 1, 2, and 3 patients (age 1 month-50 years) showed that lower copy number correlates with lower CMAP values and worse functional outcomes. 114 This finding was replicated in an additional study of 12 SMA type 1 infants, identified through NBS, where CMAP was significantly lower in infants with 2 copies of SMN2 than 3 copies. 119 Further, CMAP declines in an age-dependent manner. In infants, CMAP positively correlates with motor function, as assessed by the Test of Infant Motor Performance Screening Items (TIMPSI) 18 and The Children’s Hospital of Philadelphia Infant Test of Neuromuscular Disorders (CHOP-INTEND),120,121 in SMA infants but not in healthy infants.31,32 However, this correlation was not replicated when analyzing only the subgroup of SMA infants with 2 copies of SMN2, which typically corresponds to SMA type 1. CMAP was later assessed in 12 SMA type 1 infants receiving AAV9-mediated gene replacement therapy with onasemnogene abeparvovec and was shown to improve with treatment after just a few months. 122 Treated infants were compared to untreated SMA type 1 infants from the infantile SMA natural history study. Both cohorts of infants had similar baseline CMAP values. SMA infants receiving onasemnogene abeparvovec treatment demonstrated increases in CMAP peak area and peak amplitude values, alongside improved motor function and motor milestone achievement. In treated SMA infants, CMAP values showed the largest increases from baseline (6 months) to 12 months of age—increasing from 1.1 to 2.8 mV—and continued to increase or stabilized through 24 months. The motor function decline seen in untreated SMA type 1 infants was halted, and even reversed to an extent, though not to normal, healthy infant capacity. In a small study of infants (n = 12), changes in CMAP of the ulnar nerve were monitored prior to initiation of nusinersen therapy and periodically throughout treatment. 119 Interestingly, a pre-treatment CMAP amplitude of 2 mV appeared to delineate infants who achieved normal motor milestones (>2 mV) from those who still showed functional improvements, yet at a slower rate (<2 mV). Those that had more rapid increases in CMAP post-treatment tended to have better functional outcomes. Thus, CMAP may be a sensitive method for detection of disease onset and transition from presymptomatic to symptomatic, and may help inform optimal timing for treatment.
In a prospective study of 20 symptomatic SMA children (ages 4 months-16 years) undergoing nusinersen treatment, individuals with shorter disease durations showed greater increases in CMAP and MUNE, and these measures correlated with functional changes assessed by CHOP-INTEND and HFMSE. 123 In children with later-onset SMA (ages 2-15 years), CMAP and MUNE fluctuated slightly but were generally stable over 3 years of nusinersen treatment. 124 SMA type 2 children (n = 11, average age 15.4 months at diagnosis) showed progressive improvements in motor function and the majority demonstrated clinically meaningful improvements by the end of the study, while SMA type 3 children (n = 17, average age 43.6 months at diagnosis) showed only modest, and few clinically meaningful, functional improvements. Additionally, MUNE progressively decreased in type 3 children, despite therapeutic intervention, indicating that age and severity of denervation at the time of treatment initiation may significantly influence treatment response. These studies suggest that electrophysiological measures may be markers of treatment response, predicting which individuals will be functionally stable and which will achieve significant gains in motor function following treatment, though limitations regarding disease duration must be considered.
As techniques and interrater reliability continue to improve, the studies outlined above instill confidence in electrophysiology techniques such as CMAP and MUNE as reliable markers of motor unit loss accompanying disease progression in SMA.
Motor unit number index (MUNIX) and motor unit size index (MUSIX)
MUNIX is a non-invasive electrophysiology technique that utilizes surface electromyography to estimate the number of functional motor units within a muscle. Requiring minimal nerve stimulation compared to other current MUNE methods, MUNIX is able to quantify and monitor motor unit loss longitudinally with appropriate reliability and validity.125-128 MUSIX provides information regarding the size of individual motor units and is computed as CMAP amplitude divided by MUNIX for a given muscle. 129 MUNIX and MUSIX have recently been used as outcome measures for patients with SMA to monitor functional changes in hand muscles.
MUNIX of the hand muscles strongly correlated with disease score independent of stage and could provide insight into overall disability and disease progression in adults with SMA types 3 and 4. 130 MUNIX correlated with both muscle strength and disability in adult SMA patients and was able to detect motor neuron loss with greater sensitivity than CMAP. 131 Only severely affected muscles showed reduced CMAP, whereas MUNIX was reduced in all hand muscles compared to controls independent of symptom severity, indicating its utility in detecting motor neuron loss at varying disease stages. Further, MUSIX was increased in patients with SMA, which was attributed to active re-innervation and collateral axonal sprouting similar to what has been observed in ALS.132-135 Interestingly, motor unit loss in hand muscles was not evenly distributed, resulting in a specific hand muscle wasting pattern in SMA patients (“reverse split hand,” preserved thenar index)—highlighting a pattern of motor unit loss distinct from that of ALS (“split hand,” thenar weakness with hypothenar sparing). A preserved thenar index was able to discriminate SMA from ALS and controls with high sensitivity and specificity. MUNIX was able to be recorded even at very advanced stages of the disease and thus may present a new method by which to monitor disease progression in SMA patients of any age and throughout the course of disease.
Electrical impedance myography (EIM)
Electrical impedance myography (EIM) is a bioimpedance-based non-invasive technique that allows for voltage measurement of a localized muscle region following the application of a high-frequency electrical current. 136 This metric has been used in the context of motor neuron disease to reflect changes in the overall composition and health of muscles. EIM has been used in neurogenic disorders with marked muscle atrophy such as ALS due to easy assessment of multiple limbs and reliable tracking of disease progression in both mice and humans.137,138 EIM also correlates with electrophysiologic measures including CMAP and MUNE in mouse models of ALS.139,140 Further, EIM has widely been applied in myogenic disorders with relatively limited muscle atrophy, in particular in Duchenne muscular dystrophy (DMD). EIM discriminates between DMD and healthy male children, associates with disease progression, and is sensitive to treatment.141-143 EIM is especially useful in pediatric settings given its ease of application and simplicity compared to standard electrophysiological measures.
Specific EIM metrics have been shown to distinguish between SMA and healthy cohorts in both pre-clinical and clinical settings. EIM 50 kHz phase was reduced in Smn1c/c mice, a mild animal model of SMA, but not in wildtype mice. 144 EIM correlated with motor neuron counts in the spinal cord as well as SMN levels in mice at 1 year, in both SMA and control animals. Therefore, EIM may be a sensitive measure of muscle status in mild forms of SMA. In the more severe SMNΔ7 mouse model, EIM detected significant differences between SMA controls and SMA mice treated with ASOs to increase SMN protein for late (symptomatic) but not early (pre-symptomatic) treatment groups. 145 EIM measures also correlated with CMAP and MUNE in the late treatment group, reflecting a reduction in the number of motor units and a delay in the normalization of muscle potential underlying symptomatic ASO treatment. The ability of EIM to discriminate treatment groups, and thus the effect of ASO interventional timing on resulting motor neuron function, makes EIM a promising biomarker of treatment stratification and effect for SMA patients undergoing treatment.
Healthy children demonstrate increased EIM measures, an indication of muscle growth and development, compared to children with SMA type 2 and type 3 who display relatively stable measures over time. 146 However, SMA infants, the youngest cohort to be studied at the time of publication, have also shown increasing EIM measures over time. 31 Of the EIM outcome measures, only high-frequency reactance slope was able to discriminate between SMA infants and controls, contrary to previous studies in older children.146,147 This may have been due to differing impedance spectral characteristics between infants and older children that were not clarified until after this study was conducted. 148 In general, EIM positively correlated with age for both cohorts. There were no correlations between EIM and motor function in the SMA cohort, regardless of copy number. More studies in humans are necessary to determine the utility of EIM as an SMA biomarker, though its clinical feasibility and historical accuracy in tracking disease progression in other motor neuron diseases imbue optimism.
Overall, electrophysiologic measures have proven to be reliable markers of SMA disease progression, especially when multiple measures are used in conjunction and when evaluations assess multiple regions of motor neuron output. Techniques are becoming increasingly precise at detecting neuromuscular changes even before symptoms arise. The ability to quantify these changes at such early time points will guide clinical therapies and allow for pharmacologic interventions earlier in the disease course.
Magnetic resonance imaging and muscle ultrasonography
Quantitative magnetic resonance imaging (qMRI) has been identified in previous studies as a non-invasive technique yielding more sensitive and less biased measures of muscle physiology than conventional functional scales in the context of neuromuscular disease.149,150 A year-long observational study of 18 ambulatory patients with SMA type 3 (mean SMN2 copy number of 3.8) concluded that qMRI, while reliable, was not predictive of SMA disease progression. 73 SMA patients showed a reduction in thigh muscle mass and density, as well as an increase in the fat to muscle ratio, when compared to healthy patients. There was no difference in biomarkers between SMA and healthy patients, and qMRI measures did not correlate with molecular markers measured in blood (SMN1 and SMN2 copy numbers, SMN1 and SMN2 expression, SMND7 expression, and SMN protein). While there was no observed change in motor function for either cohort, qMRI measures negatively correlated with MFS at all time points, suggesting that functional changes as measured by MFS may be directly reflective of underlying intramuscular structural changes assessed through non-invasive imaging methods. An additional study of 25 ambulatory SMA type 3b patients demonstrated selective involvement of proximal upper (triceps brachii) and lower (gluteus maximus) extremity muscles on MRI, a pattern that appears specific for SMA. 151 Longer disease durations correlated with worse MRI scores, evaluated using a qualitative rating scale, in proximal muscles.
Muscle ultrasonography is a non-invasive imaging technique that can be easily performed at the patient bedside and used to quickly survey multiple muscles. It has been applied as a diagnostic tool in various neuromuscular disorders including Duchenne muscular dystrophy, ALS, polyneuropathy, and specific myopathies. 152 In SMA, quantitative ultrasonography of the biceps brachii, wrist extensors, quadriceps, and tibialis anterior muscles was able to discriminate between healthy (n = 21) and SMA (n = 25) individuals, and more specifically between SMA type 2 and type 3 subtypes, based on muscle echogenicity. 153 The ratio of muscle luminosity to subcutaneous fat luminosity was highest in type 2 SMA, intermediate in type 3 SMA, and lowest in healthy individuals. However, SMA patients demonstrated increased skin-subcutaneous fat thickness compared to healthy patients and fat thickness varied with disease severity, which presented a potential confounding factor in the study. Further limitations to this technique include considerable variation in ultrasonic properties between machines, additional confounding factors such as age and sex of individuals, and inter- and intra-rater reliability. 154 A small feasibility study of 3 SMA individuals (1 of each subtype) and 3 age-matched controls reported decreased median nerve fascicle number and density in the SMA type 1 patient on ultra-high-frequency (UHF) ultrasound imaging. 155 No differences were observed between SMA type 2, SMA type 3, and controls, indicating that UHF ultrasonography may be most applicable in severe cases of SMA where changes in individual fascicle number and density may be most prominent. Given the extremely small sample size, however, future studies are warranted before any definitive conclusions can be drawn.
Overall, imaging measures have been shown to reliably differentiate between SMA and healthy patients but are ineffective at monitoring disease progression over time. Thus, MRI and ultrasonography currently lack utility as independent measures of SMA phenotype and disease course, but show promise as complementary measures to conventional functional scales with the ability to elucidate anatomo-functional relationships and contribute to future knowledge of clinical endpoints.
Conclusion
Efforts to identify biomarkers for detecting and monitoring SMA disease course have been thorough, though more work remains to be done. Genetic confirmation of SMA and SMN2 copy number remain the most accurate measures of detection, with copy number also being the strongest prognostic biomarker in untreated SMA individuals. SMN mRNA and protein levels provide insight into current disease state, but do not appear to change over time and are inconsistent between peripheral (eg, blood) and central (eg, CSF) biological samples. However, SMN levels in peripheral blood are useful to monitor the systemic response to CNS-targeting therapies that increase SMN. NF proteins have recently emerged as leading markers of SMA prognosis, disease progression, and treatment response, especially in SMA infants undergoing treatment. NF levels rapidly decline following treatment and correlate with clinical presentation in this population. Conversely, NFs are not informative biomarkers in adolescent or adult SMA populations. Certain plasma protein analytes can distinguish between SMA and control cohorts across time, are altered in SMA mice and infants, and respond to therapy in SMA mice, thus rendering them possible pharmacodynamic biomarkers. In pre-symptomatic infants with 3 copies of SMN2, serum Crn may be a sensitive marker of early denervation and disease progression, though its utility is restricted outside of this specific SMA subpopulation. In adults, serm CK and Crn reliably predict which individuals will respond to nusinersen treatment and thus may be meaningful predictive and/or pharmacodynamic biomarkers. Electrophysiology techniques such as CMAP, MUNE, and EIM reliably track motor function throughout disease course in both healthy and SMA individuals of all ages and have strong predictive ability regarding treatment effect. Electrophysiology measures may also be able to detect neuromuscular changes before overt clinical symptoms arise, allowing for earlier therapeutic intervention and guidance of clinical therapies. Imaging modalities can discriminate between SMA and healthy individuals and may reflect anatomo-functional changes, but are limited in widespread application due to current lack of equipment and rater reliability.
No single biomarker may necessarily be sufficient to monitor disease progression and treatment efficacy, but there is great potential in a combination of robust biomarkers that together allow for more accurate clinical assessment. Additional progress toward discovering and characterizing SMA biomarkers will be made as technology, natural history data, and an understanding of processes occurring at the motor neuron improve. SMA patients will continue to be treated and monitored in clinical settings. There is still much work to be done to understand variability in therapeutic efficacy and ultimately optimize treatment response. This will require a collaborative effort between clinicians and laboratory scientists to study humans as well as animals and cell models in parallel.
Footnotes
Funding:
The author(s) received no financial support for the research, authorship, and/or publication of this article.
Declaration of Conflicting Interests:
The author(s) declared the following potential conflicts of interest with respect to the research, authorship, and/or publication of this article: SJK has received compensation for consulting from Biogen, Roche, and Novartis.
Author Contributions
MGP performed the literature search, designed the tables, and wrote the manuscript under the supervision of SJK. All authors contributed to manuscript revision, read, and approved the submitted version.