
Abstract
Background and Objectives:
Next-generation sequencing (NGS) is transforming clinical diagnostics by enabling the detection of genetic variation with unprecedented precision. However, successful implementation of NGS workflows necessitates stringent quality control. This study introduces Molecular Genetics Dashboard (MGDB), a novel bioinformatics tool designed to enhance quality control in clinical NGS workflows.
Methods:
Using the Python dash framework for visualizations and MySQL databases, we have developed a novel tool for variant-level monitoring of clinical NGS sequencing runs. MGDB uses a docker-compose containerization for improved portability and can flexibly include or exclude samples from accumulated statistics with notes from interpreters.
Results:
MGDB facilitates variant-level run-to-run monitoring, ensuring the consistency of variant detection across sequencing cycles. The tool provides an interactive platform for visualizing and assessing variant data, identifying potential inconsistencies or outliers and improving data management and interpretation compared to traditional methods. MGDB was tested using samples sequenced with Oncomine Focus/Comprehensive Plus assays on S5 sequencers and analyzed via IonReporter software.
Conclusions:
MGDB offers a robust and user-friendly solution for enhancing quality control in clinical NGS workflows, contributing to greater accuracy and reliability in variant detection. The tool is freely available on GitHub: https://github.com/acri-nb/GeneticVariantsDB.
Introduction
Quality control (QC) is an essential component of any next-generation sequencing (NGS) pipeline, 1 particularly in the clinical setting where accuracy and reliability of results are paramount. Internal standards such as those available from Horizon Discovery, SeraCare, 2 the Coriell Institute for Medical Research or the College of American Pathologists (CAP)3 -5 are routinely used across sequencing batches or across individual runs in oncology to ensure that genetic variations within a particular clinical sequencing run can be reliably measured if present. These internal standards are comprised of DNA or RNA that has an expected allele frequency or read abundance, and so these standards are sequenced along with clinical samples to ensure that batch effects or technical issues are detected if present. This practice is standard in many molecular genetics labs and ensures that clinical samples sequenced in the same run as these standards can be reliably interpreted.
The complexity and size of these sequencing panels are ever increasing, with some institutions even implementing whole genome or whole exome sequencing routinely. Therefore, bioinformatics methods are becoming essential for interpretation and monitoring of test results. Several bioinformatics tools have been developed to assess the quality of NGS data at different stages of the data processing pipeline, including FastQC 6 and Qualimap 7 for the analysis of FASTQ and BAM files, respectively. Tools such as AlmostSignificant 8 and MultiQC 9 aggregate QC metrics from different sources, providing an overview of data quality.
However, these tools typically focus on high-level QC metrics, such as sequencing error rate, average depth of coverage and uniformity of coverage across the genome. 10 This approach, while very useful for identifying general data quality issues, does not assess the ability of an NGS test to reliably monitor specific variants of clinical importance through time. For example, a high average coverage depth does not guarantee reliable consistent detection of variants prone to difficulties or variants located in regions of the genome that are difficult to sequence. 11
Other studies have proposed more specific QC metrics, such as the coverage uniformity score 12 and the use of computer simulations to assess the performance of bioinformatics pipelines. 13 However, these approaches often remain limited to evaluating the overall test performance and do not allow for continuous monitoring of data quality at the single variant level.
Our work differs from these previous studies by proposing a run-to-run QC monitoring approach at the variant level. Instead of focusing on overall statistics, we report each clinically relevant variant over-time, enabling a more precise evaluation and a more sensitive monitoring of the NGS test performance across runs for somatic variant monitoring in tumor samples.
In the remainder of this article, we present the methodology for our tool. This includes a description of the workflow and the dependencies used for each of the different stages in implementation. Finally, we conclude with recommendations for potential uses of this tool, and propose some limitations and further perspectives. A separate appendix document to describe in detail how to deploy MGDB in a work environment. Our tools is available on GitHub at https://github.com/acri-nb/GeneticVariantsDB (Supplemental Appendix).
Statement of Significance
Problem or Issue
Ensuring the quality and reliability of next-generation sequencing (NGS) data is paramount in clinical diagnostics, where accurate variant detection is crucial for informing patient care. Current bioinformatics tools primarily focus on high-level quality control (QC) metrics, which may not adequately assess the consistency of variant detection, especially for rare or challenging variants.
What Is Already Known
Several bioinformatics tools exist for assessing NGS data quality, such as FastQC, Qualimap and MultiQC. However, these tools typically provide an overview of general QC metrics, such as sequencing error rate and coverage depth, without specifically monitoring individual variants of clinical interest.
What This Paper Adds
This paper introduces MGDB, a novel bioinformatics tool specifically designed for variant-level run-to-run QC monitoring in clinical NGS. Unlike existing tools, MGDB tracks the performance of each clinically relevant variant over time, enabling more precise evaluation of NGS test consistency between runs. This granular approach allows for the identification of potential issues that may not be apparent with traditional high-level QC metrics. By providing an easy-to-implement solution for variant-level monitoring, MGDB has the potential to improve the monitoring of NGS testing in clinical settings.
Methods
Molecular Genetics Dash Board (MGDB) was developed in close collaboration with molecular genetics staff at the Dr Georges-L.-Dumont University Hospital Centre in Moncton, NB, Canada. It was developed using Python and MySQL and tested for ~18 months from December 2023 to June 2024 using samples sequenced with the Oncomine Focus, Oncomine Myeloid or Oncomine Comprehensive Plus (OCA+) assays, sequenced on Genexus sequencers and analyzed using IonReporter software (ThermoFisher).
The software was deployed in Linux and reviewed iteratively by the PhD scientists working in the molecular genetics lab for feedback and readjusted several times. Sample data from standards run with Oncomine Myeloid Assay has been made available on our GitHub repository.
Workflow
This workflow is designed to automate the entire process of detection, transfer, processing and visualization of genomic data, ensuring efficient and secure data management. By integrating several automation steps, it minimizes manual intervention, reduces the risk of error and improves the speed and efficiency of data processing and interpretation. In addition, interactive data visualization enables in-depth analysis and informed decision-making, essential in the context of genomic research and precision medicine. The process begins when a new run with the expected identifier is detected on the sequencing provider platform (in our example we use Horizon Discovery standards labeled with prefix HD827). We recommend users always label internal standards with standard prefixes. This step is crucial to ensure that all new data is captured and processed in a timely manner. Once the new sequencing run has been identified, the server sends a request through the API to download the analysis results, mainly the unfiltered VCF files (via SCP protocol 14 ) into a docker container named “cronjobs.” The default API used was ThermoFisher IonReporter, since the institutional sequencing center at the Georges-L.-Dumont Hospital uses this service. However other providers may be used by modifying the Python scripts within the “cronjobs” container. The GitHub repository for HGDB includes a script for adding DRAGEN-generated (Illumina) VCF files to the database container, which has been validated using Horizon Discovery VCFs available on their website analyzed with DRAGEN. The API automation may change based on available technology; however, so long as the required VCF files are added to the MySQL database, downstream applications can access the required information.
Once the variant data has been downloaded, the VCF data is then read using Python’s PyVCF library, and key information such as sample name, time of creation, variant position, depth of coverage, allele frequency and gene annotations is read. Data is then inserted into the appropriate tables in the database container using the mysql.connector for Python. 15 Finally, a Python application (vardb.py), running in a separate container on the host machine, connects to the database, retrieves the data and displays it in an interactive dashboard using the Dash framework.
The mysql.connector is once again invoked to extract the variant information from a MySQL database and to dynamically feed the Dash application. The database schema is predefined in the Docker Compose configuration file, and therefore requires no manual initialization. The vardb.py script connects to the MySQL database using this method and reads run metadata and variant information from each sequencing experiment as a pandas dataframe. 16 Other information is read into pandas from several text files in a docker-mounted directory on the source machine, including the specific regions of interest, the sample names of internal controls that have been validated by the user, those that have been excluded due to poor quality and the comments or notes associated with each sample. Furthermore, an editable configuration file contains the IP address of the data-generation server running ThermoFisher analysis software for API use. A threshold limit is also required in this configuration file in the form of an integer. This scalar will be multiplied with the calculated run-torun standard deviation of validated samples to establish the user-defined upper and lower acceptable limits for variation of expected allele frequency (AF) for DNA or normalized counts (NC) for RNA. This is achieved using the Numpy and Scipy libraries.17,18 Therefore, if “2” is chosen, the limits displayed in graphs will be twice the standard deviation.
The two first tables in the webpage display specific variants in the selected run that have failed QC. Variant-level mean AFs or NCs, standard deviations and limits are calculated using only samples that have been manually validated. Means are calculated from average AF or NC values from validated runs. Limits are calculated by multiplying the user-defined scalar to the calculated standard deviation values. Then, the desired run is chosen with a drop-down menu. AF or NC values only for the current run are displayed side-by-side with the limits calculated from validated samples. Through conditional formatting and filtering, only the variants with AF or NC outside the upper and lower limits are highlighted for quick viewing of possible problematic variants. Regions targeted by the kit used upstream and indicated in the configuration files are expected to remain constant and any technical issue leading to dropouts will be displayed as that variant having a AF of 0. This procedure allows users to see dropouts visually, without those values being included in mean AF or variability calculations This is followed by printable signature lines and other editable typical QC thresholds that can be manually adjusted according to specific lab’s needs by changing the first line of the “serve layout” function from the vardb.py script. There is also a text box and submission button for saving comments by users to be displayed permanently for the selected run. A second clickable button serves to validate the current sample, thus including the AF and NC values in future calculations and plots. The following two tables display detailed AFs or NCs for every variant of interest in the selected run, once again with deviations and limits for all manually validated samples (Figure 1).
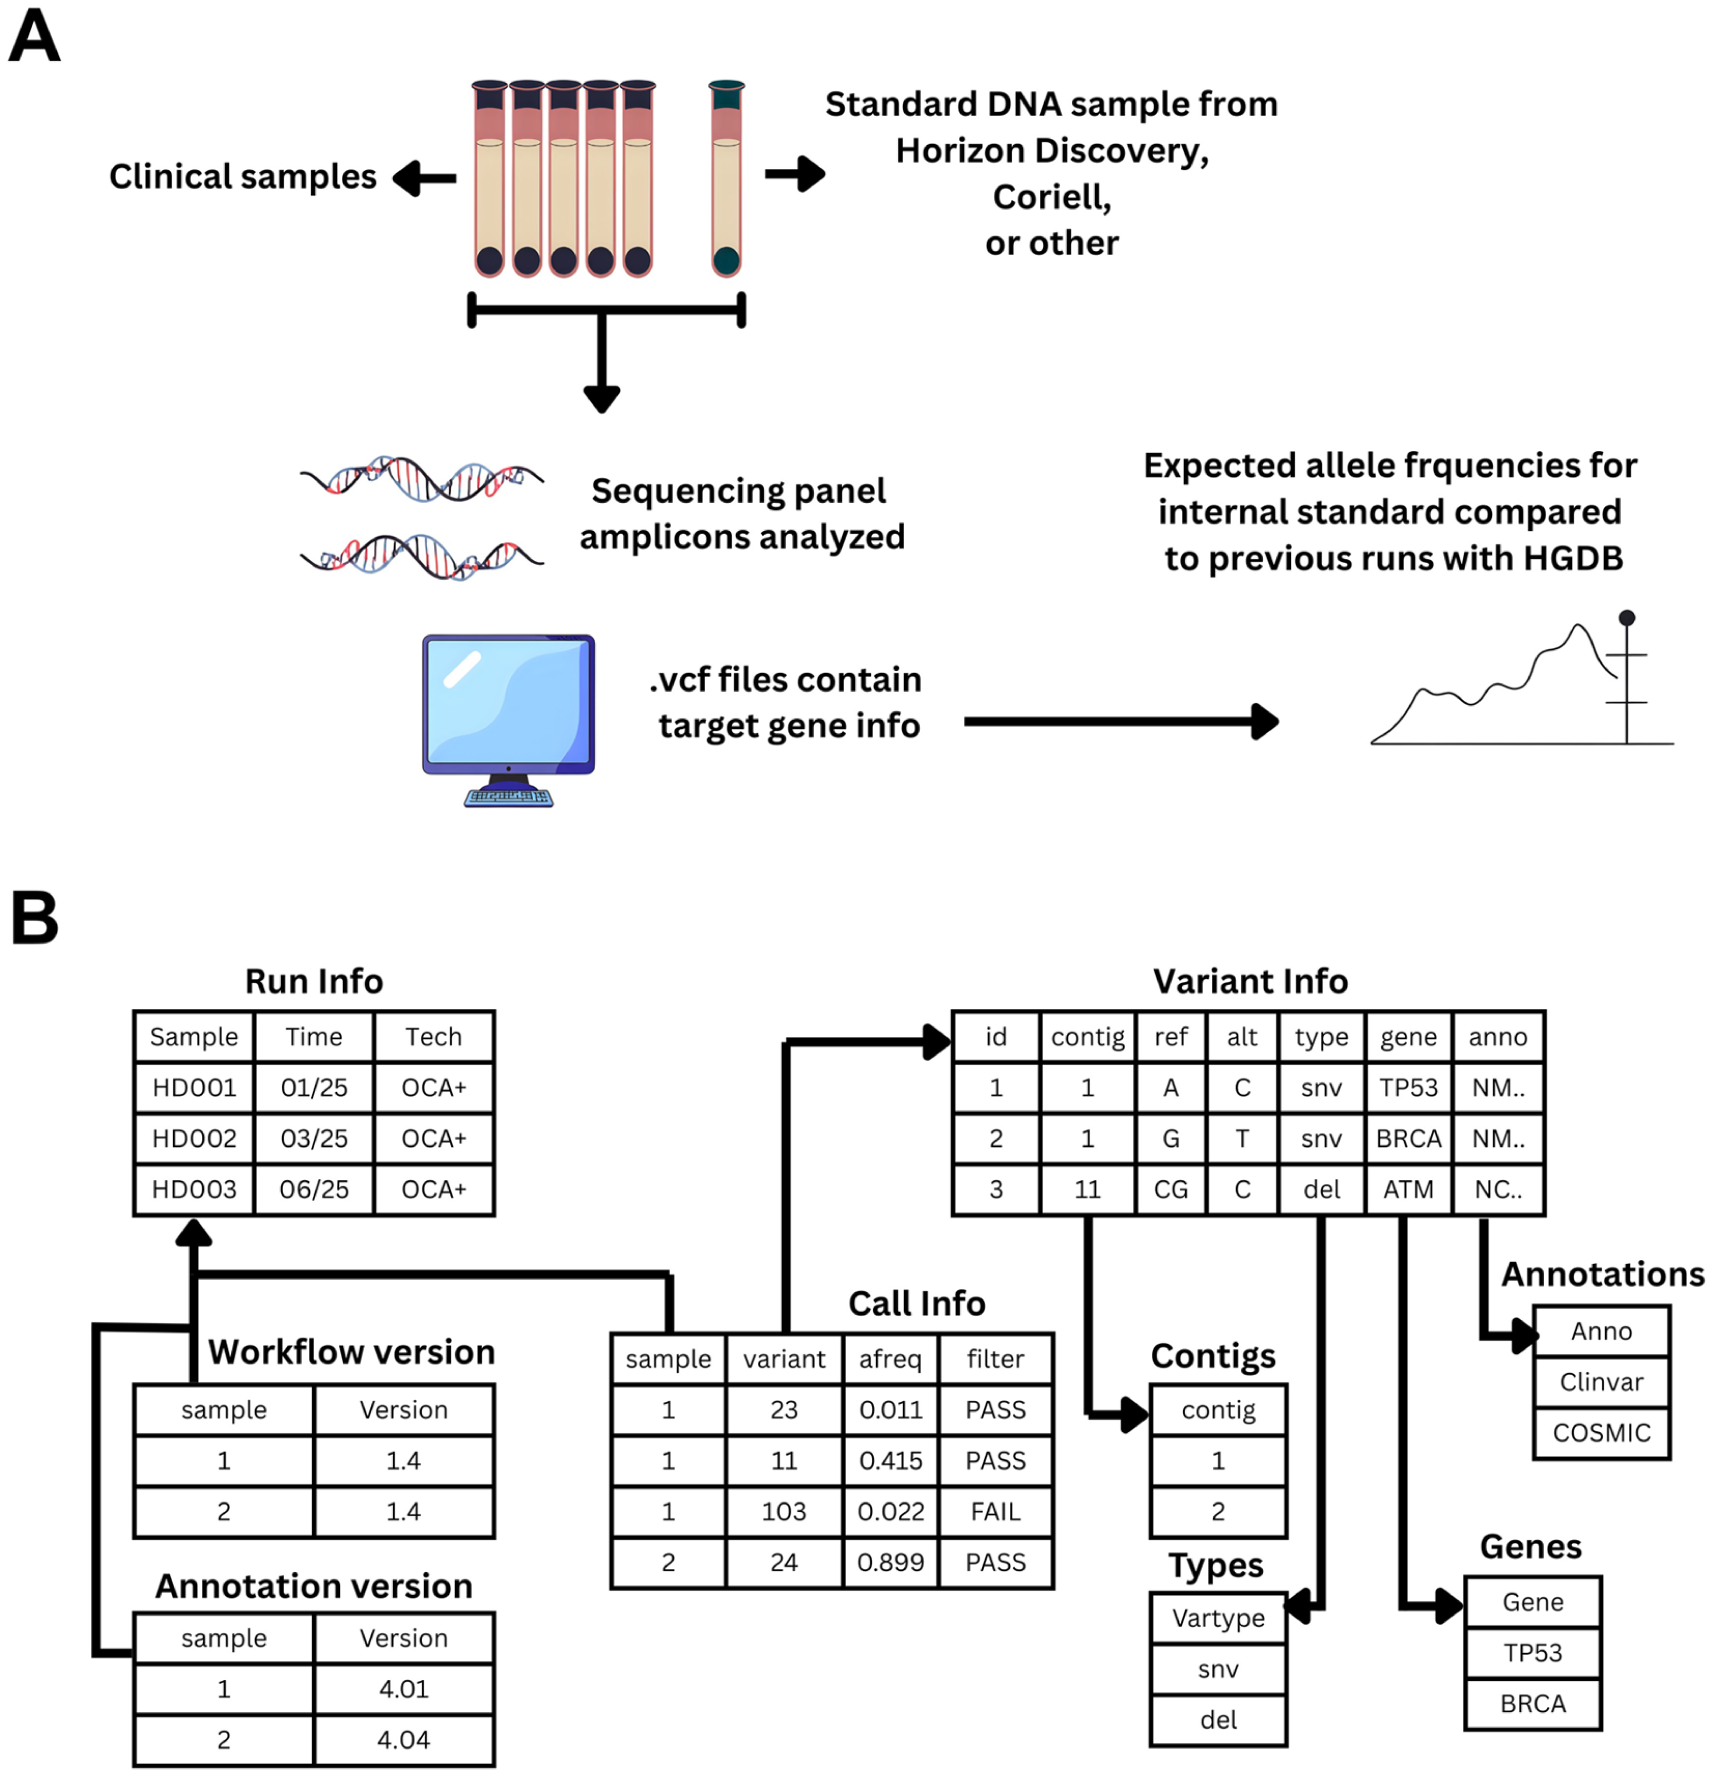
(A) Methodology for validation and testing of MGDB. Molecular oncology samples were sequenced using commercial amplicon panels with an internal standard (HD827) in every run. As AFs from standards are not expected to vary between assays, reference ranges could be defined after multiple runs. MGDB was run in parallel to manual validation for the study period. Graphs and values were confirmed by the clinical team and (B) database schema.
The final two tables summarize the means, standard deviations and limits for all manually validated samples and have selectable rows to choose specific variants, which then triggers a Levey-Jennings graph that displays the AF or NC values for the chosen variant across runs (Figure 2). Dynamic standard deviations and means are calculated using a rolling average approach. Visualizations are built using plotly. 19 This visualization of allele frequency over time allows for tracking batch effects in multiplexed data from oncology sequencing panels (Figure 2). Laboratories following Westguard rules to define performance limits in such assays can thus easily identify issues that arise with the detection of certain variants between batches or reagent lots.

Screenshot showing an example of allele frequency (%, y-axis) over time (x-axis) visualizations with Levey-Jennings graphs. AF values for internal standard (blue) over time with an example of a batch effect highlighted in red. This shows a shift above 3 standard deviations (red line) and continued trend above 1 standard deviation (green line) that would merit attention according to Westguard rules.
This dashboard is accessible via a web browser at the machine’s IP address on port 8090 by default (Figure 3), enabling users to view and interact with data in an intuitive and efficient way. All tables and graphs are faceted into either small variants or RNA fusions. Statistics are calculated on all runs leading up to a selected sample in the drop-down, thereby avoiding falsification of QC limits by outliers. Outliers or failures can be excluded from the dashboard visualization with the “delete” button at the bottom of the page, which adds the sample ID to a list of exclusions. If a sample is excluded, its values are not taken into account in the calculation of statistics.
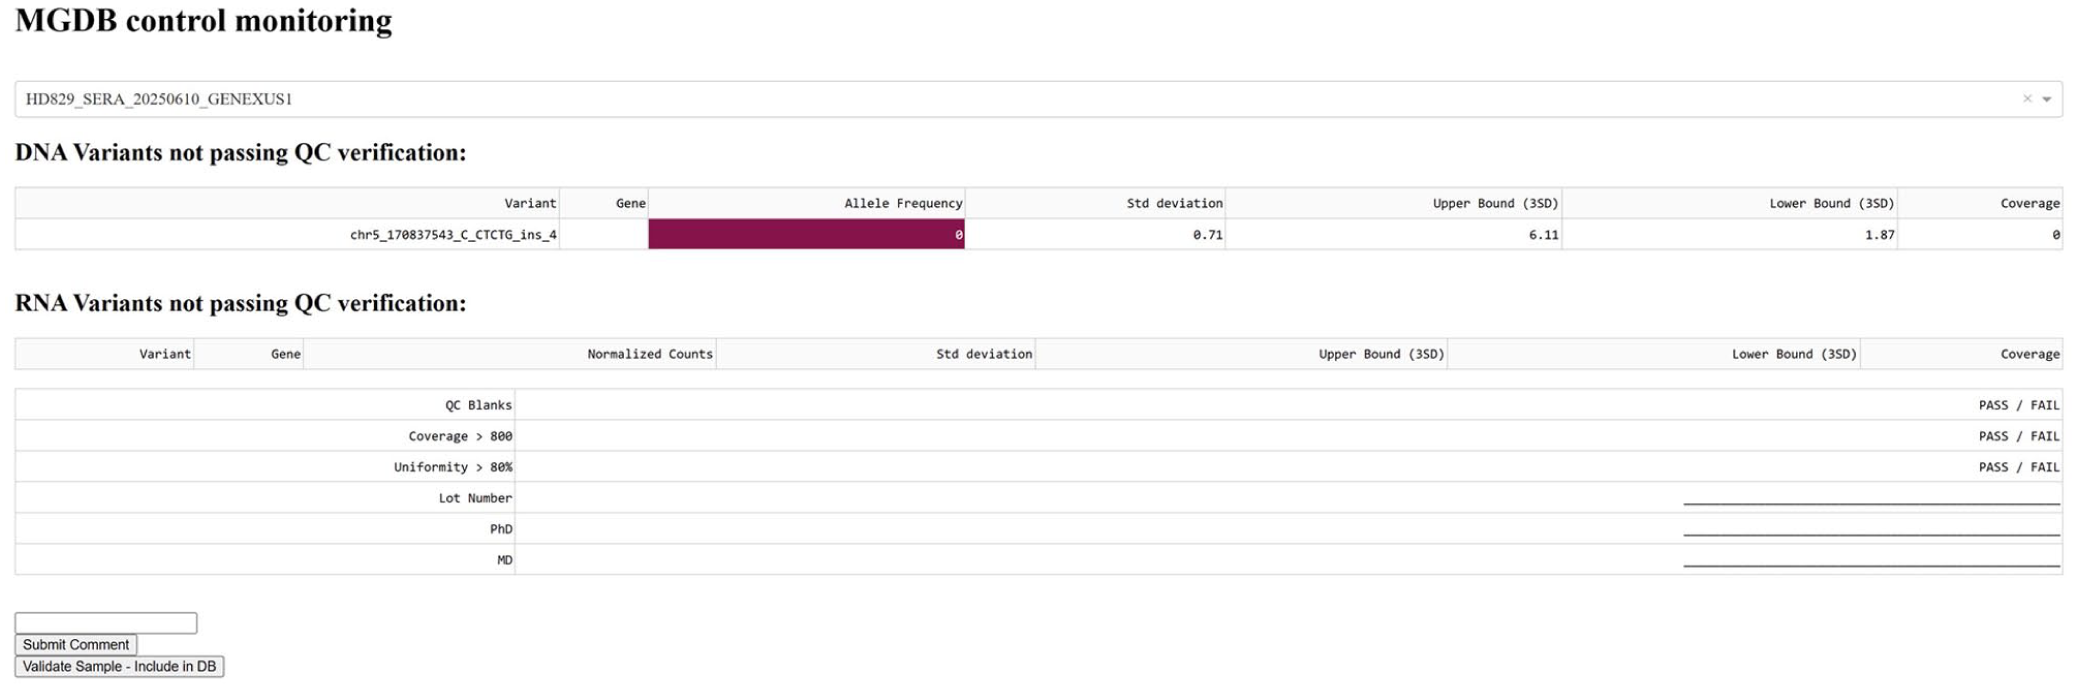
Overview of the dashboard structure and features. Conditional formatting in dark red highlights problematic variants with out-of-bound allele frequencies in a run chosen from a dropdown menu (top). Signature fields, comment sections and manual validation functions are shown.
To ensure the portability and reproducibility of this tool, we used Docker 20 to containerize the web application and MySQL database. Docker encapsulates the application and its dependencies in an isolated container, enabling it to run consistently on any machine with Docker installed, without worrying about dependency conflicts or differences in operating system configuration.
In addition, we used Docker Compose 21 to define and manage the application’s multi-container services, including the Dash application, MySQL database and API service to automate tasks. Docker Compose uses a YAML file to configure application services, their dependencies and shared networks, simplifying the process of deploying and scaling the application. This container-based approach ensures consistent environment configuration across development, test and production environments, improving project reliability and reproducibility.
Results
To examine the time required to load the app in browser, we compared the load times of 3 separate databases with differing numbers of runs. Using data from our most comprehensive panel (OCA+, 191 variants and fusions), we populated the database with variant information from this assay. Performance was assessed by then timing the delay to display data on-page after the initial call to display the app. Redis caching reduces the load times for pre-loaded samples or any new SQL queries. Baseline measurements of speed were taken for a 9 samples group with a 20-variant panel, which showed an average speed of 150 ms for displaying data from a new case. Despite having a slightly slower cache load time, this speed remained relatively constant (121 ms) even for a much larger sample of 128 cases with 191 variants each. This demonstrates the scalability of the software, with steady performance despite testing with 14 times more samples and 9 times more variants. Monitoring of positive controls by molecular diagnostics laboratory scientists using HGDB during the testing period led to the rapid detection of failed library batches either due to technician error or automation instrument failure. Although these issues affected <5% of runs, they were visualized as dropouts (0 allele-frequency) on HGDB and addressed promptly (Table 1).
Performance Evaluation Data Characteristics and Results.

Discussion
MGDB is an easy-to-implement dashboard for variant-level run-to-run tracking of internal standards in molecular diagnostics labs. It is built on a Python and MySQL framework and can offer an improved experience for labs that wish to track QC metrics in detail, especially for laboratories that do not have tailor-made proprietary software for such tasks. This is a clear improvement over using tabular spreadsheets, or even paper records that can be prone to error and require physical storage. Despite these advantages, there are some drawbacks. As an example, we have tested MGDB’s speed with up to 128 samples and shown that load times remain constant after initial cache loading, therefore performance should not be substantially impacted when scaling up. Although caching does help with software speed after initial load, we have only tested MGDB with targeted sequencing and we anticipate that performance issues may arise when used with whole-genome scale rather than multiplex panels. We therefore do not recommend using MGDB for whole-genome sequencing in it’s current version. Individual labs may set their own internal protocols for how to manage outliers and non-conformity. Such policy may not be straightforward, especially with multiplex assays. At our center, we chose to only accept runs where <10% of variants in the positive control samples had AF or NC values outside the 3SD limit. In borderline cases, clinical samples were analyzed with caution and a note was made to closely monitor the problematic variants over the next several runs. Otherwise, standards where most variant AFs were outside reference ranges were labeled as failed, which resulted in the rejection of the entire library and opening of a non-conformity ticket. While these represented <5% of runs, HGDB allowed for accelerated detection of issues and planning of subsequent interventions.
It should also be noted that this is a simple tool showing that variant-level runto-run monitoring can be easily implemented from vcf files created in clinical settings. We have therefore successfully implemented this monitoring routine at our institution using the technologies and APIs available, however in principle this could be easily adapted for other platforms. Other hospital-based molecular genetics labs may therefore benefit from implementing MGDB. It is also worth noting that the intended end-users for this tool are laboratory scientists or technologists who interpret somatic variation data in molecular oncology rather than physicians or other hospital staff, since some command-line familiarity is required to install these tools. We have included a “Add2VarDB Ilmna.py” file that can insert vcf data generated through Illumina technology and DRAGEN software into our existing MySQL schema. However, some modifications to API scripts would be required for automated retrieval of Illumina-generated files from remote storage. Also, we recommend that this not be used as the sole recordkeeping method for molecular genetics labs. A signature page at the top of the dashboard that can be printed for convenience was included, however keeping off-site backups of any important files is always good practice. Ultimately, MGDB can improve the efficiency of quality assurance and interpretation of clinical sequencing results.
Conclusion
MGDB offers a robust and user-friendly solution for enhancing quality control in clinical NGS workflows, contributing to greater accuracy and reliability in variant detection. The tool provides variant-level monitoring capabilities that go beyond traditional high-level QC metrics, enabling more precise evaluation of NGS test consistency between runs. This granular approach allows for the identification of potential issues that may not be apparent with classical quality control measures, making it particularly valuable for clinical laboratories seeking to improve their quality assurance processes.
Supplemental Material
sj-pdf-1-cix-10.1177_11769351251411074 – Supplemental material for MGDB: A Novel Bioinformatics Quality Control Tool for Clinical Next-Generation Sequencing
Supplemental material, sj-pdf-1-cix-10.1177_11769351251411074 for MGDB: A Novel Bioinformatics Quality Control Tool for Clinical Next-Generation Sequencing by Hadrien T. Gayap, Philippe-Pierre Robichaud, Nicolas Crapoulet and Eric P. Allain in Cancer Informatics
Footnotes
Acknowledgements
The authors thank the molecular genetics staff at the Dr Georges-L.-Dumont University Hospital Centre for their collaboration and feedback during the development and testing of MGDB. They would also thank Jessica Darmendre and Chloe Williams for testing the installation and running of MGDB.
Author Contributions
HTG and EPA wrote the manuscript. P-PR and NC reviewed and tested the software. EPA designed the bioinformatics tools, all authors reviewed the manuscript.
Funding
The authors disclosed receipt of the following financial support for the research, authorship and/or publication of this article: E.P.A. is supported by Research New Brunswick, the Atlantic Cancer Research Institute and the Beatrice Hunter Cancer Research Institute. H.T.G. was partly supported by Research New Brunswick’s Research Assistantships Initiative fund.
Declaration of Conflicting Interests
The authors declared no potential conflicts of interest with respect to the research, authorship and/or publication of this article.
Data Availability Statement
Supplemental Material
Supplemental material for this article is available online.
References
Supplementary Material
Please find the following supplemental material available below.
For Open Access articles published under a Creative Commons License, all supplemental material carries the same license as the article it is associated with.
For non-Open Access articles published, all supplemental material carries a non-exclusive license, and permission requests for re-use of supplemental material or any part of supplemental material shall be sent directly to the copyright owner as specified in the copyright notice associated with the article.