
Abstract
Objectives:
Cancer stratification is essential for accurate prognosis and personalized treatment selection. While many existing approaches integrate multiple omics data types to identify cancer subtypes, it remains unclear how clustering results from individual omics layers compare in their ability to capture survival-related patient clusters. This study aims to examine patient clusters separately defined by different omics data types and to explore the consistency of these clusters as well as their associations with survival outcomes.
Methods:
In this study, we conducted clustering analysis on miRNA expression, gene expression, and DNA methylation data across 20 cancer types in TCGA. We employed a standard clustering pipeline similar to the widely used Seurat clustering pipeline in scRNA-seq analysis. We performed survival analysis to assess whether the resulting patient clusters exhibit significantly different survival outcomes.
Results:
We observed significant survival differences among patient clusters in 11 cancer types. Notably, in 6 of these 11 cancer types, the survival differences among patient clusters were significant in multiple omics data types. For each of these 6 cancer types, we compared the consistency of patient clusters across different omics data types. Interestingly, in each cancer type, we noticed one set of patients who consistently clustered together irrespective of the omics data type, and these patients exhibited either the most favorable or the most unfavorable survival outcomes. This observation suggested that those patients with the most prominent survival outcomes show distinct expression patterns in multiple genomics aspects and could be captured by clustering analysis in multiple omics data types. To interpret these findings, we identified differentially expressed molecular features. Using established miRNA-target relationships, gene-gene interactions, as well as gene-CpG relationships, we constructed networks specific to each cancer type based on the differentially expressed features. These networks revealed several molecular modules associated with patient survival outcomes, such as the miR-200c-3p/ZEB2 axis in bladder cancer, the regulatory role of miR-98 in breast cancer, as well as the association of miR-21 with target genes APC in kidney renal cell carcinoma.
Conclusion:
These findings suggest that omics-specific clustering can identify robust survival-related patient clusters and uncover molecular features that may contribute to differential survival outcomes.
Introduction
Cancer is a complex and diverse disease that can develop in various tissues and cell types. Even within a single type of cancer, multiple subtypes may be present, each characterized by distinct molecular profiles, histology, and genetic mutations, leading to varied clinical outcomes and treatment responses. Therefore, significant efforts have been directed toward identifying phenotypic variations as distinct cancer subtypes through molecular characterizations, aiming to categorize patients into distinct groups that exhibit similar clinical phenotypes, prognoses, and responses to treatments.1,2 Such classification is intended to facilitate the provision of precise clinical management and customized treatment for each specific subtype, ultimately improving the overall efficacy of cancer therapies.3,4
Clustering analysis is a fundamental computational method widely used to group patients into different clusters based on their similarity in genomic data. Patients within the same cluster may exhibit similar clinical outcomes or treatment responses, while those in different clusters may show greater dissimilarities. Several clustering methods, such as Cluster of Clusters (CoC), 5 consensus clustering (CC), 6 and consensus non-negative matrix factorization (CNMF), 7 have been frequently applied in cancer subtype discovery and have demonstrated success in multiple cancer contexts using different omics data types.8 -10 Typically, in the analysis of multi-omics data for cancer subtyping, these approaches typically aim to generate a single clustering solution that is supported by all data types, either by integrating multiple omics layers into one joint analysis or by aggregating clustering results across them.11 -13 However, this integration can sometimes obscure omics-specific contributions to patient stratification. In this study, we propose a complementary strategy. Instead of finding one unified cluster result supported by multiple individual omics data types, we examine the patient clusters separately defined by individual omics data type. Our goal is to examine whether independently derived clusters from different omics data types are consistent with each other and associated with survival outcomes. This approach highlights recurring survival patterns that emerge across multiple omics layers, while also allowing us to detect omics-specific signals that may be masked in fully integrative analyses. By shifting the focus from a single integrated partition to consistency across data types, our framework provides a distinct perspective on multi-omics clustering.
This workflow of this analysis is shown in Figure 1, we downloaded multiple omics data types, including miRNA expression, gene expression, and DNA methylation profiles, for all cancer patients available in The Cancer Genome Atlas (TCGA). 14 We used the Seurat clustering pipeline to define patient clusters based on each omics data types separately. Seurat is an R package developed for scRNA-seq analysis, and offers a comprehensive suite of tools for data preprocessing, normalization, clustering, and visualization. 15 Although primarily tailored for scRNA-seq, Seurat can be adapted for bulk RNA-seq data. For each cancer type and each omics data type, we used Seurat clustering pipeline to cluster the patients. We examined the similarities among patient clusters defined by different omics data types, and conducted survival analyses on the resulting patient clusters to assess their differences in survival outcomes. Interestingly, our analysis revealed groups of patients consistently captured by clusters from different omics data types, and such patients consistently exhibited either the most favorable or the most unfavorable survival outcomes. Additionally, to understand the molecular mechanisms associated with these patients, we examined differentially expressed molecular features and their interactions.

Overview of the analysis workflow in this study. The steps include the collection of three omics data types (miRNA expression, gene expression, and DNA methylation) from TCGA, followed by clustering analysis for each omics type. Subsequent analyses involve survival analysis of patient clusters and cross-omics cluster comparison to identify patients with consistent survival outcomes across multiple omics data for each cancer type. Finally, differential expression analysis and network analysis are performed on the identified patient groups to discover molecular modules associated with survival outcomes.
Results
Clustering Analysis of Individual Omics Data Types for Each Cancer Type
In the literature, several cancer types have been divided into clinically meaningful subtypes based on the molecular profiles. For example, previous studies have recognized five molecular subtypes of breast cancer based on the gene expression patterns, and validated the robustness of such classification in various clinical studies of breast cancer.16,17 Similarly, skin cutaneous melanomas has been classified into four genomic subtypes based on the mutation patterns of frequently mutated genes. 18 Moreover, De Cecco et al conducted a comprehensive meta-analysis to identify six distinct molecular subtypes of head and neck squamous cell carcinoma, each associated with distinct survival outcomes. 19 These examples highlight the proven effectiveness of using molecular profiling to identify significant cancer subtypes, supporting the validity of using omics-specific clustering to uncover meaningful subtypes.
We performed clustering analyses separately on miRNA expression data, gene expression data and CpG methylation data of each cancer type from TCGA. We selected cancer types with at least 100 patients whose miRNA expression, gene expression and DNA methylation data were available. Overall, 20 cancer types were included in this study, involving a total of 5453 cancer patients. In terms of omics features, our analysis included 1,881 miRNAs, 60 498 genes and 485 577 CpG sites. For each cancer type and each omics data type, the Seurat clustering pipeline was applied to cluster the patients with that cancer into several clusters. It is important to note that patient clusters may differ depending on the omics data type which was used for clustering. Table 1 shows the number of patient clusters identified by each omics data type for each cancer type.
Number of Patient Clusters Produced by Different Omics Data Types for Each Cancer Type.

Significant Survival Differences Were Observed Among Patient Clusters Defined by Multiple Omics Data Types in Various Cancers
To examine the clinical relevance of the patient clusters produced by each omics data type, we applied the log-rank test to assess the survival differences among the corresponding patient clusters. The p-values of the log-rank tests were summarized in Figure 2. If the patient clusters exhibited distinct survival outcomes with the log-rank test yielding a P-value of less than 0.05, we considered the clustering result of the omics data type of the cancer type to be survival related. In total, significant survival differences among patient clusters were observed in at least one omics data type in 11 cancers.

Log-rank analysis of patient clusters across 20 cancer types in TCGA. Summary of log-rank analysis to assess survival differences among patient clusters defined by different omics data types for each cancer type. Colors indicate statistical significance, highlighting clinically relevant clusters.
Furthermore, for some of the cancer types, we observed significant survival differences among patient clusters in more than one omics data type. Such observation was present in six cancer types, including Bladder Urothelial Carcinoma (BLCA), Breast Invasive Carcinoma (BRCA), Head and Neck Squamous Cell Carcinoma (HNSC), Kidney Renal Clear Cell Carcinoma (KIRC), Kidney Renal Papillary Cell Carcinoma (KIRP), and Lower Grade Glioma (LGG). Notably, within the contexts of BRCA, KIRC, and LGG, we observed significant survival differences among patient clusters derived from all three omics data types.
Patient Clusters With the Most Prominent Survival Outcomes Showed a High Degree of Consistency Across Omics Data Types
For each of the six cancer types where at least two omics data type produced patient clusters that exhibited significant survival differences, we further generated Kaplan-Meier (KM) plots to visualize the survival outcomes of those patient clusters.
In Figure 3, the rows corresponded to the 6 cancer types, and the columns corresponded to the 3 omics data types. Each panel shows the KM curves of patient clusters in 1 cancer type defined by unsupervised Seurat clustering based on a specific omics data type within a given cancer type.

Kaplan-Meier survival curves depicting the survival outcomes of patient clusters derived from miRNA, gene expression, and DNA methylation data for each of the 6 cancer types where significant survival differences were observed in multiple omics. The rows represent different cancer types, and the columns represent different omics data types.
In the KM plots for BLCA (first row in Figure 3), the P-values indicated that significant survival differences were observed in patient clustering analyses of both miRNA and gene expression data. Interestingly, the KM curves for the most favorable patient cluster in miRNA analysis (ie, labeled as “miRNA_3”) and the most favorable patient cluster in gene expression analysis (ie, labeled as “gene_2”) appeared to be similar, which was an indication that the “miRNA_3” patient cluster and the “gene_2” patient cluster were likely composed of a highly overlapping set of bladder cancer patients. Indeed, the “miRNA_3” cluster contained 66 patients, the “gene_2” cluster contained 74 patients, and the overlap between these 2 clusters is 56. Such overlap can be quantified by the Jaccard Index (ie, the ratio of intersection over union), which ranges from 0 to 1. The overlap between patient clusters “miRNA_3” and “gene_2” produced a high Jaccard index of 0.67. A previous study classified BLCA into 5 expression subtypes: luminal-papillary, luminal-infiltrated, luminal, basal-squamous, and neuronal, where luminal-papillary accounted for 33.2% of BLCA patients and exhibited best survival outcomes among the 5 subtypes. 20 Notably, all 56 overlapping patients identified in our analysis belonged to the luminal-papillary subtype. This strong representation of the luminal-papillary subtype aligns with our observations.
The KM plots for BRCA (second row of Figure 3) showed a similar observation that the KM curve for the least favorable patient cluster appeared to be similar across all 3 omics data types. These least favorable patient clusters were labeled as “miRNA_4” (33 patients), “gene_5” (31 patients), and “methyl_5” (32 patients). The intersection among these three patient clusters was 28, and the pairwise Jaccard index among these 3 clusters were 0.88, 0.76, and 0.8. Therefore, these three breast cancer patient clusters defined essentially the same set of patients. While comparing this overlap with the well-established PAM50 intrinsic breast cancer subtypes 21 did not reveal significant correlations, the strong consistency across the 3 clusters suggests that this overlap may still warrant further investigation.
The fourth row of Figure 3 showed the KM plots for KIRC. Survival outcome of the least favorable patient clusters in the three data types appeared to be similar. These clusters were labeled as “miRNA_1” (97 patients), “gene_0” (101 patients), and “methyl_1” (76 patients). The intersection among these 3 patient clusters was 54. The pairwise Jaccard index among these 3 clusters were 0.55, 0.49 and 0.62. A previous study of renal cell carcinoma has identified a subtype that has 9.9% prevalence and has significantly poor survival outcomes. 22 Among the 54 consistently clustered patients in our analysis, 42.5% belonged to this previously established poor survival subtype, which presents significant enrichment that aligns with our observations.
The last row of Figure 3 showed the KM plots for LGG. The least favorable patient clusters in the three data types showed similar survival outcome. These clusters were labeled as “miRNA_3” (47 patients), “gene_3” (63 patients), and “methyl_4” (80 patients). The intersection among these three patient clusters was 42. The pairwise Jaccard index among these three clusters were 0.62, 0.53 and 0.70. Previous research on diffuse glioma has identified 7 glioma subtypes, with the mesenchymal-like and classic-like subtypes being specifically linked to poor prognosis. 23 In our analysis, 57.1% of the 42 overlapping patients were of the mesenchymal-like subtype, and 26.1% were of the classic-like subtype. In comparison, only 8.5% of the broader LGG cohort had the mesenchymal-like subtype, and 4.3% had the classic-like subtype. This notable enrichment of poor-survival subtypes among overlapping patients reinforces the relevance of our observations. Although the overlap and Jaccard index were not as high compared to the cases of BLCA and BRCA, the overlap among these patient clusters did lead to visually appreciable similarity in the survival outcomes visualized by KM curves.
Collectively, these observations showed that in each of these 4 cancer types, there existed a set of patients that consistently clustered together in different omics data types, and these patients tended to exhibit either the most favorable or least favorable survival outcomes. We conjecture that the sets of patients with the most prominent survival outcomes likely showed distinct expression patterns in multiple genomics aspects, which enabled the clustering analysis to consistently capture them using different omics data types.
Differentially Expressed Features Associated With the Most Prominent Survival Outcomes
We further focused on BLCA, BRCA, KIRC and LGG, the 4 cancer types where we observed that different omics data type led to consistently clustered patients with prominent survival outcomes. To explore the biological differences between these consistently clustered patients and the rest of the patients in the same cancer type, we performed differential expression (DE) analyzes to identify miRNAs, genes, and CpG sites that showed significant differential expression. Specifically, for each cancer type and each omics data type, we applied t-tests to examine the molecular features. The resulting p-values were converted to false discovery rates (FDR), and an FDR threshold of 0.05 was used to identify significant DE features. Table 2 listed the number of DE features identified for each omics data type in each cancer type.
The Number of DE Features Identified in Each of the 4 Cancer Types.

We performed functional enrichment analysis to examine the biological roles of the DE genes. Gene Ontology (GO) enrichment analysis was conducted by using R package “clusterProfiler,” 24 searching against the entire Homo sapiens genome. We adopted a P-value threshold of <.05 to identify the top enriched biological processes shown in Figure 4. This analysis revealed that the DE genes identified in these four cancer types were significantly enriched in several key biological processes, including cell development and immune response, which are critical for cancer development and progression. Moreover, a literature survey was conducted to examine the functional relevance of identified DE miRNAs for each cancer type. This survey yielded considerable evidence supporting the associations between the DE miRNAs and cancer survival outcomes. For example, in our analysis, we observed that the expression level of let-7 was associated with favorable survival outcomes in BLCA. Several studies have also highlighted the important role of let-7 as a cancer biomarker, and shown that decreased let-7 expression correlated with high-grade tumors and poor prognosis, while high let-7 levels are associated with better prognosis and prolonged patient survival.25 -28 Another example is miR-155. Iorio et al showed that miR-155 is significantly up-regulated in human breast cancer compared with normal breast tissue, aligning with our observation that miR-155 is highly expressed in patient clusters with unfavorable survival outcomes in BRCA. 29 Additionally, it has been discovered that high miR-21 expression is linked to poor survival outcome in squamous cell lung carcinoma and low-grade gliomas.15,30 Our analysis also revealed that the expression of miR-21 is correlated with unfavorable outcomes in LGG. These findings from the literature, which reported on the relationships between DE miRNAs and cancers, aligned well with our observations, providing support for our results in linking the DE miRNAs to cancer survival outcomes.

Gene ontology (GO) enrichment analysis results for differentially expressed genes in BLCA, BRCA, KIRC, and LGG. The enriched biological processes are shown for each cancer type, with color intensity representing the significance level of enrichment. The analysis reveals key biological processes linked to cancer development and progression, underlining the molecular characteristics associated with different patient clusters.
Network Analyses Identified Molecular Modules Associated With Patient Survival Outcomes in Cancers
To investigate the underlying biological mechanisms associated with the consistently clustered patients with prominent survival outcomes, we collected and integrated relevant data from several sources, including miRNA-target gene relationships in the mir2Disease, 31 miRecords, 32 TarBase 33 and miRTarBase 34 databases, as well as protein-protein interaction data from the STRING database. 35 Additionally, we established the relationship between CpGs and genes based on the genomic locations of CpG sites relative to genes. We constructed one miRNA-gene-CpG network for each cancer type, using the identified DE features in the cancer type as nodes and the relationships among miRNAs, genes and CpG sites in those databases as edges. The miRNA-gene-CpG networks were visualized using Cytoscape 3.9.1. 36 We further employed the Cytoscape plug-in MCODE 37 to identify densely interconnected network modules, which may indicate molecular complexes relevant to the prominent survival outcomes of the consistently clustered patients. Figure 5 shows the identified network modules of DE features in each of the four cancer types.
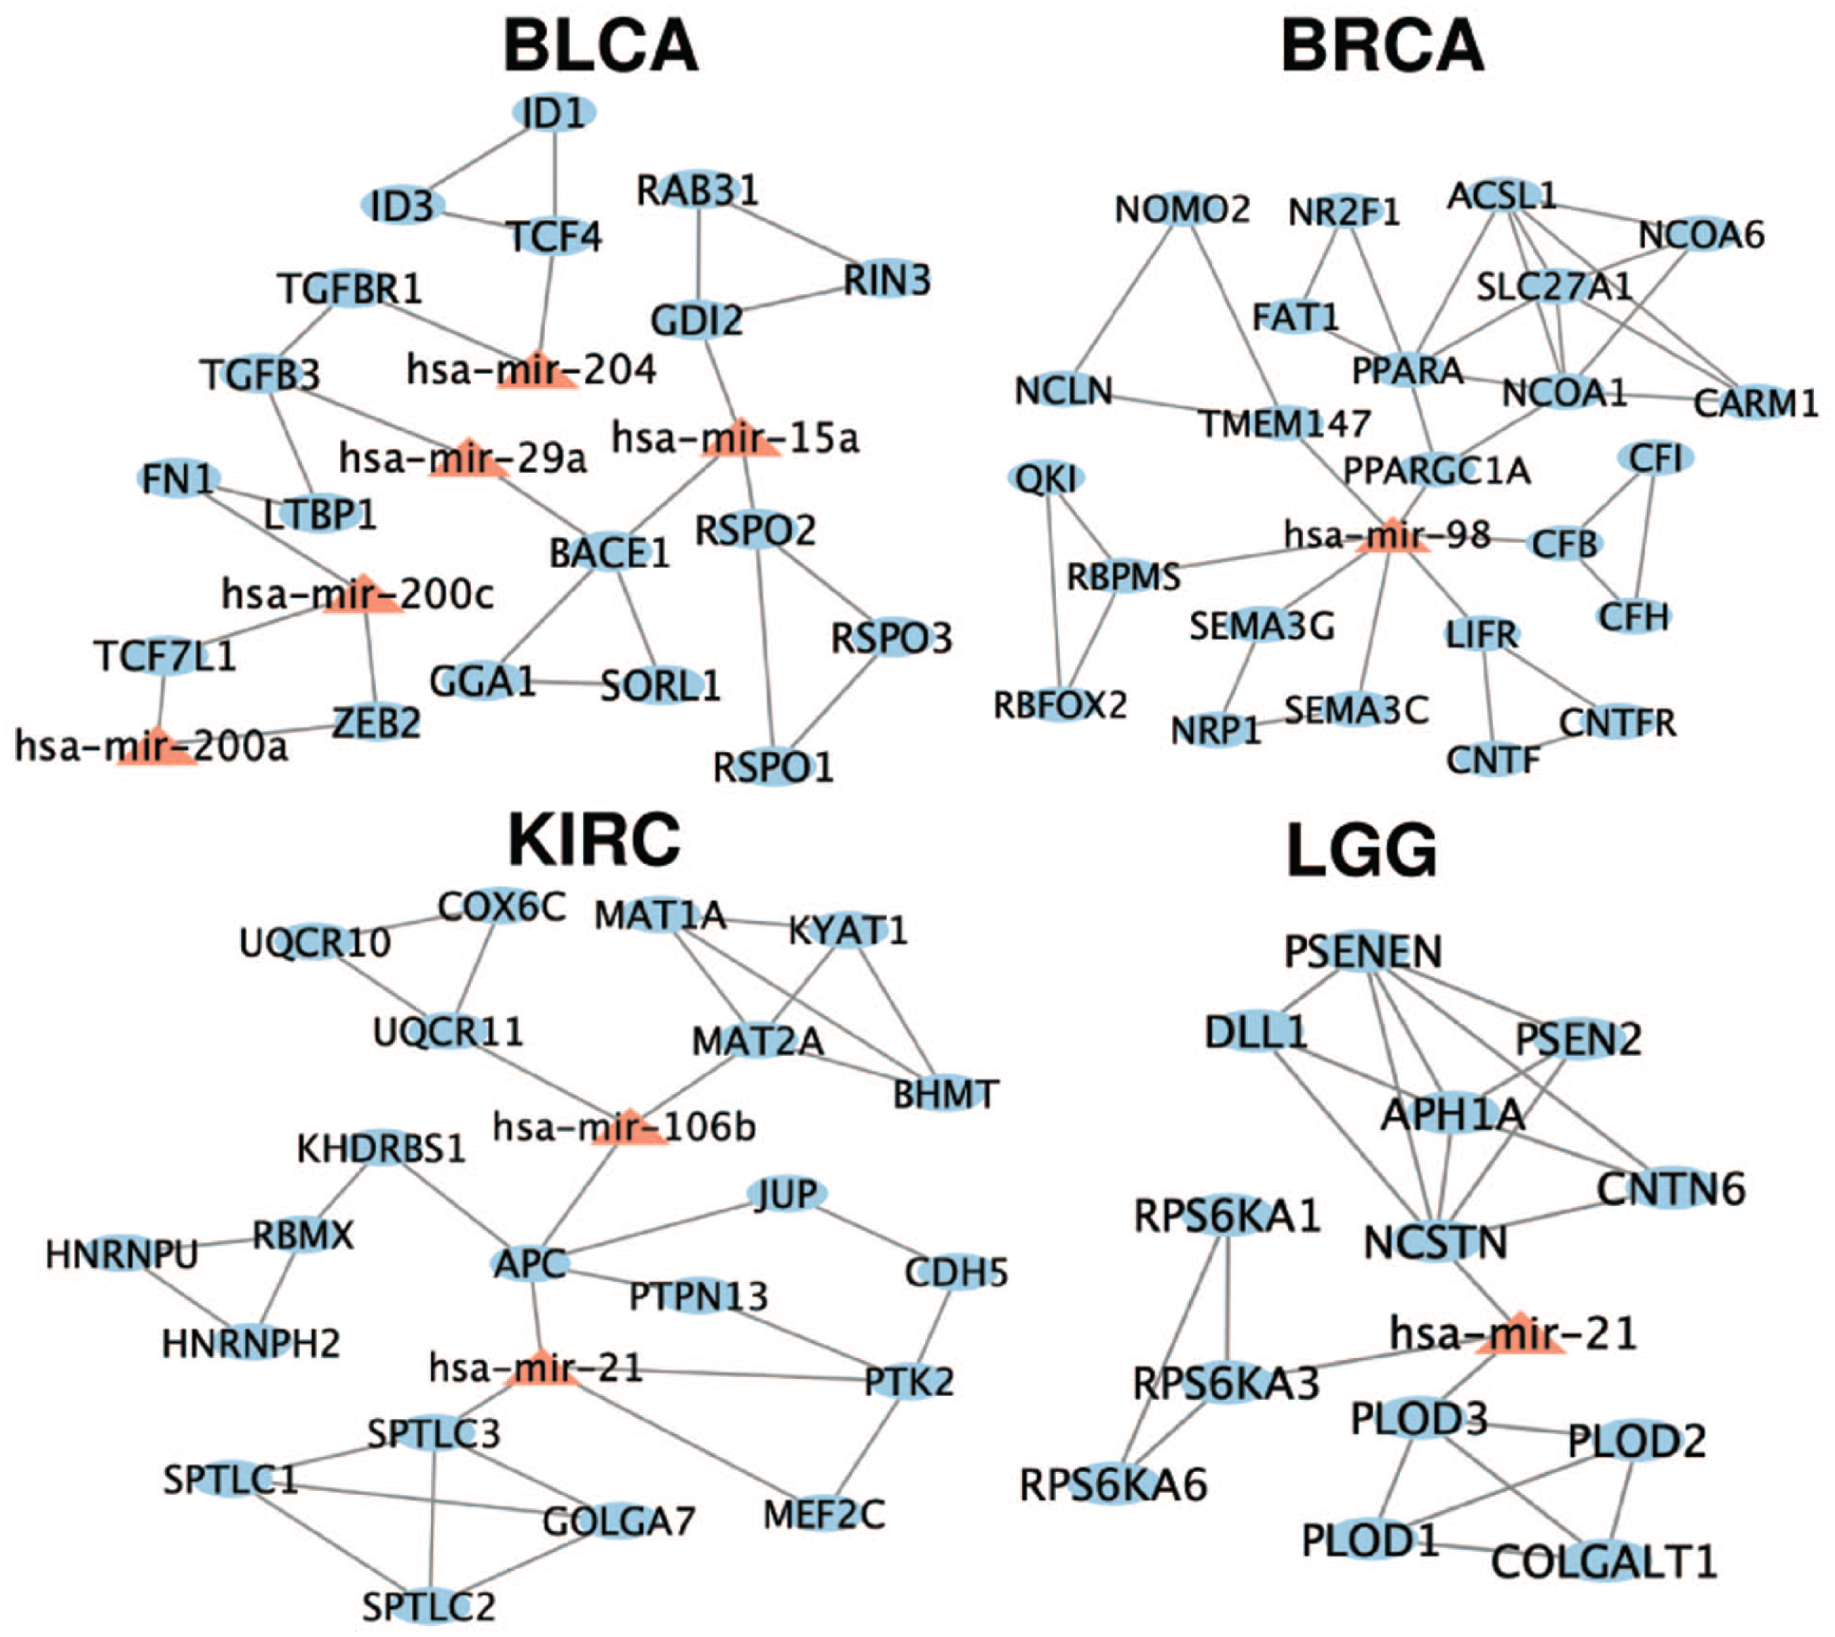
Densely connected network modules of DE features associated with consistently clustered patients in BLCA, BRCA, KIRC, and LGG. Nodes are color-coded to represent the type of feature, and edges indicate known interactions among the DE features based on miRNA-gene and gene-gene relationships. These network modules suggest potential molecular interactions that may influence patient survival outcomes.
In our network analysis of BLCA, we observed the association between miR-200c and its target gene ZEB2 in BLCA. This finding is supported by a previous study examining the tumor suppressor role of miR-200c-3p in prostate carcinoma, which suggested that targeting the miR-200c-3p/ZEB2 axis could be a promising design strategy for the treatment of prostate carcinoma. 38 In addition, we found that miR-98 emerged as a pivotal element, connecting target genes within the BRCA module. This is particularly notable as miR-98 is known to promote apoptosis in breast cancer cells.39,40 Previous studies have revealed the potential of miR-98 to affect the immune system in endometrial epithelial cells by down-regulating its target gene CFB. 41 Besides CFB, several target genes of miR-98 in the network, such as PPARGC1A, SEMA3C, and NRP1, have been implicated in key processes like metabolism, immune response, cell migration, and angiogenesis, all of which are critical in cancer progression.42 -44 These results suggest that miR-98 might play a crucial role in breast cancer. Moreover, we identified the regulation between miR-21 and APC gene in the network analysis of KIRC. In the literature, it has been reported that down-regulation of the APC gene in CRC correlated with up-regulation of miR-21, and patients with APC mutation and high miR-21 expression had poor overall survival rates in colorectal cancer. 15 Overall, our analysis underscores the relationships among DE features identified from the consistently clustered patients with prominent survival outcomes. These DE features and their associations, extensively documented in the literature, offer valuable biological insights into the factors correlated with prominent survival outcomes in cancer patients. It is worth noting that the DE CpG features were absent in the densely interconnected network modules for all 4 cancer types. This absence is likely because the miRNA-gene-CpG networks were constructed using several databases that describe miRNA-gene relationships and gene-gene relationships, while the CpGs were connected to genes only based on genomic location. Therefore, our miRNA-gene-CpG networks contained more connections among miRNAs and genes, which biased the densely connected modules.
Discussion
In this study, we explored cancer subtyping through multi-omics data types by conducting clustering analyses on miRNA expression, gene expression, and DNA methylation data of 20 cancer types in TCGA. In 11 cancer types, we observed significant survival differences among patient clusters derived in at least one omics data type. In 6 of the 11 cancer types, significant survival differences among patient clusters were observed in more than one omics data type. We examined the survival outcome of the patient clusters derived from different omics data types. Interestingly, in 4 of the 6 cancer types, we noticed one set of patients who consistently clustered together irrespective of the omics data type, and these patients exhibited either the most favorable or the most unfavorable survival outcomes. This finding suggests that patients with the most prominent survival outcomes may display distinct expression patterns across multiple genomic dimensions, which can be detected by clustering analyses in different omics data types. While several cancer types showed consistent, survival-associated patient clusters, not all demonstrated clear patterns. In some cases, the survival associations were less distinct, possibly due to varying molecular heterogeneity. These variable outcomes highlight the complexity of linking molecular profiles to prognosis. Furthermore, we identified miRNAs, genes, and CpGs associated with these patient clusters in each cancer type. Based on the relationships among the differentially expressed molecular features, we constructed networks to illustrate the biological mechanisms that may be associated with the prominent survival outcomes of these patient clusters. As a result, several molecular features identified in our analyses align with previously described cancer-related mechanisms. For example, miR-200c and ZEB2 are involved in BLCA, and miR-21 is known to regulate tumor suppressors like APC. While these associations are supported by prior studies, our findings provide a data-driven link between these molecular features and survival-related patient subgroups.
To compare our omics-specific clustering approach with integrative clustering analysis methods, we applied three widely used tools—NMF, 45 SNF, 46 MOFA2 47 and MDICC 48 —that integrate data from multiple omics layers to identify unified patient clusters. Our analysis identified groups of patients, referred to as consensus patients, who consistently clustered together across different data types and showed a strong correlation with the most prominent survival outcomes in four cancer types (BLCA, BRCA, KIRC, and LGG. For comparison, we applied each of the integrative clustering tools to these four cancer types. For each cancer type, we identified patient clusters using these tools and assessed their survival differences through Kaplan-Meier survival analysis and log-rank tests. The Kaplan-Meier curves (Supplemental Figure S1) show that, in most cases, the integrative tools successfully stratified patients into groups with significantly distinct survival outcomes, as indicated by log-rank P-values. These results demonstrate that integrative clustering methods effectively capture survival differences by combining information across data types.
To further compare these strategies, we quantified the agreement between patient clusters with prominent survival outcomes identified by NMF, SNF, and MOFA2, and the consensus patients from our original analysis. To enable direct comparison with our binary consensus groups (in vs out), we recoded the outputs of integrative methods into binary labels by designating the survival-associated cluster (either the most favorable or the most unfavorable) as “1” and assigning all other patients to “0.” We then used the Adjusted Rand Index (ARI) to evaluate concordance. As shown in Table 3, for BLCA, 56 consensus patients were identified from overlapping clusters in miRNA and gene expression data linked to favorable survival outcomes. The ARI values were 0.818 for NMF and 0.895 for SNF, indicating that both methods identified favorable survival clusters highly consistent with our consensus group, whereas MOFA2 and MDICC failed to detect survival differences. For BRCA, only SNF and MDICC identified patient clusters that differed in survival, and both showed nearly perfect concordance with our consensus patients (ARI = 1.0 and 0.968, respectively), whereas NMF and MOFA2 did not identify survival differences among their patient clusters. In KIRC, NMF, SNF, and MOFA2 produced clusters associated with unfavorable survival that aligned well with our consensus patients, with ARI values ranging from 0.851 to 0.967. Similarly, in LGG, SNF and MOFA2 achieved perfect concordance with the consensus group (ARI = 1), and MDICC was also highly consistent (ARI = 0.983), whereas NMF showed little agreement.
ARI Between Consensus Patients and Clusters Identified by NMF, SNF, MOFA2 and MDICC.

Abbreviation: N/A, no survival differences detected.
While integrative multi-omics clustering tools effectively combine information from multiple omics layers to identify patient clusters with prominent survival outcomes, our approach offers a complementary perspective by analyzing each omics layer independently and assessing the consistency of patient clusters across layers. This design allows us to detect omics-specific contributions to patient stratification that are often masked in fully integrative analyses. For example, in BLCA, our analysis revealed overlapping clusters in miRNA and gene expression data, suggesting that these layers play a key role in driving clustering patterns linked to favorable survival outcomes. Integrative clustering tools, while powerful, provide a unified clustering result that does not explicitly reveal the individual contributions of each omics layer to the clustering process or survival patterns. By focusing on omics-specific analyses, we can explore layer-specific molecular features and better understand the biological mechanisms underlying these patterns. In summary, both clustering strategies effectively identify survival-associated clusters and provide complementary insights into patient stratification.
However, this study is not without its limitations. One of the limitations is the parameter tuning for Seurat clustering. The Seurat clustering process involves several components, including data filtering and normalization, identification of highly variable features and principal components, as well as construction of shared neighborhood graphs and patient clusters. Each component contains user-defined parameters that may affect the clustering results. 49 In our analysis, to ensure uniformity in comparing clustering analyses across various data types and cancer types, we adhered to the default parameter settings in Seurat. Although the default parameter settings in Seurat may not be optimal, they have been proven useful in many scRNA-seq analyses. In addition, it was encouraging that the default parameter enabled our clustering analyses to stratifying cancer patients into clusters with distinct survival outcomes, suggesting that these parameters are generally well-suited for our analysis. Another limitation of this study was the lack of independent validation datasets. Our analysis in BLCA, BRCA, KIRC and LGG showed that there exist a set of cancer patients with prominent survival outcomes that were consistently clustered across different data types. It would be ideal to validate these findings in an independent dataset. However, such an independent validation requires a multi-omics cancer dataset with miRNA expression, gene expression and DNA methylation data, as well as survival outcome data, for at least one of the four cancer types. However, we were unable to find such a validation dataset. Therefore, our ability to perform independent validation was limited by data availability. We view the development and public release of such datasets as a key priority for future multi-omics research and validation studies. Despite these limitations, it was striking to observe the prominent survival outcomes of the consistently clustered patients in multiple cancer types, and the molecular features associated to these consistently clustered patients pointed to targets and pathways with literature support. Future research could aim to include additional omics data types, such as proteomics and metabolomics, to provide a more comprehensive understanding of cancer biology and cancer subtyping. In addition, we plan to develop a publicly accessible web platform to enable interactive exploration of the patient clustering results, survival analyses, and molecular feature associations identified in this study. Such a resource could support clinical and research users in examining cancer subtype patterns across multiple omics layers.
Methods
Data Acquisition and Preprocessing
miRNA, gene expression, CpG methylation expression, and survival data were downloaded from TCGA Genomic Data Commons (GDC) using the GDC Data Transfer Tool. Our analyses included 1881 miRNAs, 60 498 genes and 485 577 CpG sites. To ensure adequate sample size for downstream clustering and survival analyses, we included only cancer types with at least 100 patients for whom matched miRNA expression, gene expression, and DNA methylation data were available. In total, there were 5453 patients across the 20 cancer types used for clustering analyses in this study.
Clustering Analysis
Clustering analysis was performed by using the “Seurat” R package on each omics data type in each cancer type. The Seurat pipeline included identifying highly variable features, computing principle components, and constructing a shared neighborhood graph, and clustering by finding densely connected communities in the graph. We used the default parameters in the Seurat pipeline, except for the ones that related to the identification of highly variable features. Specifically, we selected 3000 top variable features for the analysis of gene expression and methylation data. For the miRNA data, we used all available features as highly variable features, given the limited number of miRNA features.
Survival Analysis
For each cancer type and each omics data type, we performed survival analysis among the patient clusters to evaluate survival outcome differences among these clusters. Log-rank test was used to assess the statistical significance of the survival difference, with a threshold of p < 0.05 to define significance. Kaplan-Meier analysis and log-rank test were performed using the R package “survival.” All statistical tests were performed using standard R functions.
Literature Search
A literature search was performed using PubMed, accessed via the National Library of Medicine PubMed interface (http://www.ncbi.nlm.nih.gov/pubmed). We programmatically searched the PubMed database using custom Python scripts. We searched through PubMed for all keywords in all fileds, including the title, abstract and main texts of the articles.
Construction of DE Features Network and Analysis
To examine the relationships among the DE features that are associated with the consistently clustered patients with the most prominent survival outcomes, we obtained miRNA-target genes and gene-gene interactions from the existing databases. Human protein-protein interaction network (PPI) data were obtained from STRING database. We downloaded experimentally verified miRNA-target gene relationships from four databases: mir2Disease, miRecords, TarBase, and miRTarBase. We constructed networks based on relationships among the DE features by using Cytoscape 3.9.1, and applied Cytoscape plug-in MCODE to identify DE modules that are related to the survival outcomes. The default parameters were used throughout the network analyses.
Supplemental Material
sj-pdf-1-cix-10.1177_11769351251394107 – Supplemental material for Clustering Analysis of Multiple Omics Data Types Identifies Cancer Patients With Consistent Survival Outcomes
Supplemental material, sj-pdf-1-cix-10.1177_11769351251394107 for Clustering Analysis of Multiple Omics Data Types Identifies Cancer Patients With Consistent Survival Outcomes by Shuting Lin and Peng Qiu in Cancer Informatics
Footnotes
Acknowledgements
Abbreviations
TCGA: The Cancer Genome Atlas; CoC: Cluster of Clusters; CC: consensus clustering; CNMF: consensus non-negative matrix factorization; BLCA: Bladder Urothelial Carcinoma; BRCA: Breast Invasive Carcinoma; HNSC: Head and Neck Squamous Cell Carcinoma; KIRC: Kidney Renal Clear Cell Carcinoma; KIRP: Kidney Renal Papillary Cell Carcinoma; LGG: Lower Grade Glioma; KM: Kaplan–Meier; DE: differential expression; FDR: false discovery rate; GO: Gene Ontology.
Ethical Considerations
Consent to Participate
Author Contributions
S.L. performed the analysis and prepared the manuscript. P.Q. designed and supervised the project, and revised the manuscript. All authors reviewed the manuscript. All authors read and approved the final version of the manuscript.
Funding
The authors disclosed receipt of the following financial support for the research, authorship, and/or publication of this article: This work was supported by funding from the National Science Foundation Directorate for Computer and Information Science and Engineering (CCF2007029). P.Q. is a Wallace H. Coulter Distinguished Faculty Fellow. The funders had no role in study design, data collection and analysis, the decision to publish, or the preparation of the manuscript.
Declaration of Conflicting Interests
The authors declared no potential conflicts of interest with respect to the research, authorship, and/or publication of this article.
Data Availability Statement
All the data used in this study are from publicly available sources. The TCGA dataset analyzed in this study is available in the GDC repository. The miRNA-gene interactions can be found in the following databases: miRecords, mir2Disease, TarBase, and miRTarBase. The protein-protein interactions are available in the STRING database. All the data can also be obtained from the corresponding author on reasonable request. The code and data for this analysis are available on figshare with the link: ![]() .
.
Supplemental Material
Supplemental material for this article is available online.
References
Supplementary Material
Please find the following supplemental material available below.
For Open Access articles published under a Creative Commons License, all supplemental material carries the same license as the article it is associated with.
For non-Open Access articles published, all supplemental material carries a non-exclusive license, and permission requests for re-use of supplemental material or any part of supplemental material shall be sent directly to the copyright owner as specified in the copyright notice associated with the article.