
Abstract
Nuclear paraspeckles are subnuclear bodies contracted by nuclear-enriched abundant transcript 1 (NEAT1) long non-coding RNA, localised in the interchromatin space of mammalian cell nuclei. Paraspeckles have been critically involved in tumour progression, metastasis and chemoresistance. To this date, there are limited findings to suggest that paraspeckles, NEAT1 and heterogeneous nuclear ribonucleoproteins (hnRNPs) directly or indirectly play roles in osteosarcoma progression. Herein, we analysed NEAT1, paraspeckle proteins (SFPQ, PSPC1 and NONO) and hnRNP members (HNRNPK, HNRNPM, HNRNPR and HNRNPD) gene expression in 6 osteosarcoma tumour tissues using the single-cell RNA-sequencing method. The normalised data highlighted that the paraspeckles transcripts were highly abundant in osteoblastic OS cells, except NEAT1, which was highly expressed in myeloid cell 1 and 2 subpopulations.
Introduction
Osteosarcoma (OS) is the most common malignant tumour of bone among children and adolescents, with a second peak of incidence in the elderly. 1 OS is highly aggressive and tends to have early systemic metastasis, which results in a 65%-70% 5-year survival rate. 2 The underlying mechanisms of OS and OS tumour microenvironment still remain unclear. Over the last decade, the RNA sequencing (RNA-seq) method has gained popularity to investigate differential gene expression between normal and disease/disease-related tissues.3,4 However, most RNA-seq is done using the method of bulk-RNA-seq (bulk-RNA-seq) by masking cellular heterogeneity. Not surprisingly, the tumour microenvironment has diverse cell types and each cell type expresses a unique transcriptome profile. Therefore, bulk population sequencing provides only the average expression across a population of cells. Single cell RNA-seq (scRNA-seq) reveals cellular heterogeneity by sorting the cells, consequently, it highlights the transcriptome of each in-dividual cell (subpopulation) in a tissue.5,6 The OS microenvironment is highly heterogeneous and composed of bone cells (osteoclasts and osteoblasts), stromal cells (fibroblasts), vascular cells (endothelial), immune cells (myeloid cells, natural killer/T cells (NK/T cells), B cells, monocytes and plasmocytes) and a mineralized extracellular matrix (Figure 1). 7

Schematic illustration of heterogenicity and main components of the OS microenvironment. The microenvironment is composed of myeloid cells 1 and 2, osteoblastic OS cells, NK/T cells, osteoclasts, carcinoma-associated fibroblasts, plasmocytes, endothelial cells and B cells. The image was created with BioRender.com.
The Human Genome Project has suggested that less than 75% of the human genome is transcribed into RNA molecules, whereas only 1% of messenger-RNAs are translated into proteins. Non-coding RNAs (ncRNAs) were previously considered as background noise from transcriptional processes.8,9 However, in recent years, it has become increasingly apparent that ncRNAs are crucial parts of cellular biology, pathology and human malignancies. Small ncRNAs (less than 200 base pairs) and long ncRNAs (more than 200 base pairs) are the 2 types of ncRNAs8,10,11
Paraspeckles, subnuclear bodies found in the interchromatin space of mammalian cell nuclei were discovered in 2002. 12 They are involved in many physiological processes including gene regulation in an integrated stress response, cellular differentiation, cancer progression and chemoresistance.12-15 The paraspeckles proteins (members of the Drosophila melanogaster behaviour and human splicing family) are contracted by one of the critical lncRNAs, nuclear-enriched abundant transcript 1 (NEAT1). 15 Previous studies suggested that NEAT1 regulates the development of OS as well as promotes cell proliferation, migration and invasion.13,16-20 However, a correlation between paraspeckles and OS development remains unclear.
To gain an unbiased and comprehensive understanding of the gene expression profile of OS, we investigated the OS tumour microenvironment and cellular heterogeneity and the impact of scRNA-seq in the field of OS research. Further, we identified NEAT1, heterogeneous nuclear ribonucleoproteins (hnRNPs) and paraspeckle proteins expression using scRNA-seq data derived from OS tissues.
Materials and Methods
Data source and cell clustering
The results analysed and presented here are based upon data generated through the scRNA-seq data of 6 patients (GSE162454) and the data are available at https://www.ncbi.nlm.nih.gov/geo/query/acc.cgi?acc=GSE162454. Data quality control was performed using the ‘Seurat’ package (version 4.0.5) through R studio (version 4.1.0) and batch effects between cells were processed using the ‘harmony’ package (version 0.1.0). 21
The low-quality cells were excluded from the dataset using the method as described. 22 The uniform manifold approximation and projection (UMAP) technique was used to identify different cell clusters. The cells were named as previously described. 22 Dimensional reduction plot (DimPlot, version 2.3.2) was used to visualise the cell clusters (parameter dim = 1:30, resolution = 0.10). The ‘ggsci’ package (version 2.9) was used to adjust the high-quality colour of the UMAP.
Data normalisation and visualisation
The read counts for scRNA-seq were converted to Transcripts per Million (TPM) values which represents a relative expression level of transcripts by the ‘Seurat’ package. The package has divided the read counts by the length of each gene in kilobases. A heatmap was generated to display the transcript expression of NEAT1, the hnRNP members and the paraspeckle genes of each cell cluster using log10 TPM values. Further violet plots were generated to highlight the expression profile of NEAT1, the hnRNP members and the paraspeckle genes at the cluster level and for the inter-cluster comparison analyses.
Gene ontology enrichment analysis
We performed gene ontology (GO) analyses to identify the biological process (BP), molecular functions (MF) and cellular component (CC) of NEAT1, the hnRNP members and the paraspeckles using the R packages of ‘AnnotationHub’(version 3.4.0), ‘clusterProfiler’ (version 4.4.4), and ‘enrichGO – clusterProfiler’ (version 3.0.4).
RNA interactome from sequencing experiments
RNA Interactome from Sequencing Experiments (RISE) 23 database was used to identify NEAT1, hnRNP family and paraspeckle protein networking with other transcripts.
Transcripts’ expressions analyses
Expression Atlas,24,25 Human Protein Atlas26,27 and Expression Database of Human Long non-coding RNAs (LncExpDB) 28 online databases were used to validate findings through the OS cell lines; G-292-clone-A141B1, HOS, MG-63, SJSA-1, Saos-2, U-2 OS (Expression Atlas), bone marrow (Human Protein Atlas) and osteoblast (LncExpDB) (Accessed date 21/10/2022).
All the statistical analyses were performed through R studio and a P-value < .05 was considered statistically significant. Multiple comparisons (Wilcoxon Rank Sum Test) between the cell clusters were attached in the supplementary result section.
Results
The method of scRNA-seq uncovers the cellular component of the OS tissues
To understand OS tumour microenvironment and the diversity of cell types, we performed scRNA-seq using 6 patients’ (average age of 21 years old) tumour samples who did not receive neoadjuvant chemotherapy. We removed the low-quality cells from the data and the total of 29 278 cells were sequenced. The cellular component analysis helped us to identify 9 distinct clusters by the UMAP and the clusters are myeloid cell 1, osteoblastic OS cell, NK/T cell, myeloid cell 2, osteoclast, carcinoma-associated fibroblast (CAF), plasmocyte, endothelial cell and B cell. Interestingly, myeloid cell 1 has the highest cluster population compared to the rest of the group (34.90%) (Figure 2). It suggests that osteoblastic OS cells are not the main component in the OS microenvironment. The second highest cluster population belongs to the osteoblastic OS cell cluster (20.90%), the third highest cluster population is the NK/T cell cluster (17.89%), and the lowest population cluster belongs to B cells (1.63%).

Single-cell RNA-sequencing analysis reveals cellular heterogeneity of the OS microenvironment: (A) the 2-D UMAP plot shows colour-coded 9 different cell clusters and (B) the pie chart highlights the population of each cluster.
Differential gene expression profile between the clusters
Normalised gene expression values highlighted that NEAT1 showed low expression level in the osteoblastic OS cells, whereas the lncRNA was highly abundant in myeloid cells 1 and 2 clusters (Figure 3). Further, multiple comparisons of NEAT1 expression showed that there were significant differences between all cell clusters except NK/T cells–plasmocytes, and osteoclasts–endothelial cells (Supplemental Table 1).
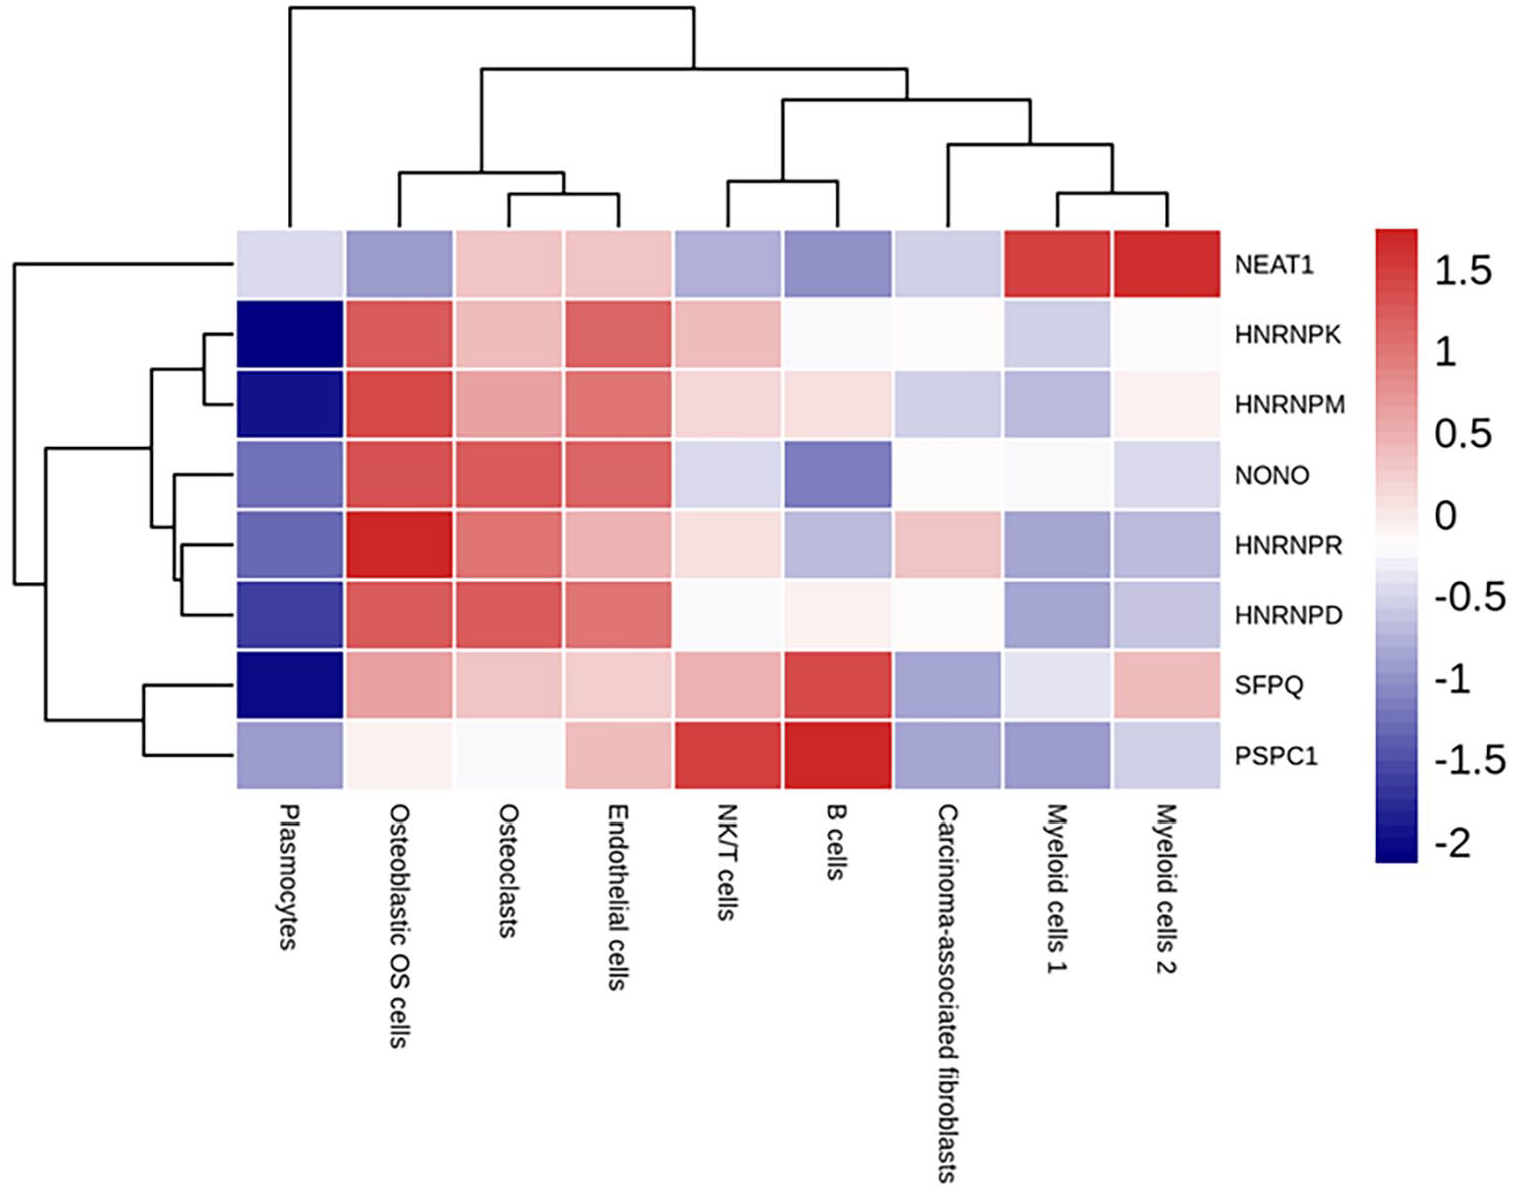
The heatmap reveals the differentially expressed transcripts between the cell clusters. The expression levels were generated through log10 transformation. Red colour indicates higher expression, whereas blue colour indicates lower expression.
The paraspeckle proteins Non-POU Domain Containing Octamer Binding (NONO) and Splicing Factor Proline and Glutamine Rich (SFPQ) and the hnRNP family members HNRNPK, HNRNPM, HNRNPR and HNRNPD are highly expressed in osteoblastic OS cells, osteoclasts and endothelial cells, whereas they show low expression in myeloid cells 1 (Figure 3).
Figures 3 and 4 also highlighted that the paraspeckle genes Paraspeckle Component 1 (PSPC1) and SFPQ showed high expression level in NK/T cells and B cells, whereas, interestingly, NEAT1 performed low abundance in the cell clusters (Figure 3 and Figure 4).

The violin plots display the average expression level in each cell cluster of: (A) NEAT1, (B) NONO, (C) HNRNPD, (D) HNRNPM, (E) PSPC1, (F) SFPQ, (G) HNRNPR and (H) HNRNPK. Each dot represents a single cell. The x-axis identifies the cell types; Myeloid cell 1, osteoblastic OS cells, NK/T cells, Myeloid cells 2, osteoclasts, carcinoma-associated fibroblasts, plasmocytes, endothelial cells and B cells. The y-axis represents an expression level of genes in log (TPM).
The endothelial cells had only 1.94% of the total population, which is approximately 566 cells. Interestingly, NEAT1, SFPQ, PSPC1, HNRNPK, HNRNPM, NONO, HNRNPR and HNRNPD were all expressed in the endothelial cells in the OS tissues, although none of the transcripts showed expression in plasmocytes.
PSPC1 and NEAT1 showed low expression among OS cell lines and bone marrow
The heatmap (Figure 3) revealed that PSPC1 expressed less in osteoblastic OS cells compared to SFPQ, NONO, HNRNPK, HNRNPM, HNRNPR and HNRNPD. Not surprisingly, the transcript also showed low expression among OS cell lines (G-292-clone-A141B1, HOS, MG-63, SJSA-1, Saos-2 and U-2 OS) as well as in the bone marrow using the Expression Atlas and Human Protein Atlas databases, respectively (Figure 5A).

(A) The first graph highlights the transcripts expressions within the OS cell lines and bone marrow using the Expression Atlas and the Human Protein Databases, respectively and (B) the second graph reveals NEAT1 expression within OS cell lines, bone marrow and human osteoblast cells using the Expression Atlas, the Human Protein Databases and the LncExpDB, respectively. The numbers at the end of the bars reveal the transcripts per million (TPM). The databases’ accession date was 21/10/2022.
Further, we obtained NEAT1 expression in human osteoblast cells using the LncExpDB. The result highlighted that, NEAT1 was highly expressed in human osteoblast (TPM = 689), compared to OS cell lines (13 ⩽ TPM ⩽ 131) and bone marrow (TPM = 96) (Figure 5B).
GO biological process, molecular function and cellular component analyses highlighted the proteins’ associations with alternative mRNA splicing, apoptosis and telomere maintenance
We have also investigated the GO biological processes of the proteins. Interestingly, the results revealed that the majority of the proteins have a significant association with alternative mRNA splicing, via spliceosome (GO:0000380), regulation of telomere maintenance (GO:0032206), negative regulation of apoptotic processes (GO:0043066), and negative regulation of oxidative stress-induced intrinsic apoptotic signalling pathway (GO:1902176). GO molecular function also highlighted that the proteins have crucial relationships with RNA and mRNA binding, sequence-specific DNA binding and telomeric DNA binding. According to the GO cellular components, the proteins are mainly localised in the paraspeckles, nuclear periphery and nuclear matrix of the cells (Figure 6).

(A) Gene Ontology enrichment analysis highlights the biological process, (B) molecular function and (C) cellular component of NEAT1, NONO, HNRNPD, HNRNPM, PSPC1, SFPQ, HNRNPR and HNRNPK (P < .05).
RISE database determines NEAT1, NONO, HNRNPD, HNRNPM, PSPC1, SFPQ, HNRNPR and HNRNPK interactions with other transcripts
The transcript-transcript interactions results showed that NEAT1, NONO, HNRNPD, HNRNPM, PSPC1, SFPQ, HNRNPR and HNRNPK interacts with mainly protein-coding genes, ncRNAs, lncRNAs, miRNAs and pseudogenes (Figure 7).

The circos plots show transcript-transcript interaction of (A) NEAT1, (B) NONO, (C) HNRNPD, (D) HNRNPM, (E) PSPC1, (F) SFPQ, (G) HNRNPR and (H) HNRNPK. The ribbon colours indicate the interaction of the transcripts with other transcripts such as transcriptome-wide (orange), targeted (blue) and databases/data set (green). Transcript colours; protein-coding (red), lncRNA (green), ncRNA (blue), miRNA (yellow), pseudogene (black) and snRNA (orange).
The circos plot also highlights NEAT1 transcriptome-wide interaction with TP53 (Figure 6A). In addition, the figure also revealed that NEAT1 interacts with the pseudogenes (RPL7P27, RPL7P27, RP11-618N24, SPCS2P1, RP11-209D20, RPL27AP5, MTND2P28, RP11-618N24, NSUN5P1, FTLP10, RP11-184C23, RP1-261G23, MTCO1P12, MTND4P1, RRN3P3, MTCO1P12, HLA-H, MTND4P12 and GS1-466O4), several miRNAs (MIR204, MIR449A, MIR377, MIR506, MIR335, MIR181D, MIR107, hsa-mir-129-5p, MIR98, MIRLET7E, MIR548AR, MIR320C2, MIR449B, hsa-mir-7-5p, MIR449B and AC002407.3), various protein-coding genes, rRNAs, snRNAs and tRNA (Supplemental Table 2).
NONO interacts with several miRNAs (MIR148B, MIR93, MIR148A, MIR149, MIR744, MIR30C2, MIR505, MIR1301, MIR193B, MIR615 and MIR149), protein-coding genes (M6PR, AURKAIP1, CALM3, CELF2, SEMA3G, PARP15, ITIH5, EEF1A1, EIF5A, AP5S1, PSMD11, ALG3, ABCC9, NR2F2, NDE1, KRT8 and RPL36), rRNAs (18S_RRNA and 28S_RRNA), ncRNAs (RP11-263K19, MIR17HG and COL4A2-AS1), a lncRNA (RP4-806M20) and a snRNA (RNU1-42P) (Figure 7B).
HNRNPD interacts with miRNAs (GNAI3, MIR1229, MIR141, MIR146B, MIR221 and MIR222), protein-coding genes (ACTB, ACTR1A, CAMK2N1, FAM228B, HNRNPDL, MRO, MSN, MT-ATP8, PANK1, PDE4C, PEBP1, PHKB, RPL10 and SLC25A26), rRNAs (18S_RRNA and 28S_RRNA), a pseudogene (HNRNPDP1) and a ncRNA (MIR17HG) (Figure 7C).
HNRNPM interacts with miRNAs (MIR15B, MIR183, MIR191, MIR193B, MIR30A, MIR331, MIR615, MIR93 and MIRLET7F1), protein coding genes (ACTB, KIAA0930, KRT8, MT-ATP6, NDE1 and SH3GLB2), rRNAs (18S_RRNA, and 28S_RRNA), a lncRNA (AC058791) and a pseudogene (QTRT1P1) (Figure 7D).
PSPC1 interacts with several miRNAs (hsa-mir-101-3p, MIR376C, MIR27A and MIR27B), 2 protein-coding genes (CAND1 and EPM2A), and a pseudogene (RP11-484L7) (Figure 7E).
SFPQ interacts with several protein-coding genes (ASCC2, B3GNT7, CABLES1, CLU, DYNC2H1, GRIN2D, KRT72, LAIR1, MAMLD1, MPHOSPH8, MT-CO1, MT-ND5, RPS6KC1, ZFHX3 and ZNF354B), miRNAs (hsa-mir-29b-3p, MIR1229, MIR141, MIR193B, MIR331 and MIR615), ncRNAs (CTD-2653D5, RN7SKP91, and RP11-263K19), lncRNAs (RP11-357H14 and RP11-473M20) and rRNAs (28S_RRNA and HSU13369-5ETS) (Figure 7F).
HNRNPR interacts with protein-coding genes (AOX1, ASCC2, C2orf88, C4A, CPNE3, KLK10, MT-CO2, MT-ND5, OGG1, RFT1 and RP11-263G22), miRNAs (MIR130B and MIR615), ncRNAs (RN7SKP230 and RP3-323A16), a lncRNA (RP11-304L19) and a pseudogene (HNRNPRP1) (Figure 7G).
Finally, HNRNPK interacts with several protein-coding genes (ATF4, C3orf38, CDC42, CDC5L, CFL1, CIRH1A, CTC1, DDI2, E2F2, EFR3A, EIF3L, FRS2, GINM1, GPD2, HUWE1, KPNB1, LENG8, MOCS3, MT-ND4, NAV1, NDE1, PHF10, PKM, PNISR, RALA, RBM17, RBMS1, RPL18, RPS3, RPS3A, RWDD1, SMS, SNRNP70, SNX29, SRSF6, ST3GAL5, SUGP2, TAF4, TBC1D1, TMED2, TOP2A, UNC119, WASF2, XRCC5, ZNF507 and ZNF792), miRNAs (hsa-mir-450a-5p, MIR106B, MIR125B1, MIR1260B, MIR15B, MIR23B, MIR30C1, MIR328, MIR503, MIR615, MIR877 and VMP1), lncRNAs (RP11-175O19.4, TP53COR1 and XIST) and rRNAs (18S_RRNA, 28S_RRNA and 5S_rRNA) (Figure 7H).
Discussion
RNA-seq is a widely used method to highlight transcriptome profiling of tissues or cells. The bulk-RNA-seq approach analyses average gene expression in a tissue, whereas the scRNA-seq method has access to transcriptomes of individual cells. Not surprisingly, scRNA-seq produces more complex datasets and requires more effort than bulk-RNA-seq. 3 Higher complexity, on the other hand, reduces the possibility of data misinterpretation and accumulates a deeper understanding of complex data such as tumour microenvironment and tumour immunity. 29
The results revealed the identification of the 9 major cell clusters using unbiased clustering of gene expression profiles and canonical markers, and the identified clusters are myeloid cell 1, osteoblastic OS cell, NK/T cell, myeloid cell 2, osteoclast, CAF, plasmocyte, endothelial cell and B cell. Out of the total-sequenced 29 278 cells, the highest population belongs to myeloid cells 1, approx. 8783 cells; the second highest population is osteoblastic OS cells, which is approx. 6118 cells; and the third highest cell population is the NK/T cell cluster, which is 5236 cells. The results also highlighted that the immune cells were highly abundant in the OS tumour microenvironment, including myeloid cells 1 (34.90%), NK/T cells (17.89%), myeloid cells 2 (9.59%) and B cells (1.63%). Consequently, the OS tumour environment was composed of 64.01% immune cells, whereas osteoblastic OS cells had only a proportion of 20.9% in the tissues. The myeloid cell group includes monocytes, precursors of multinucleate osteoclasts the main cells responsible for bone resorption. There is considerable interaction between osteoblast and the monocytes macrophages lineage and presumably in this setting also with malignant cells.30-32 However, the limitations of this study are having a small number of patients and missing healthy bone samples.
The innate immune system cells (NK cells, and macrophages-myeloid cells 1 and 2) are responsible for immediate defence against cellular local environmental changes such as pathogens and cellular damage. 33 Human bones have a very conservative-specific microenvironment, consequently, invasion by pathogens is less common. Nevertheless, tissue repair and regeneration are consistently ongoing, therefore the relationship between bone and the innate immune system is to maintain tissue integrity by removing effete and damaged cells through apoptosis as well as stimulating normal tissue repair and regeneration.33-35 One of the hallmarks of cancer is that the immune system recognises and interacts with growing tumours and immune evasion via adaptive immune cells (B and T cells).36,37 Both B and T cells were abundant in the OS tissue microenvironments. The high abundance and functional properties of the immune cells in the OS microenvironment may suggest that a wealth of personalised immunotherapy strategies could be developed to treat the disease. To date, immunotherapy has shown no significant therapeutic effects on solid tumours, including soft tissue sarcoma and OS. Although most immunotherapies have been developed through T and NK cells, clearly, there is an urgent need to generate more therapeutic agents through other immune cells, especially macrophages, myeloid cell 1 and myeloid cell 2.38,39
According to the findings, the relative NEAT1 transcript expression was upregulated in the OS patients’ tissues compared to paired normal bone. 17 Interestingly, our data showed that the highest expression of NEAT1 was in the myeloid cell 1 and 2 clusters, not in the osteoblastic OS cells (Figure 3).
NEAT1 is the architectural component of paraspeckles (non-membrane structure). 40 The structure is heavily involved in gene regulation, RNA retention, inhibition of apoptosis and the development of cancer.13,15,40 Our results also showed that NONO, SFPQ, HNRNPK, HNRNPM, HNRNPR and HNRNPD were abundant in osteoblastic OS cells compared to other cell clusters. Recent studies have highlighted that silencing of NONO inhibits transcriptional coactivator with PDZ binding motif (TAZ) driven tumourigenesis in orthotopic glioblastoma mouse models. 41 This confirms that NONO expression is crucial for TAZ liquid–liquid phase separation, which activates transcription in the nucleus.41-43 SFPQ protein has been linked to colorectal cancer, breast cancer, hepatocellular cancer, chronic myeloid leukaemia, renal cancer and prostate cancer.44-55 Further, the knockdown of SFPQ led to reduced cell proliferation, migration and invasion in melanoma. 56
The hnRNP members belong to the ribonucleoprotein complex family. The proteins localise widely in nucleus, cytoplasm, mitochondria and cell membrane of eukaryotic cells. In addition, the family members have high expression in a variety of human cells and tissues. 57 Interestingly, the expression of the hnRNPs has been altered in many cancer types. Further, it was confirmed that the family is involved in various cellular processes such as multiple signal transduction, DNA repair, mRNA homoeostasis and telomere synthesis.57,58 hnRNPK interacts with lncRNAs and is involved in various pathogenic disorders including skeletal disorders and tumourigenesis. 59 Not surprisingly, the hnRNPs revealed a high abundance in osteoblastic OS cells compared to other cell clusters (Figures 3 and 4).
To verify our findings, we further investigated NEAT1, PSPC1, NONO, SFPQ, HNRNPK, HNRNPM, HNRNPR and HNRNPD expressions in human OS cell lines and human bone marrow. The result highlighted that NEAT1 and PSPC1 revealed low expression within the OS cell lines and moderate expression in the bone marrow (Figure 5A). Healthy bone marrow cells are cluster of populations such as T cells, monocytes, B cells, erythrocytes, haematopoietic stem/progenitor cells, dendritic cells, plasma cells and magokaryocytes. 60 Interestingly, PSPC1 and NEAT1 were also performed low expression in osteoblastic OS cells and NEAT1 showed high expression in myeloid cells 1 and 2, whereas PSPC1 performed high expressed in NK/T cells and B cells (Figure 3).
NEAT1 expression was obtained in human osteoblast cells using the LncExpDB. The result highlighted that NEAT1 expression was dramatically high in osteoblast cells compared to U-2 OS, Saos-2, SJSA-1, MG63, HOS and G-292-clone-A141B1. In addition, NEAT1 also highly expressed in the bone marrow compared to the OS cell lines, except U-2 OS (Figure 5B). According to the literatures high expression of NEAT1 promotes cell proliferation, migration, invasion and inhibition of apoptosis in various cancers, including OS.61-63 Our results stated the other way around which is NEAT1 poorly expressed in the osteoblastic OS cells of the OS patients and osteosarcoma cell lines compared to osteoblasts.
The most significant GO biological process analysis has confirmed that the transcripts have been involved in alternative mRNA splicing, via spliceosome, regulation of telomere maintenance, negative regulation of the apoptotic process, regulation of gene expression and control double-strand break repair (Figure 6). Alternative mRNA splicing can produce several isoforms with different proteins and diverse functions for the same gene loci. Therefore, dysregulations of alternative mRNA splicing are strongly associated with tumour progression and affect various aspects of cancer characteristics. 64 The DNA in telomeres gets shorter when cells divide, eventually halting cell division when the telomere reserve is depleted. Tumour cells are capable of replicative immortality by activating a telomere-maintenance mechanism, consequently, the telomeres never shorten further resulting in unlimited cell division of cancer cells. 65 Cancer cells could hijack normal cellular growth pathways as well as evade programmed cell death. Negative regulation of the apoptotic process, also known as inhibition of apoptosis, is one of the hallmarks of cancer. 36 Further, the transcripts are also associated with the regulation of gene expression which means the transcripts can increase or decrease the production of specific gene products (protein or RNA), which is another important characteristic of cancer. 66 Double-strand break repair is a critical cellular process due to an unrepaired double-strand break could lead to chromosomal rearrangements, and promote genomic instability, and tumourigenesis. 67 In addition, the GO molecular function also supported that the proteins either bind to the double or single-stranded RNA in cells to regulate gene expression.
Further, the circos plots revealed that the transcripts have interactions with various miRNAs and pseudogenes (Figure 7). MiRNAs can function as either oncogenes or tumour suppressors depending on cellular conditions. The findings highlighted that dysregulated miRNAs result in sustaining proliferative signalling, evading growth suppressors, resisting apoptosis, activating invasion and metastasis and inducing angiogenesis. 68 These characteristics are also known as the hallmarks of cancer. 36 Pseudogenes, a member of lncRNA family, have been labelled as ‘junk’ DNA, which is failed copies of genes and unable to encode proteins. 69 Recent studies have highlighted that pseudogenes can function as oncogenes or tumour suppressors, further they can serve as miRNA decoys to compete with miRNAs which may target parent genes. 70
Taken together, these results demonstrate the impact of intralesional tumour heterogeneity on the OS tissues and suggest that scRNA-seq transcriptome profiling helps to identify and characterise clinically important subpopulations in the tumour microenvironment to develop successful personalised-targeted treatments. Our results also highlighted that the paraspeckle proteins and the hnRNP family members HNRNPK, HNRNPM, HNRNPR and HNRNPD showed high expression in osteoblastic OS cell clusters, whereas NEAT1 was highly expressed in myeloid cell 1 and 2 subpopulations. The findings also indicate that there is an urgent need for a large-scale scRNA-seq gene expression profiling study for the comprehensive characterization of solid heterogeneous malignancies. In addition, the results highlighted that aberrant expressions of NEAT1, the paraspeckle proteins and HNRNPK, HNRNPM, HNRNPR and HNRNPD have been associated with several hallmarks of cancer.
Supplemental Material
sj-csv-2-cix-10.1177_11769351221140101 – Supplemental material for Single-Cell Transcriptome Analysis Reveals Paraspeckles Expression in Osteosarcoma Tissues
Supplemental material, sj-csv-2-cix-10.1177_11769351221140101 for Single-Cell Transcriptome Analysis Reveals Paraspeckles Expression in Osteosarcoma Tissues by Emel Rothzerg, Wenyu Feng, Dezhi Song, Hengyuan Li, Qingjun Wei, Archa Fox, David Wood, Jiake Xu and Yun Liu in Cancer Informatics
Supplemental Material
sj-docx-1-cix-10.1177_11769351221140101 – Supplemental material for Single-Cell Transcriptome Analysis Reveals Paraspeckles Expression in Osteosarcoma Tissues
Supplemental material, sj-docx-1-cix-10.1177_11769351221140101 for Single-Cell Transcriptome Analysis Reveals Paraspeckles Expression in Osteosarcoma Tissues by Emel Rothzerg, Wenyu Feng, Dezhi Song, Hengyuan Li, Qingjun Wei, Archa Fox, David Wood, Jiake Xu and Yun Liu in Cancer Informatics
Footnotes
Funding:
The author(s) disclosed receipt of the following financial support for the research, authorship, and/or publication of this article: This research was partly funded by the Abbie Basson Sarcoma Foundation (Sock it to Sarcoma!). E.R. was also supported by the Australian Graduate Women—Barbara Hale Fellowship.
Declaration of conflicting interests:
The author(s) declared no potential conflicts of interest with respect to the research, authorship, and/or publication of this article.
Author Contributions
Conceptualization, E.R., J.X. and Y.L.; methodology, W.F., E.R.; software, W.F., E.R.; validation, formal analysis, investigation, and data curation, E.R., W.F., D.S., H.L. and Q.W; writing – original draft preparation, E.R.; writing – review and editing, J.X., D.W., A.F..; supervision, J.X., D.W., Y.L.; project administration, J.X., D.W., Y.L.; funding acquisition, Y.L. All authors have read and agreed to the published version of the manuscript. D. S., H.L. and Y.L. were visiting scholars at Jiake Xu’s lab at the University of Western Australia.
Supplemental Material
Supplemental material for this article is available online.
References
Supplementary Material
Please find the following supplemental material available below.
For Open Access articles published under a Creative Commons License, all supplemental material carries the same license as the article it is associated with.
For non-Open Access articles published, all supplemental material carries a non-exclusive license, and permission requests for re-use of supplemental material or any part of supplemental material shall be sent directly to the copyright owner as specified in the copyright notice associated with the article.