
Abstract
Objectives:
Early skin cancer detection in primary care settings is crucial for prognosis, yet clinicians often lack relevant training. Machine learning (ML) methods may offer a potential solution for this dilemma. This study aimed to develop a neural network for the binary classification of skin lesions into malignant and benign categories using smartphone images and clinical data via a multimodal and transfer learning-based approach.
Methods:
We used the PAD-UFES-20 dataset, which included 2298 sets of lesion images. Three neural network models were developed: (1) a clinical data-based network, (2) an image-based network using a pre-trained DenseNet-121 and (3) a multimodal network combining clinical and image data. Models were tuned using Bayesian Optimisation HyperBand across 5-fold cross-validation. Model performance was evaluated using AUC-ROC, average precision, Brier score, calibration curve metrics, Matthews correlation coefficient (MCC), sensitivity and specificity. Model explainability was explored using permutation importance and Grad-CAM.
Results:
During cross-validation, the multimodal network achieved an AUC-ROC of 0.91 (95% confidence interval [CI] 0.88-0.93) and a Brier score of 0.15 (95% CI 0.11-0.19). During internal validation, it retained an AUC-ROC of 0.91 and a Brier score of 0.12. The multimodal network outperformed the unimodal models on threshold-independent metrics and at MCC-optimised threshold, but it had similar classification performance as the image-only model at high-sensitivity thresholds. Analysis of permutation importance showed that key clinical features influential for the clinical data-based network included bleeding, lesion elevation, patient age and recent lesion growth. Grad-CAM visualisations showed that the image-based network focused on lesioned regions during classification rather than background artefacts.
Conclusions:
A transfer learning-based, multimodal neural network can accurately identify malignant skin lesions from smartphone images and clinical data. External validation with larger, more diverse datasets is needed to assess the model’s generalisability and support clinical adoption.
Introduction
Skin cancers – including melanomas, squamous cell carcinomas (SCCs) and basal cell carcinomas (BCCs) – are among the most commonly diagnosed malignancies worldwide and account for 1 in every 3 cancer diagnoses.1,2 Melanomas, which constitute only around 2% of all skin cancer cases, were estimated to cause 57 000 deaths globally in 2020.3,4 Although non-melanoma skin cancers are typically perceived as less dangerous, they can also pose significant health burdens. For instance, SCCs have been reported to cause mortality rates comparable to melanomas in parts of the southern and central United States. 5 While BCCs rarely metastasise, they can cause significant local tissue damage and result in cosmetic disfigurements and functional impairments. 6
The prognosis of skin cancers is highly dependent on lesion type, depth and stage – information that can only be obtained through examinations and biopsies by dermatologists. Thus, timely referral of suspicious lesions from primary care to dermatology is essential for early diagnosis and treatment. Yet, studies indicate that primary care physicians are generally inadequately trained in skin cancer detection and management.7,8 While targeted educational programmes have been proposed,9,10 these curricula are often limited in length due to the busy schedules of practising physicians. 10 Additionally, the effectiveness of such educational interventions is poorly evaluated in published studies, and it is unknown whether the knowledge gained from these curricula can be retained long-term. 9
Machine learning (ML) offers an alternative strategy by enabling systematic triage of suspicious skin lesions using images. Most ML efforts to date have focused on dermoscopic images, which offer consistent, clearly segmented and well-lit lesions for interpretation. Computer vision-based models, such as convolutional neural networks (CNNs), perform well under these conditions. A previous investigation by Angeline et al using a 2-stage CNN reached an accuracy of over 97% when identifying melanoma lesions from dermoscopic images. 11 Similarly, Alshahrani et al developed a neural network model for multiclass classification of dermoscopic images into different skin cancer subtypes and achieved an area under the receiver operating characteristics curve (AUC-ROC) of 0.96. 12
However, while dermatologists are well-trained in dermoscopy, patients and primary care physicians – especially those in areas with limited access to specialised dermatology services – may not have the equipment and skills necessary to perform such an examination. 13 Instead, ML models targeting these non-specialised users must rely on images captured with smartphones and portable cameras, which are prone to variable lighting, distortion, occlusions (eg, hair and tattoos), and poor resolutions, all of which can degrade model performance. A recent investigation by Rios-Duarte et al found that the performance difference between non-dermoscopy and dermoscopy skin cancer detection models can be greater than 20%, with dermoscopy-based models yielding an AUC-ROC of 0.87 versus 0.66 from models trained on digital camera photos of the same patient cases. 14
Another limitation of existing ML approaches is their sole reliance on imaging data.15 -19 In clinical practice, dermatologists supplement their visual assessments with patient history, risk factors, demographics, and symptoms. Image-based unimodal models omit this contextual information. Multimodal approaches, which combine images with structured clinical data, can more closely approximate real-world clinical reasoning and may offer more robust and generalisable screening performance, especially in ambiguous or low-quality imaging scenarios. 20
Evidently, there remains a need to develop multimodal ML strategies to improve skin cancer detection using non-dermoscopy images. In this study, we developed and evaluated a novel, transfer learning-based multimodal neural network that integrates structured clinical variables with smartphone-captured lesion images, optimised using an efficient hyperparameter tuning approach known as Bayesian Optimisation HyperBand (BOHB). We describe the model’s development and tuning process, compare its performance against unimodal clinical data- and image-based models and examine its calibration, explainability, as well as fairness across skin phototypes.
Definition of terms
Transfer learning
Transfer learning refers to the adaptation of a pre-trained neural network for a new task. 21 For example, pre-training a neural network to classify a random assortment of images – such as animals, objects, and landscapes – helps the model learn to extract basic visual features like edges, textures, shapes, and luminosity changes. These learned capabilities can then be repurposed for more specialised tasks, such as classifying skin lesions, even with relatively small datasets of lesion images and limited computational resources.
Multimodal learning
Multimodal learning involves integrating multiple types of input data into a unified neural network.20,22 In our model, we combined tabular clinical data – including patient demographics, histories, symptoms, and lesion descriptors – with imaging features extracted from lesion photographs. This approach reflects real-world diagnostic processes, where dermatologists use visual inspection in conjunction with clinical context to make diagnostic decisions.
Bayesian Optimisation HyperBand
BOHB is an advanced method for hyperparameter tuning. 23 Hyperparameter tuning is a critical step in ML model development, where the most optimal hyperparameters, or ‘settings’, are identified for ML algorithms. 24 Many ML studies opt to manually tune the hyperparameters or simply use default configurations. These approaches are non-systematic and can be catastrophic to the model’s performance and generalisability. Systematic methods like grid-searching, which tests all possible hyperparameter combinations, are exhaustive but also computationally expensive. Random searching, which tests random combinations of hyperparameters, is empirically considered more efficient than grid-searching; it can identify top-performing hyperparameter combinations in as few as 60 trials. 25
BOHB improves upon random searching by incorporating Bayesian optimisation.26 -32 Bayesian optimisation starts with several rounds of random searching. As the search progresses, results from previous hyperparameter trials are used to inform which hyperparameter combinations to test next. In essence, Bayesian optimisation can be thought of as a more intelligent and ‘guided’ version of random search. On a technical level, Bayesian optimisation involves building a surrogate model to predict how changes in hyperparameter values affect performance. An acquisition function then uses this surrogate model to select promising combinations for further trials, and results from these trials are used to iteratively re-update the surrogate model. The process repeats until the pre-allocated resource budget is exhausted.33,34
BOHB also incorporates Hyperband. 35 Hyperband starts by evaluating hyperparameter combinations using minimal resources, such as running models for only one epoch. Based on initial results, Hyperband retains only the top-performing configurations and terminates the rest. This process repeats, progressively allocating more resources (eg, running for more epochs) to fewer hyperparameter configurations until the overall resource budget is exhausted. 36 Bayesian optimisation and Hyperband allow hyperparameters to be tuned efficiently and effectively for large, complex models such as the multimodal model developed in this study.
Methods
The development of this predictive model was conducted and reported in accordance with the Transparent Reporting of a Multivariable Prediction Model for Individual Prognosis or Diagnosis + AI (TRIPOD + AI) Checklist for Prediction Model Development (Supplemental Table S1) 37 and the Checklist for Evaluation of Image-Based Artificial Intelligence Reports in Dermatology (CLEAR-Derm; Supplemental Table S2). 38
Data Sources
We retrospectively analysed clinical and imaging data from the PAD-UFES-20 dataset (http://doi.org/10.17632/zr7vgbcyr2.1). PAD-UFES-20 contains 2298 images and associated clinical data from 1641 skin lesions in 1373 Brazilian patients. For model development, each image and its associated clinical data was considered as a separate patient case.
Lesions depicted in the dataset images include 3 categories of benign skin lesions (actinic keratosis, melanocytic nevus, and seborrheic keratosis) and 3 categories of malignant skin conditions (BCC, melanoma and SCC). All malignant diagnoses in the PAD-UFES-20 dataset were validated via biopsies. The images were collected using a diverse range of smartphone devices, and they present with different resolutions, angles and lighting conditions. The images were straight-from-the-device with no post-processing, except for patient-applied cropping to focus on the region of interest during image upload. 39
Because this study involved only secondary analysis of publicly available, anonymised patient data with no identifiable information, it was exempt from ethics review under the Tri-Council Policy Statement: Ethical Conduct for Research Involving Humans (TCPS 2). 40
Target Outcome
The model was developed to predict the probability of malignancy, and by extension, to perform binary classifications of suspicious lesions into malignant and benign categories based on ground truth labels provided in the PAD-UFES-20 metadata. Skin lesions diagnosed as BCC, melanoma or SCC were designated as malignant. Because the model is intended for triage purposes in primary care or non-clinical settings to determine whether specialist referrals or interventions may be required, we did not attempt multiclass classifications to establish specific pathological diagnoses.
Derivation and Internal Validation Split
Typically, train-test splits in ML studies involve an arbitrary 80-20 or 70-30 split, with substantially more samples assigned to the training set. 41 In this study, we purposefully selected a near 50 to 50 split, holding out 1000 cases as an internal validation set and using 1298 cases for tuning and training (ie, the derivation set). This approach was chosen to demonstrate the effectiveness of a transfer-learning approach on smaller datasets, as well as to better evaluate the generalisability of the developed model across a larger number of test cases. Patient characteristics in the derivation and internal validation sets are summarised in Table 1.
Case characteristics in PAD-UFES-20 dataset and in the derivation and internal validation subsets.
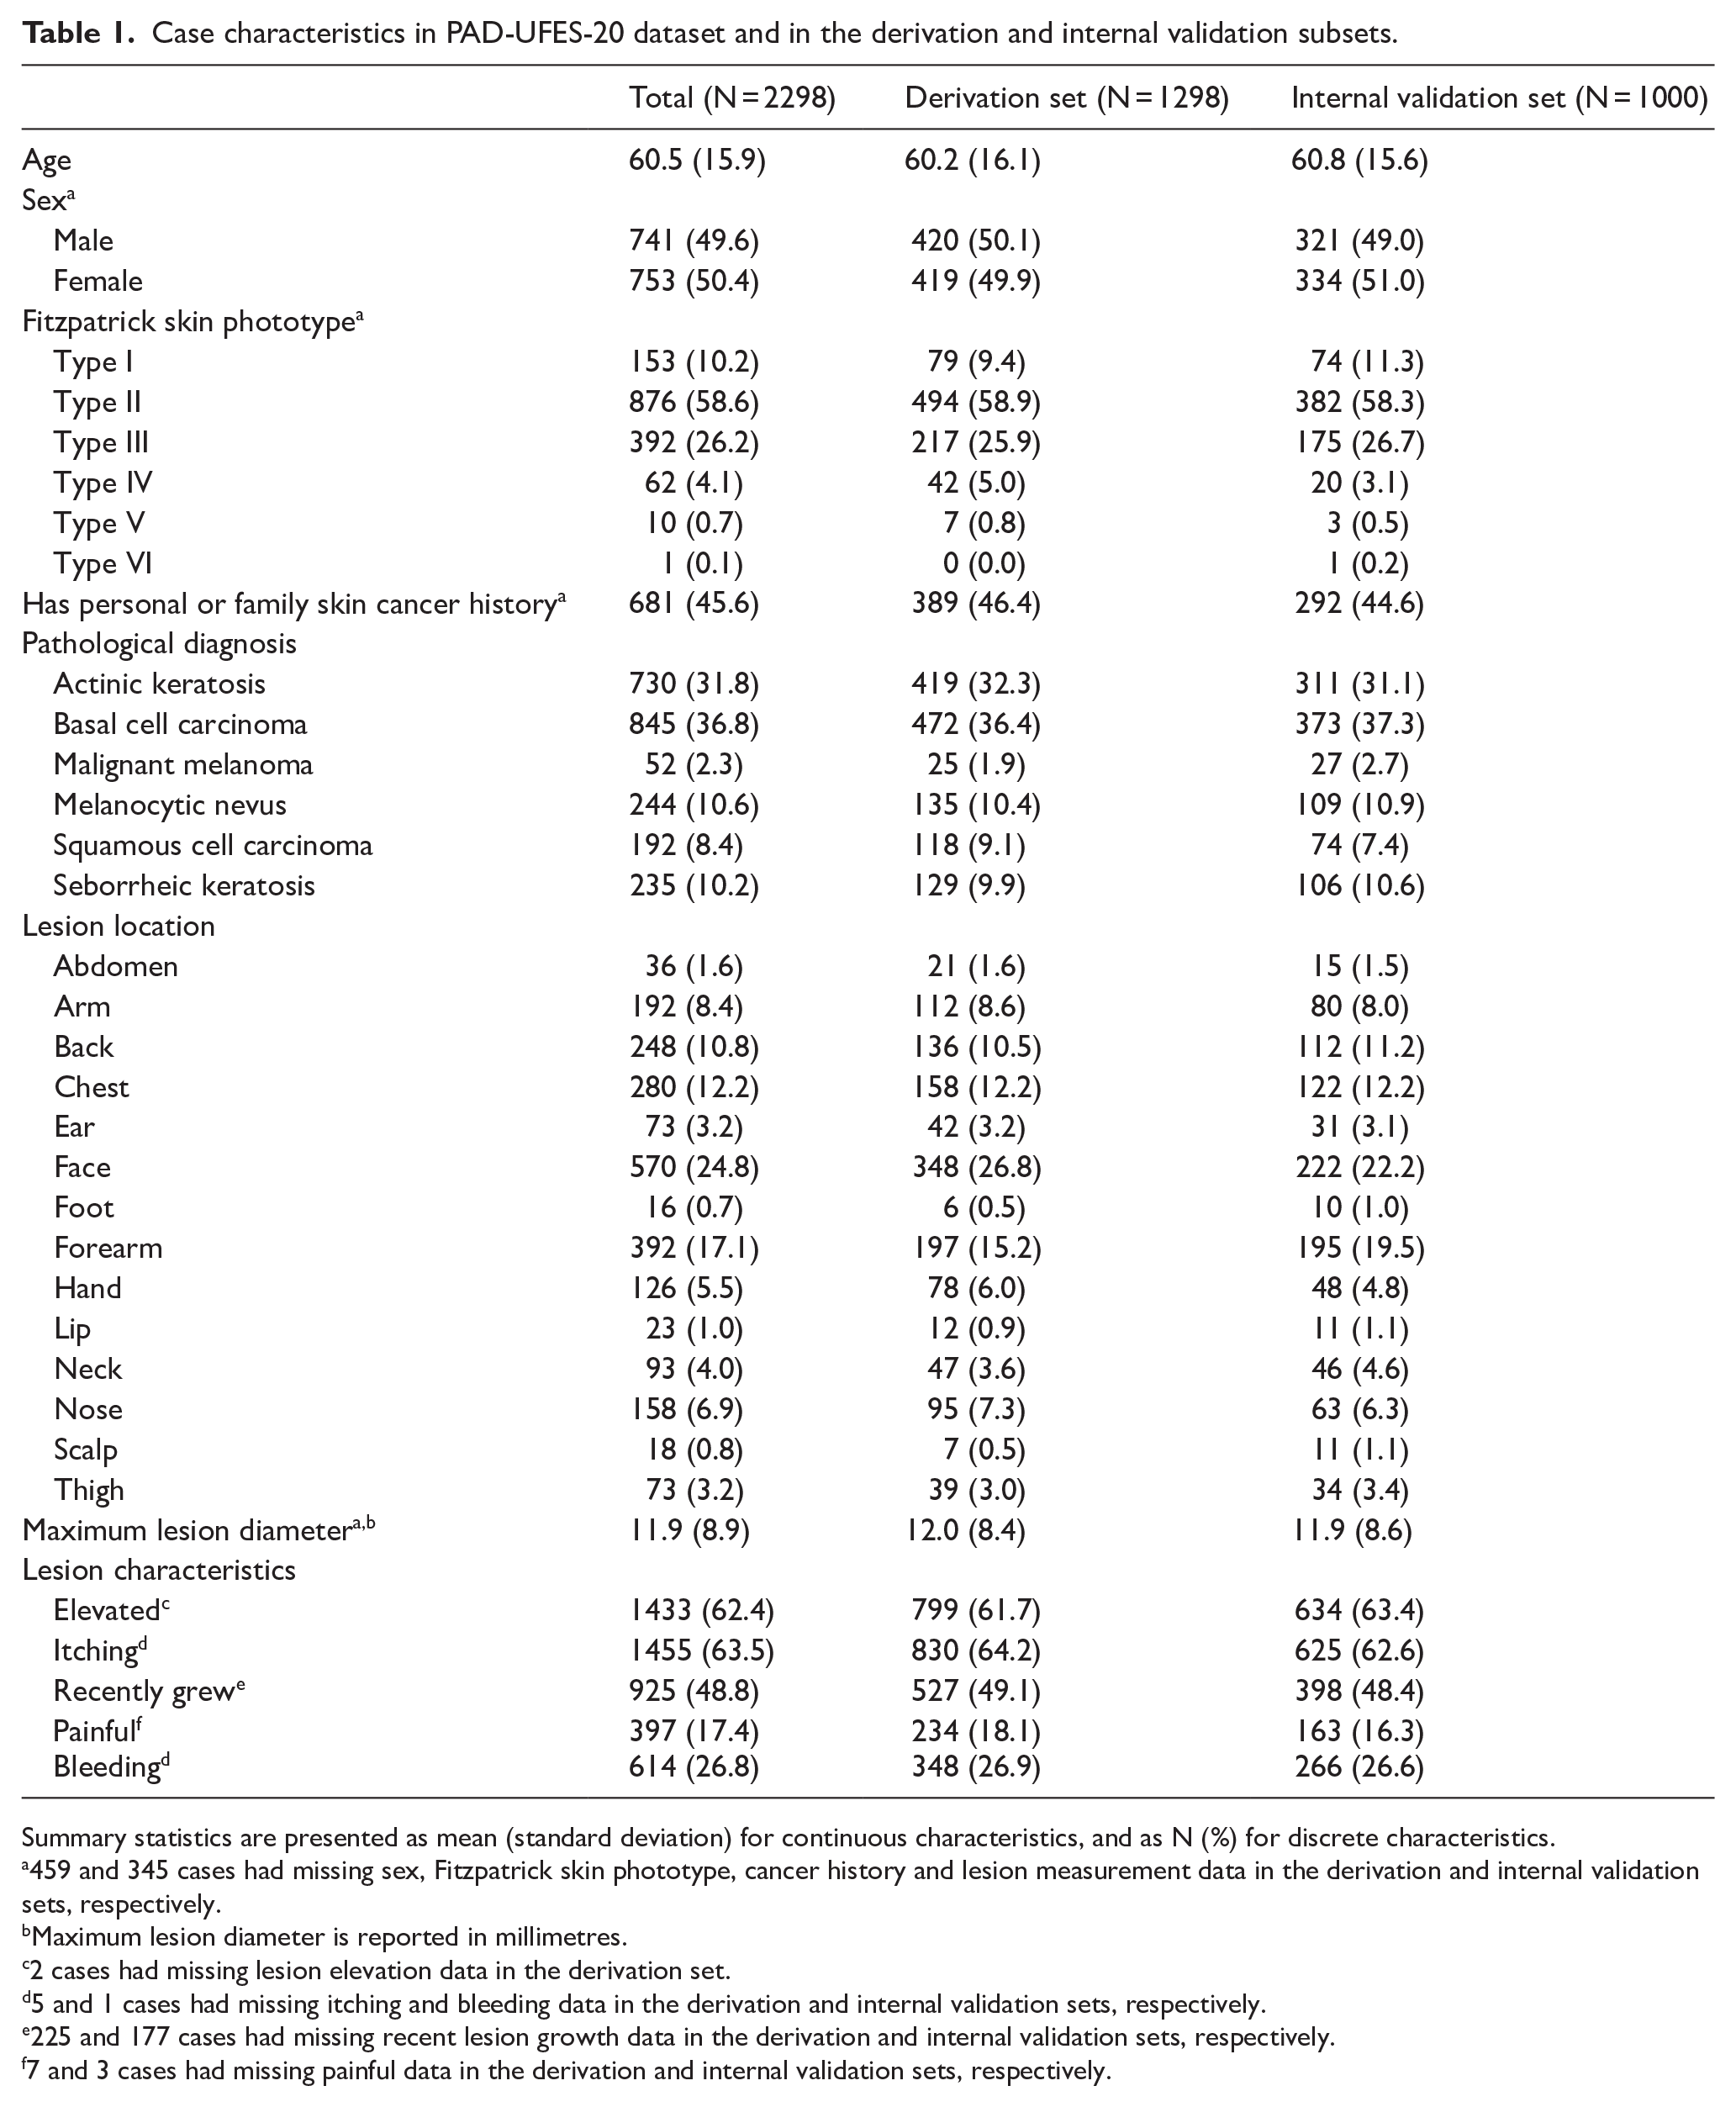
Summary statistics are presented as mean (standard deviation) for continuous characteristics, and as N (%) for discrete characteristics.
459 and 345 cases had missing sex, Fitzpatrick skin phototype, cancer history and lesion measurement data in the derivation and internal validation sets, respectively.
Maximum lesion diameter is reported in millimetres.
2 cases had missing lesion elevation data in the derivation set.
5 and 1 cases had missing itching and bleeding data in the derivation and internal validation sets, respectively.
225 and 177 cases had missing recent lesion growth data in the derivation and internal validation sets, respectively.
7 and 3 cases had missing painful data in the derivation and internal validation sets, respectively.
Image-Based Neural Network
We started the development of the multimodal model by adapting a pre-trained DenseNet-121 42 for performing skin lesion classification using smartphone images (Figure 1A).

Illustration of the 3 neural network architectures used in this study. Feature maps shown are taken from the corresponding locations within DenseNet-121. Numbers and dimensions under the layers and feature maps indicate the dimension and size of the corresponding layer outputs/feature maps. Numbers in brackets next to the dense block labels indicate the number of convolution blocks in each corresponding dense block. The example image originates from the PAD-UFES-20 dataset. 39 (A) The image-based neural network, which uses a pre-trained DenseNet-121 for feature extraction. Images were randomly augmented before entering the network during training. The classifier of the image-based network consisted of a global average pooling layer and a ReLU hidden layer, with accompanying dropout and batch normalisation layers and followed by a sigmoid output layer. (B) The clinical data-based neural network, which of 2 ReLU hidden layers with accompanying dropout and batch normalisation layers, followed by a sigmoid output layer. (C) The multimodal neural network. Tensors from both the clinical data- and image-based networks are concatenated to form the inputs to the multimodal network. The multimodal classifier consists of a single ReLU hidden layer, with accompanying dropout and batch normalisation layers and followed by a sigmoid output layer.
Image Preprocessing
Image data were first split into individual RGB colour channels and resized to 224 × 224 pixels. Pixel values were then min-max normalised to values between 0 and 1. These preprocessing steps ensured that the image inputs resembled those used during the pretraining of DenseNet-121. 42 Because images in the PAD-UFES-20 dataset were already square-cropped by patients at the time of image upload, no additional cropping was performed.
Image Augmentations
Five image augmentation layers were randomly activated as hyperparameters during model training to improve generalisability and reduce the risk of overfitting. These augmentations included random rotation, random horizontal/vertical flips, random cropping/zooming, random contrast and random brightness adjustments.43 -45
Network Architecture
The network architecture is visualised in Figure 1A. CNN-based classification neural networks typically consist of 2 components: a feature extractor and a classifier. 46 For the feature extractor, we adopted the DenseNet-121 architecture. 47 DenseNet architectures are composed of dense blocks, wherein each layer within a dense block is connected to every other layer in a feed-forward fashion. This means that the input to each layer consists of the feature maps of all preceding layers, which promotes feature reuse and efficient gradient flow (Figure 2). For the classifier, a global average pooling layer was used, followed by a rectified linear unit (ReLU) layer with 16 neurons and He kernel initialisation. 48 The pooling and ReLU layers were followed by a dropout layer, which was used for regularisation to prevent overfitting. 49 The dropout probability was determined via hyperparameter tuning. A batch normalisation layer followed each dropout layer to improve the speed and stability of model training. 50 After the hidden layers, an output layer with a sigmoid activation function and Xavier kernel initialisation was used to output the predicted probabilities. An AdamW optimiser was used. 51 Learning rate, weight decay rate, and batch size were determined by hyperparameter tuning.
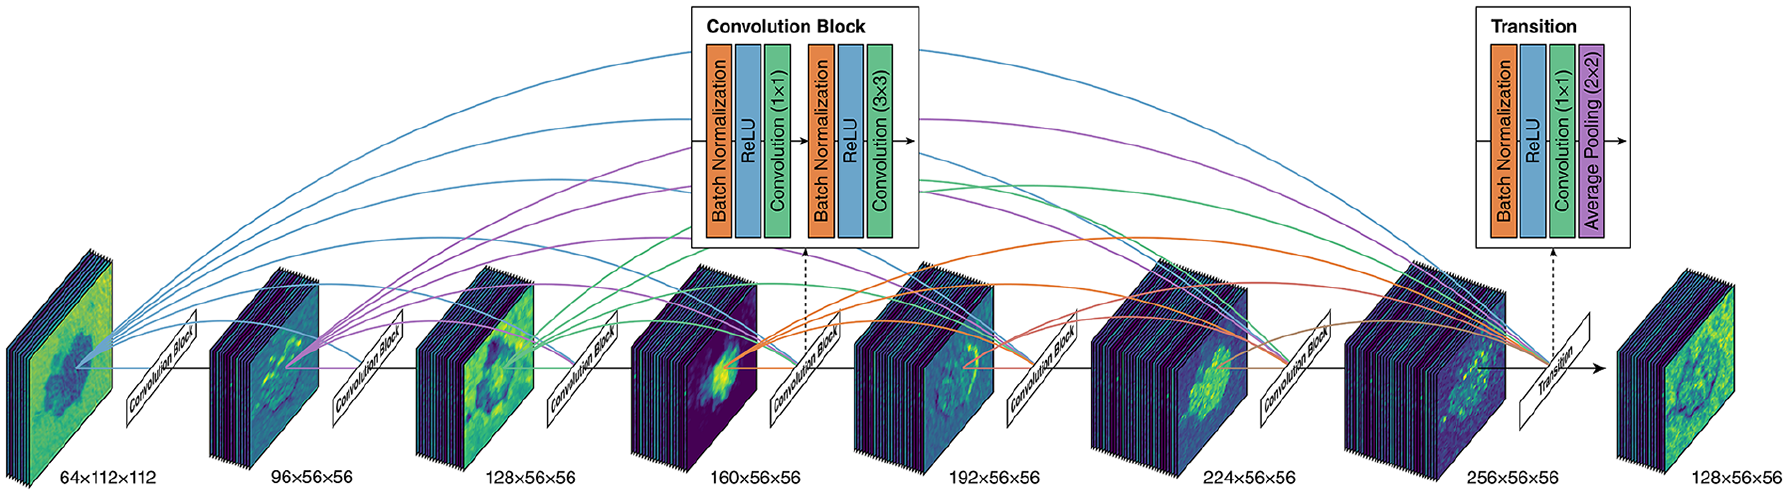
Illustration of the inner structure of a dense block within DenseNet-121. An example dense block with 6 convolution blocks is shown. Also shown are the structures of each convolution block and the transition block in-between dense blocks. Dimensions under each set of feature maps indicate the dimension of the feature maps. Feature maps are for illustration purposes only. The example image originates from the PAD-UFES-20 dataset. 39
Transfer Learning and Fine-Tuning
DenseNet-121 was previously pre-trained using images from a large computer vision research image database called ImageNet. 52 The specific subset used for DenseNet-121 pretraining, the ImageNet Large Scale Visual Recognition Challenge (ILSVRC) subset, contained around 1.2 million human-annotated training images spanning over 1000 object categories. 53 To apply a transfer learning approach, we loaded the pre-trained weights from ImageNet and froze the weights to prevent them from being updated during training. After initial model training was complete, the DenseNet-121 weights were unlocked, and the model was further trained for 10 epochs at a very low learning rate (1 × 10⁻⁶) to fine-tune the model. The batch normalisation layers within DenseNet-121 remained frozen during fine-tuning to prevent unexpected performance degradations due to loss of important pre-trained information. 54
Clinical Data-Based Neural Network
We then created a standalone multilayer perceptron neural network classifier for skin lesion classification based on only clinical data (Figure 1B).
Feature Selection
Feature selection was primarily guided by feature availability in the PAD-UFES-20 dataset and expert domain knowledge. The final list of selected clinical features is presented in Supplemental Table S3. Because neural networks automatically downweight redundant or non-contributory features during training, and the overall number of features was low, we did not explicitly adopt additional statistical feature selection or dimensionality reduction techniques.
Data Imputation and Resampling
Missing data were imputed using multiple imputation by chained equations (MICE). 55 Given that the number of MICE iterations should be informed by the percentage of missing data,56,57 and that our derivation set had a maximum missing data percentage of around 40%, we opted to use 40 iterations of MICE. The derivation and internal validation datasets were imputed separately to avoid data leakage. 58 Although the dataset was imbalanced, we did not apply any resampling techniques, as our objective was to predict malignancy probabilities based on class distributions in the original dataset.
Data Preprocessing
Categorical features, such as lesion location, were one-hot-encoded. 59 All features were standardised (ie, centred around the mean with a standard deviation of 1) using a normalisation layer in the network. 60
Network Architecture
The network architecture is visualised in Figure 1B. Each hidden ReLU layer within the clinical data network contained 16 neurons. Because the structure of the clinical dataset was relatively simple and low-dimensional, the number of neurons was determined empirically, by selecting the largest power of 2 that is smaller than the number of input nodes (ie, the number of features). The dropout, batch normalisation, and sigmoid layers were configured similarly to those in the classifier component of the image-based neural network. An AdamW optimiser was used. 51
We constructed clinical data networks with 2, 3 or 4 hidden ReLU layers and performed hyperparameter tuning on all 3 network types. We found that network performance did not improve beyond 2 hidden layers, and the network with 3 hidden layers exhibited signs of overfitting. Thus, the final network consisted of 2 hidden ReLU layers.
Multimodal Neural Network
To create a multimodal neural network, tensors from the last hidden layers before the output layers in both the clinical data- and image-based neural networks were concatenated. An additional ReLU layer with 16 neurons processed the concatenated tensors before a sigmoid layer output the predicted probability (Figure 1C). The dropout, batch normalisation, and sigmoid layers were configured similarly to those in the classifier component of the image-based neural network. An AdamW optimiser was used. 51
Hyperparameter Tuning
Hyperparameter tuning was performed using BOHB 23 across 5-fold cross-validation, with the objective of minimising average cross-entropy loss across the 5-folds. Given that random search can typically identify top-performing hyperparameter combinations in around 60 iterations, 25 we aimed to set our resource budget well above this target. Due to computational resource limitations, each network underwent 250 iterations of BOHB. The list of tuned hyperparameters and their respective search spaces are presented in Supplemental Tables S4-S6.
The number of epochs was determined empirically. Changes in cross-entropy loss were monitored during model fitting, and training was stopped when average cross-entropy loss stopped decreasing. As previously discussed, the image-based and multimodal neural networks underwent an additional 10 epochs of training at a very low learning rate to fine-tune DenseNet-121.
Threshold Selection
After the models were trained and optimised, threshold tuning was performed to maximise their binary classification performance. ‘Balanced’ thresholds were first derived to maximise Matthews correlation coefficient (MCC). 61 MCC was calculated for every classification threshold between 0.01 and 0.99 at intervals of 0.01. The threshold with the highest average MCC across 5-fold cross-validation was selected and rounded to the nearest 0.05 as the most optimal threshold.
In addition to balanced thresholds, high-sensitivity thresholds were derived to maintain a sensitivity closest to and above 0.90 and 0.95 during 5-fold cross-validation. Due to the importance of early referral and biopsy of suspicious lesions, we anticipate that high-sensitivity thresholds would be more frequently used in clinical settings compared to the balanced thresholds.
Model Evaluation
The 3 networks were evaluated using a previously published framework proposed for assessing clinical prediction ML models. 62 The classification performance of each tuned and calibrated model was assessed using AUC-ROC, average precision (AP), MCC, sensitivity and specificity. Calibration performance was assessed using Brier score, calibration curve slope and calibration curve intercept. Threshold-dependent metrics, including MCC, sensitivity and specificity, were presented for each of the 3 derived classification thresholds. All metrics were first evaluated using 5-fold cross-validation and presented as mean and 95% confidence intervals (CIs). The metrics were then used to evaluate model performance on the held-out internal validation dataset.
In addition to numeric metrics, we presented ROC curves, precision-recall (PR) curves, MCC-threshold plots, and calibration curves for all 3 models during cross-validation and internal validation. For cross-validation, averaged ROC and PR plots were illustrated using vertical averaging. 63 Averaged calibration curves were generated by aligning the individual calibration curves from each cross-validation fold to 5 common bin centres using linear interpolation. 64
Model Explainability
Model explainability for the image-based neural network was assessed via Gradient-weighted Class Activation Mapping (Grad-CAM), 65 which produces a heatmap indicating areas of the image most influential in classification decisions. Model explainability for the clinical data-based neural network was assessed using the permutation importance method for assessing feature importance in black-box models. 66
Model Fairness and Bias
Because previous research has shown reduced performance of dermatology ML models when applied to darker skin types,67,68 and this inconsistent performance is rarely studied in ML investigations, 69 we reported additional internal validation metrics stratified by Fitzpatrick phototypes to assess potential skin type biases. Congruent with previous studies, we categorised the internal validation cases into light skin (Fitzpatrick phototypes I, II or III) and skin of colour (Fitzpatrick phototypes IV, V or VI). 67
Software
Clinical data imputation and train-test split were performed using R. The mice package was used to perform MICE. Model development and testing were completed using Python. Neural network models were built using keras 3.3.3 and tensorflow 2.16.1. 70 BOHB tuning was completed using ray 2.30.0. 71 Model evaluation was performed using scikit-learn 1.5.0. 72 Permutation feature importance was assessed using a custom fork of the eli5 package.
Results
Out of 2298 patient cases from the PAD-UFES-20 dataset, 1089 cases (47.4%) were diagnosed with malignant lesions, and 1209 cases (52.6%) were diagnosed with non-malignant lesions. In terms of skin phototypes, 1421 cases (61.8%) were classified as Fitzpatrick phototypes I, II or III, and 73 cases (3.2%) were classified as Fitzpatrick phototypes IV, V or VI. The remaining cases did not have an associated Fitzpatrick phototype. Detailed patient case characteristics are presented in Table 1. The optimal hyperparameters and thresholds identified are tabulated in Supplemental Tables S4-S6. The full codebase and dataset needed to replicate our findings are available at http://doi.org/10.17632/2yv6rv3pzs.1.
Cross-Validation Performance
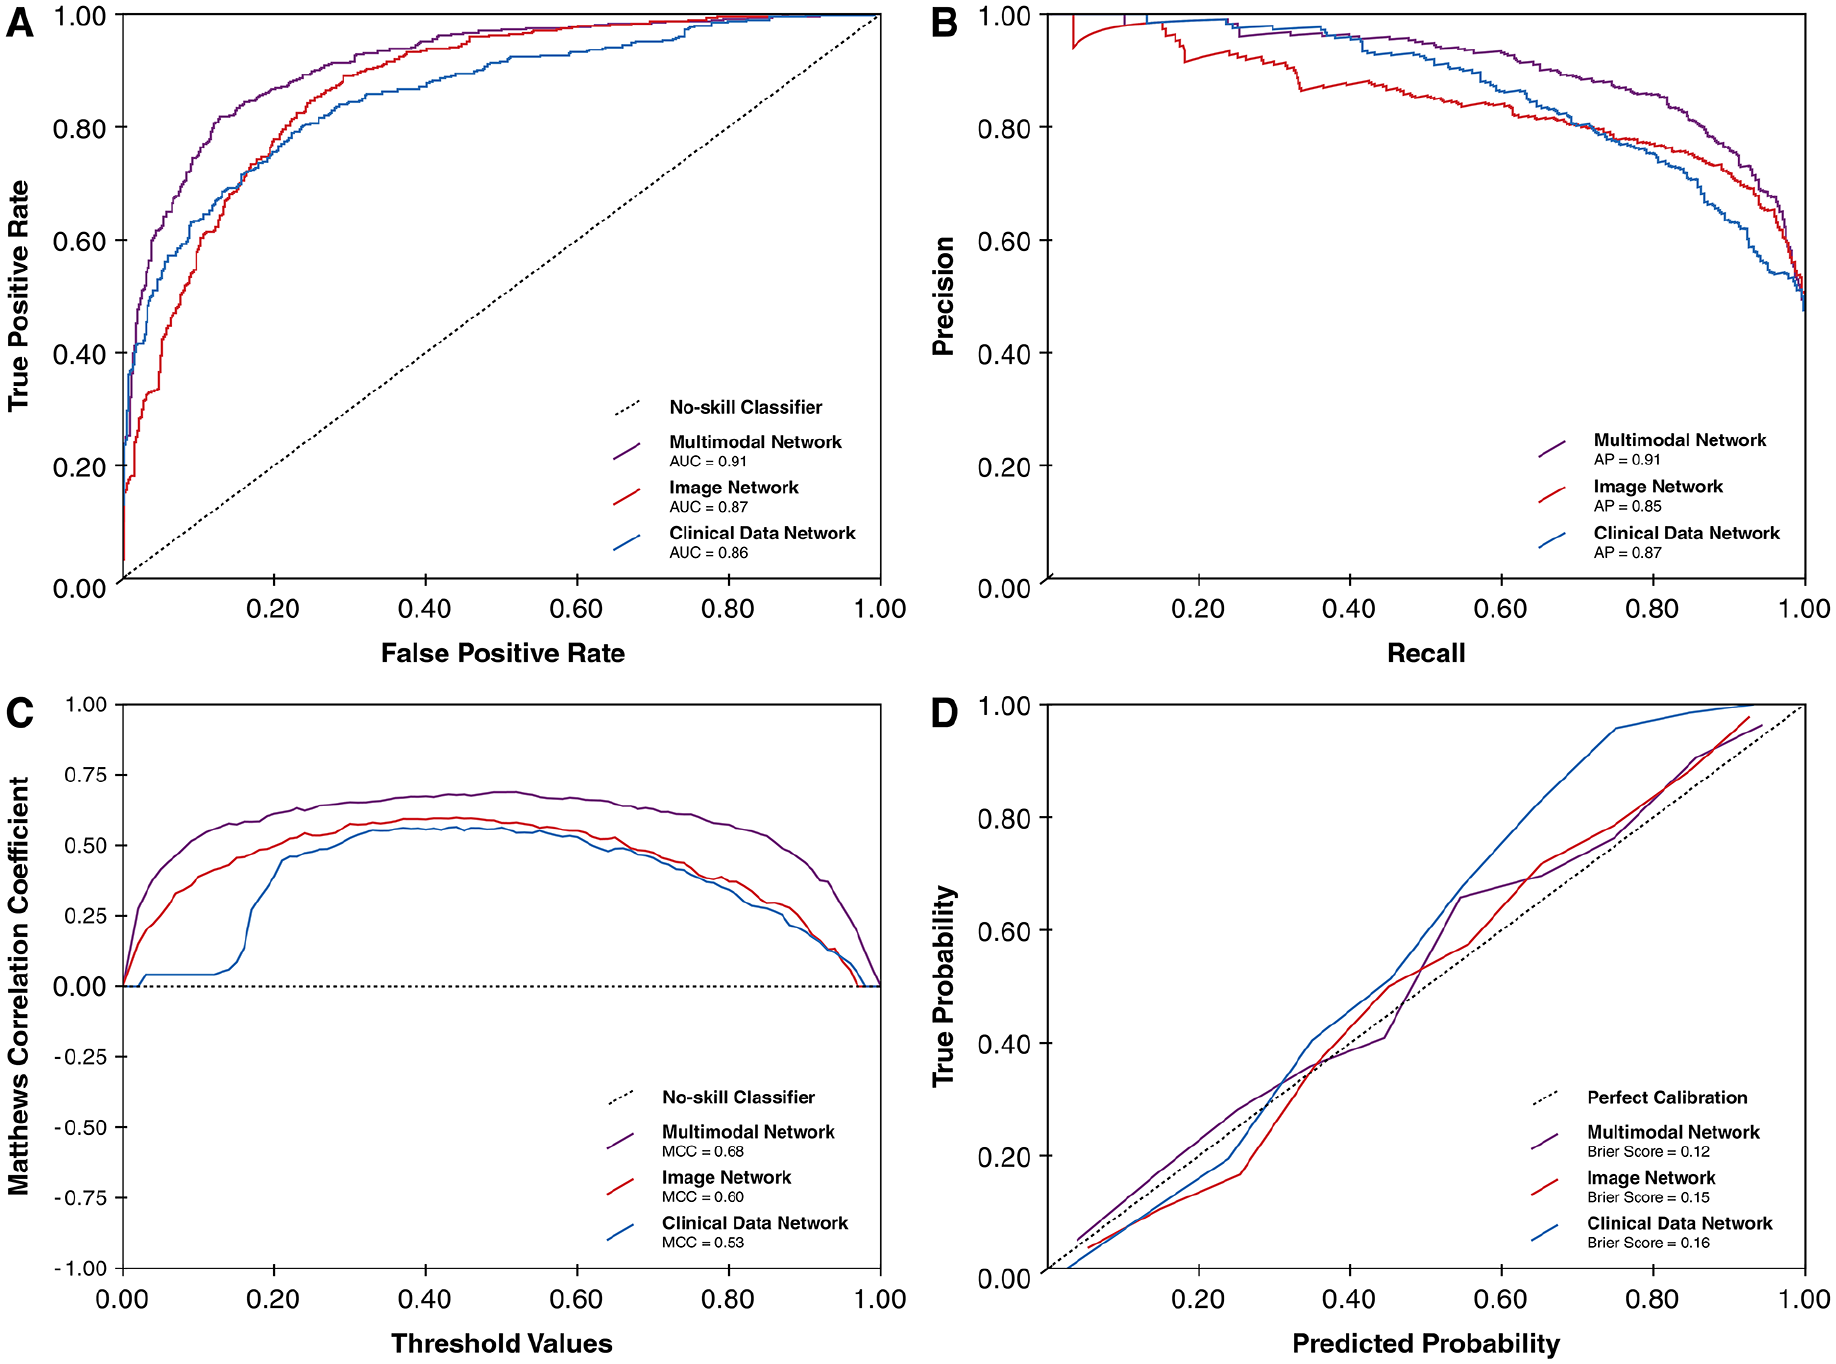
Table 2 and Figure 3 summarise the average performance of the 3 neural networks over 5-fold cross-validation. The image-based neural network outperformed the clinical data-based neural network on all threshold-independent metrics. In turn, the multimodal network outperformed the image-based network on all threshold-independent metrics. When using the balanced threshold, the multimodal network exhibited a slightly higher average MCC compared to the image-based network (0.61, 95% CI 0.47-0.74 vs 0.57, 95% CI 0.53-0.61), indicating better classification performance.
Average performance of neural networks during cross-validation.

Abbreviations: AUC-ROC, area under the receiver operating characteristic curve; MCC, Matthews correlation coefficient.
The performance metrics are tabulated as mean (95% confidence interval).

Performance plots of the 3 network models during 5-fold cross-validation. (A) Average ROC curves. (B) Average PR curves. (C) Average MCC-threshold curves. (D) Average calibration curves.
At both high-sensitivity thresholds (sensitivity ⩾0.90 and ⩾0.95), the threshold-dependent performance metrics from the image-based network were similar to that of the multimodal network. This highlights the robustness of the image-based approach at higher thresholds despite its reliance on a single data modality.
Internal Validation Performance
Table 3 and Figure 4 summarise the average performance of the 3 neural networks on the held-out internal validation subset. Similar to findings during cross-validation, the multimodal network outperformed the other 2 networks on threshold-independent metrics. At the balanced threshold, the multimodal network had higher MCC compared to the image- and clinical data-based networks (0.68 vs 0.60 vs 0.53). Consistent with cross-validation findings, the image-based network had similar threshold-dependent performance metrics as the multimodal network at the high-sensitivity thresholds.
Performance of neural networks during internal validation.

Abbreviations: AUC-ROC, area under the receiver operating characteristic curve; MCC, Matthews correlation coefficient.
Performance plots of the 3 network models during internal validation. (A) ROC curves. (B) PR curves. (C) MCC-threshold curves. (D) Calibration curves.
Performance Stratified by Skin Phototypes
In the held out internal validation set, 631 cases were classified as light skin (ie, Fitzpatrick phototypes I, II or III), and 24 cases were classified as skin of colour (ie, Fitzpatrick phototypes IV, V or VI). Internal validation performance metrics stratified by phototypes are summarised in Supplemental Table S7. Overall, there was no notable decrease in performance associated with darker Fitzpatrick phototypes; in fact, the model yielded better performance metrics in darker phototypes compared to lighter phototypes. However, these results should be interpreted with caution due to the substantial imbalance in sample sizes across phototype subgroups.
Model Explainability
Global explainability for the clinical data-based neural network during internal validation is illustrated in Figure 5. The most influential features identified via permutation importance included lesion bleeding, lesion elevation, patient age and recent lesion growth – clinical factors that align well with established dermatological risk criteria for malignancies.73 -75 This suggests that the model relied on clinically meaningful patterns from the structured clinical data inputs.

Feature importance plot showing permutation importance of the top 10 features in the clinical data-based neural network.
For the image-based neural network, Grad-CAM heatmaps were generated across the internal validation set. Figure 6 displays a representative selection of Grad-CAM examples for each quadrant of the confusion matrix based on the balanced threshold. These examples highlight regions within the input image that most strongly influenced the model’s prediction. Notably, the model consistently focused on the lesioned regions rather than background or artefacts, even in misclassified cases. This pattern suggests the image network was not relying on spurious features and had learned to prioritise relevant morphological features. Grad-CAM visualisations for the entire internal validation dataset are available in our code repository.

Representative examples of Grad-CAM heatmaps for each quadrant of the confusion matrix based on the balanced threshold, generated from the image-based neural network. Four random examples are shown for each quadrant. (A) True positives, (B) true negatives, (C) false positives and (D) false negatives.
Discussion
In this study, we developed and internally validated a transfer learning-based, multimodal neural network for identifying malignant skin lesions using smartphone-captured images and structured clinical data. Compared to standalone image- and clinical data-based neural networks, the multimodal model showed superior discriminative ability and calibration in both cross-validation and internal validation. These findings indicate that combining clinical variables with image features may yield more robust classification models.
Notably, at the high-sensitivity thresholds relevant for primary care triage (ie, sensitivity ⩾0.90 or ⩾0.95), the image-only model performed comparably to the multimodal model during cross-validation and internal validation. A plausible explanation is that these thresholds provide generous tolerance for false positives, which allows the networks to classify lesions with even modest malignant probabilities as cancerous. Although the multimodal model can adjust probability estimates based on clinical context, these adjustments are often sufficient to shift cases beyond such lenient thresholds, thus both networks produce nearly identical predictions. When the threshold aims to balance sensitivity and specificity, the added clinical context is sufficient to improve classification of borderline cases, allowing the multimodal model to outperform the image-based model. While both models may be adequate for triage purposes in primary care settings, the multimodal network’s consistent advantage in threshold-independent metrics such as AUC-ROC and AP, along with better calibration, suggests that integrating image and clinical data enhances the model’s robustness and reliability across a wider range of clinical scenarios and decision thresholds.
Our results compare favourably with existing literature. Prior unimodal models typically report AUC-ROC values ranging from 0.87 to 0.96 on curated dermoscopic datasets.12,14 Our multimodal model achieved similar or higher AUC-ROC scores during internal validation on smartphone images, despite the more variable and less standardised imaging conditions. Multimodal integration may therefore help mitigate quality limitations inherent to consumer-grade photographs.
Importantly, our findings also compare favourably with human diagnostic accuracy in primary care. Ojeda and Graells reported that primary care physicians demonstrated a sensitivity of 0.45 and specificity of 0.16 in identifying malignant skin lesions, compared to 0.97 and 0.75 for dermatologists. 76 A systematic review by Chen et al reported a sensitivity of 0.70 to 0.88 and specificity of 0.70 to 0.87 among primary care providers, compared to 0.81 to 1.00 and 0.70 to 0.89 for dermatologists. 77 These comparisons suggest that, at least in silico, our models may deliver decision support performance that exceeds the average diagnostic ability of primary care clinicians, though this must be confirmed in further head-to-head studies.
From a real-world implementation perspective, eventhough training deep-learning neural networks such as DenseNet-121 is computationally intensive – even with transfer learning and efficient tuning techniques such as BOHB – inference, which is the act of making predictions on new images after training, requires orders of magnitude fewer resources. It would be possible to develop a mobile application centred around our multimodal model that captures lesion photographs and presents a questionnaire to collect clinical data to generate ML-powered predictions. This application could be deployed on smartphones, tablets or web platforms, facilitated by lightweight frameworks designed for edge devices such as TensorFlow Lite/LiteRT. Grad-CAM visualisations could provide local explainability on a case-by-case basis, which could help improve model transparency and user trust.
Limitations
There are several important limitations that must be acknowledged. While the PAD-UFES-20 dataset includes a diverse range of lesion types and patient cases, it was collected from a single country and contains a disproportionately small number of patients with darker Fitzpatrick phototypes. Although our subgroup analyses did not show performance degradation in these groups, the small sample size limits our ability to draw firm conclusions about model generalisability across different skin tones. Moreover, only malignant lesions in the dataset underwent biopsy confirmation, which introduces a risk of verification bias. The clinical dataset also contained missing values, which required imputation that may have reduced the informativeness of certain features.
The lack of external validation represents another critical limitation. Because very few publicly available datasets contain diverse, smartphone-captured skin lesion images linked to structured clinical data, we were unable to assess model generalisability on an independent cohort. The multimodal nature of our model poses practical challenges for future data collection and validation, as it requires not only image data but also detailed clinical information which may be difficult to acquire and organise at scale. Regardless, proper external validation using an unrelated dataset remains essential before deployment in real-world clinical settings.
Future Directions
As with other ML models, the performance of our models ultimately depends on the quantity and diversity of available training data. To improve predictive performance and ensure generalisability across populations and practice environments, future efforts should prioritise multicentre and international data collection initiatives. Approaches such as decentralised, federated learning may offer a feasible path forward by allowing training on distributed datasets without the need to centralise sensitive patient information. 78
Lastly, classification models such as those described in this study are fundamentally application-oriented tools. Their value depends not only on statistical performance but on real-world effectiveness – how they influence clinical decision-making, improve triage accuracy and reduce diagnostic delays. To evaluate these endpoints, future work will involve prospective testing and deployment studies in primary care settings, using methodologies such as shadow-testing or randomised controlled trials. We are actively pursuing these next steps and have open-sourced our codebase to support further development, replication and adaptation by other groups.
Conclusion
This study demonstrates that a transfer learning-based, multimodal neural network can effectively identify malignant skin lesions by integrating structured clinical data with smartphone-captured lesion images. To ensure broad generalisability and clinical applicability, the model must undergo external validation on larger, more diverse datasets. Our findings advocate for collaborative, multicentre efforts and the utilisation of decentralised learning frameworks to advance the development and deployment of ML-driven diagnostic tools in dermatology.
Supplemental Material
sj-pdf-1-cix-10.1177_11769351251349891 – Supplemental material for Development of a Transfer Learning-Based, Multimodal Neural Network for Identifying Malignant Dermatological Lesions From Smartphone Images
Supplemental material, sj-pdf-1-cix-10.1177_11769351251349891 for Development of a Transfer Learning-Based, Multimodal Neural Network for Identifying Malignant Dermatological Lesions From Smartphone Images by Jiawen Deng, Eddie Guo, Heather Jianbo Zhao, Kaden Venugopal and Myron Moskalyk in Cancer Informatics
Footnotes
Acknowledgements
We would like to thank the Programa de Assistência Dermatológica e Cirúrgica at the Federal University of Espírito Santo and the Nature Inspired Computing Laboratory for developing the PAD-UFES-20 dataset and making it available for our model development.
Author Note
Preliminary results from this study were presented at the 2025 Canadian Dermatology Association (CDA) Annual Conference in Halifax, Nova Scotia, Canada.
Ethical Considerations
This study only involves secondary analyses of publicly available, anonymous patient data with no identifiable information. Thus, this study is exempt from ethics review as determined by the Unity Health Toronto Research Ethics Board under the guidance of The Tri-Council Policy Statement: Ethical Conduct for Research Involving Humans (TCPS 2).
Author Contributions
Jiawen Deng conceptualised and supervised the study, performed data retrieval and management, lead coding, model development and validation efforts, created the illustrations, and drafted the manuscript. Eddie Guo performed code validation and review, drafted the manuscript and made intellectually important manuscript edits. Heather Jianbo Zhao was involved in data retrieval and management, drafted the manuscript and made intellectually important manuscript edits. Kaden Venugopal was involved in data retrieval and management and made intellectually important manuscript edits. Myron Moskalyk performed code validation and review, drafted the manuscript and made intellectually important manuscript edits. All authors agree to be held accountable for all aspects of the work in ensuring that questions related to the accuracy or integrity of any part of the work are appropriately investigated and resolved, and all authors give final approval for the manuscript to be submitted and published in its current state.
Funding
The author(s) disclosed receipt of the following financial support for the research, authorship, and/or publication of this article: This research received no specific grant from any funding agency in the public, commercial, or not-for-profit sectors.
Declaration of Conflicting Interests
The author(s) declared the following potential conflicts of interest with respect to the research, authorship, and/or publication of this article: Jiawen Deng is a member of the OpenAI Researcher Access Program and receives grants from OpenAI in the form of API credits for purposes of research involving large language models. Eddie Guo, Heather Jianbo Zhao, Kaden Venugopal and Myron Moskalyk report no conflict of interest.
Data Availability Statement
The full codebase and dataset needed to replicate our findings is available at http://doi.org/10.17632/2yv6rv3pzs.1.
Supplemental Material
Supplemental material for this article is available online.
References
Supplementary Material
Please find the following supplemental material available below.
For Open Access articles published under a Creative Commons License, all supplemental material carries the same license as the article it is associated with.
For non-Open Access articles published, all supplemental material carries a non-exclusive license, and permission requests for re-use of supplemental material or any part of supplemental material shall be sent directly to the copyright owner as specified in the copyright notice associated with the article.