
Abstract
Objectives:
Emerging evidence suggests that N6-methyladenosine (m6A) methylation plays a critical role in cancers through various mechanisms. This work aims to reveal the essential role of m6A methylation “readers” in regulation of cancer prognosis at the pan-cancer level.
Methods:
Herein, we focused on one special protein family of the “readers” of m6A methylation, YT521-B homology (YTH) domain family genes, which were observed to be frequently dysregulated in tumor tissues and closely associated with cancer prognosis. Then, a comprehensive analysis of modulation in cancer prognosis was conducted by integrating RNA sequencing (RNAseq) datasets of YTH family genes and clinical information at the pan-cancer level.
Results:
YTH family genes were significantly differentially expressed in most of the cancers, particularly increased in Gastrointestinal cancers, and decreased in Endocrine and Urologic cancers. In addition, they were observed to be associated with overall survival (OS) and disease-specific survival (DSS) with various extent, especially in lower grade glioma (LGG), thyroid cancer (THCA), liver hepatocellular carcinoma (LIHC) and kidney clear cell carcinoma (KIRC), so were some “writers” (METLL3, METLL14, WTAP) and “erasers” (FTO, ALKBH5). Further survival analysis illustrated that YTH family genes specifically YTHScore constructed by combining 5 YTH family genes, as well as RWEScore calculated by combining genes from “readers”-“writers”-“erasers” could dramatically distinguish tumor prognosis in 4 representative cancers. As expected, YTHScore presented an equally comparable prognostic classification with RWEScore. Finally, analysis of immune signatures and clinical characteristics implied that, the activity of the innate immune, diagnostic age, clinical stage, Tumor-Node-Metastasis (TNM) stage and immune types, might play specific roles in modulating tumor prognosis.
Conclusions:
The study demonstrated that YTH family genes had the potential to predict tumor prognosis, in which the YTHScore illustrated equal ability to predict tumor prognosis compared to RWEScore, thus providing insights into prognostic biomarkers and therapeutic targets at the pan-cancer level.
Introduction
Till now, RNA modification has gathered tremendous scientific interest, 1 and various modifications have been discovered with the improvement of RNA immunoprecipitation. 2 Among them, N6-methyladenosine (m6A) methylation, the most abundant internal RNA modification in eukaryotic cells, 3 was reported to execute crucial roles in embryonic development, neurogenesis, circadian rhythm, stress responses, sex determination and tumorigenesis, etc.4 -6 Furthermore, emerging evidence has indicated that m6A methylation is closely associated with tumor initiation and progression, 7 providing novel insights and possibilities for the early diagnosis and treatment of cancers, 4 and is expected to be a new target for anti-cancer therapy. 8
The RNA m6A methylation contains 3 elements, including “writers,” “erasers,” and “readers.” These 3 types of regulatory proteins are often dysregulated in cancers. 9 By regulating various of downstream molecules and signaling pathways, they play roles in promoting and/or suppressing cancer, affecting cancer progression and patient prognosis.10,11 The “writers” mainly participated in promoting methylation, such as METTL3, METTL14, and WTAP. The “erasers” are demethylases, such as FTO and ALKBH5. The “readers” are m6A binding proteins and can be classified into 3 groups, including YTH domain family members which are further divided as YTHDC1–2 and YTHDF1–3, insulin-like growth factor 2 mRNA binding proteins (IGF2BP1–3), and the “royal family” protein SND1. 7 Among them, YTH domain family proteins have been testified to maintain highly conversed m6A-binding domain and preferentially bind to m6A-modified RNA on the RRm6ACH consensus sequence, 12 and participated in mRNA metabolism including mRNA splicing, nuclear export, translation, and mRNA degradation.13,14 Accordingly, YTH domain family genes exert important effects on physiological processes, infectious diseases, and cancers. 15
Recently, emerging evidence has indicated that YTH domain family genes are empowered to be associated with tumorigenesis, progression, as well as prognosis. For example, as reported, YTHDC1-mediated stimulation of miR-30d inhibited pancreatic tumorigenesis by inhibiting RunX1-induced transcriptional activation of Warburg effect. 16 Besides, the upregulation of YTHDC2 in human colon tissue was shown to be positively associated with tumor metastasis. 17 Moreover, YTHDF1 was reported to be highly expressed in human colon and gastric cancer tissues, contributing to poor patient prognosis.18,19 Also, YTHDF2 enhanced OCT4 mRNA translation in an m6A-dependent manner, thereby promoting the liver cancer stem cell phenotype and cancer metastasis. 20 Besides, YTHDF2 could stimulate tumorigenesis by accelerating the degradation of tumor suppressor ensemble domain 7 (SETD7) mRNA and Kruppel-like factor 4 (KLF4) mRNA in bladder cancer. 21 Furthermore, YTHDF3 could also promote the growth and progression of bladder tumors by recognizing the m6A-modified integrin subunit α6 (ITGA6) mRNA and facilitating its translation. 22
However, current investigations on YTH domain family genes mostly focus on single or limited gene combinations at the individual tumor level, potentially ignoring their integrated effects and distinct prognostic regulatory patterns. 23 In fact, the YTH domain family genes are prone to mediate tumor progression and prognosis by interacting with each other, rather than playing a role alone. 24 Besides, systematic studies on the expression and prognostic regulations of the YTH gene family in the pan-cancer context remain insufficient. 25 The detection of prognostic regulatory patterns of YTH family genes at the pan-cancer level could help reveal commonalities and heterogeneity mechanisms underlying different cancers, providing theoretical support for the formulation of broader treatment approaches and personalized treatment strategies. 26 Therefore, it is important to evaluate the association of YTH family genes with pan-cancer at the genetic level.
In this study, we performed systematic research based on The Cancer Genome Atlas (TCGA) database to explore the relationship between the YTH family genes and the clinical prognosis at the pan-cancer level. Furthermore, we explored the possible immune and clinical characteristics underlying cancer prognosis, highlighting the functional importance of YTH family genes in tumor prognosis regulation and cancer biology at the pan-cancer level.
Methods
Data source
The YTH gene expression profiles of pan-cancer, as well as the clinical information of corresponding tumors, were obtained from the TCGA Pan-cancer module of Active Data Hubs in the UCSC Xena platform (http://xena.ucsc.edu/). 27 For each sample, gene expression profiles containing 22 types of tumors were derived from RNAseq datasets of TOIL RSEM tpm module, and presented by log-transformed tpm values plus 0.001, in which 10 535 samples with 60 499 gene identifiers were obtained. The clinical information including OS, DSS, age at initial pathologic diagnosis, gender, clinical stage, etc., was derived from the Curated clinical data module in the TCGA pan-cancer datasets of the UCSC Xena platform. Moreover, the immune types for each sample were acquired from the Immune Subtype module.
Here, we pre-processed the gene expression profiles by mapping with ID/Gene Mapping files downloaded from the TOIL RSEM tpm module in the TCGA pan-cancer datasets. Sample IDs were matched to their cancer types, and YTH domain family genes including YTHDC1, YTHDC2, YTHDF1, YTHDF2, and YTHDF3 were selected from the original gene expression profiles to construct the final 8886 samples dataset. The numbers of normal and tumor samples in each cancer type were shown in Figure 1a.

The sample distribution and YTH family gene expression among pan-cancer. (a) The sample distribution of pan-cancer; (b) The P-values and fold changes (FCs) of YTH family genes in pan-cancer; The violin plot of (c) YTHDC1; (d) YTHDC2; (e) YTHDF1; (f) YTHDF2; (g) YTHDF3 in pan-cancer. P-values were calculated by Wilcoxon test. “-”: no significance; “*”: P < .05; “**”: P < .01; “***”: P < .001; “****”: P < .0001. The logFC value greater than 0 (red) indicates high expressions, and less than 0 (blue) indicates low expressions. The logFC value greater than 1 showed dramatic up-regulation, and less than −1 showed dramatic down-regulation.
Detecting expression patterns of YTH domain family genes
To identify the expression patterns of YTH genes among pan-cancers, the samples in each cancer type were divided into the tumor and normal ones by the TCGA sample nomenclature. Then Wilcoxon tests and fold change (FC) values were then used to evaluate the differential expression patterns of YTH genes between their corresponding tumor and normal samples. The YTH genes in each cancer type with the P-values less than .05 and the absolute log-transformed FC value (log2FC) larger than 1 were considered as differentially expressed, where log2FC less than −1 was regarded as dramatically down-regulated and log2FC larger than 1 showed up-regulation patterns. Here, for each of the 22 cancers, the bioinformatic analysis was produced separately and parallelly.
To present the differential expression patterns of YTH family genes among different cancer types, the heatmap presenting the P-values and FC values among the 22 cancer types, as well as the Violin plot of each YTH gene in every cancer type were performed by SangerBox 28 in http://sangerbox.com/.
Prognosis Association and survival analysis of YTH genes among pan-cancer
To illustrate the association of the YTH gene with cancer prognosis, we adopted a univariate cox proportional hazards (Cox PH) regression model 29 to analyze the effect of each gene in the YTH family on cancer prognosis, and to characterize whether it is an independent prognostic factor by the Log-rank test. 30 Herein, samples markered with “NA” and identified as normal tissue by the TCGA sample nomenclature were filtered. Further, we resolved this result by forest plotting by SangerBox 28 in http://sangerbox.com/. Here, OS and DSS were considered as the main evaluator of cancer prognosis.
Through the above association analysis of YTH genes and cancer prognosis, we detected the cancers, where YTH genes were generally significantly associated with prognosis from several major categories, and further adopted the survival analysis to analyze the effect of YTH gene expression on cancer prognosis. Particularly, the multivariate Cox PH regression model for each cancer was introduced to calculate a YTHScore for each sample, through the association coefficients between survival time and YTH gene expression, which characterized the overall effect of YTH gene on cancer prognosis. Further, surv_cutpoint function in the survminer package of R language 31 was performed to calculate the optimal grouped cutoff for the 5 genes in the YTH family and YTHScore. Furthermore, by combining with the survival package, 32 Kaplan–Meier (KM) survival curves of each feature among different cancer types were drawn to illustrate the potential influence of YTH gene on cancer prognosis. Here, the log-rank test 30 was executed to evaluate the statistical significance where P-value < .05 was considered statistically significant.
Immune signature analysis of different prognostic groups among pan-cancer
Immune cells may contribute to cancer prognosis. Here, the proportions of immune cells were calculated by CIBERSORT tools 33 between different prognostic sample groups divided by YTHScore. The distribution pattern of immune cell proportion in different samples was demonstrated by the pheatmap package in the R language. 34 Further, for immune cells that play an important role in innate immunity as well as acquired immunity, their fraction patterns in different groups among cancers were elucidated by the ggpubr package, 35 and statistical significance was assessed by the Wilcoxon test.
Detection of clinical features on different prognostic groups among pan-cancer
In this study, clinical features of each cancer type were compared between different prognostic sample groups divided by YTHScore, including age, gender, T stage, N stage, M stage, clinical stage, and immune subtype, which might play an essential role in the cancer prognosis. Here, the distribution pattern of clinical features in different sample groups was exhibited by pheatmap package in R language. 34 Particularly, the values of clinical features in different YTHScore groups were presented by bar plots with ggplot2 package in R language. 36
Results
YTH family genes are generally differentially expressed in Pan-Cancer
To explore the characteristics of m6A “readers” YTH domain family in pan-cancer progression, RNA expression of YTHDC1, YTHDC2, YTHDF1, YTHDF2, and YTHDF3, accompanied by corresponding clinical information, were driven from the TCGA module of UCSC Xena platform (http://xena.ucsc.edu/). Here, 22 types of cancers were involved in this study, which include central nervous system (CNS) cancer (glioblastoma [GBM], lower grade glioma [LGG]), Head and neck cancer (head and neck cancer [HNSC]), Endocrine cancer (thyroid cancer [THCA]), Neural-crest-derived tissue cancer (pheochromocytoma and paraganglioma [PCPG]), Thoracic cancer (lung adenocarcinoma [LUAD], lung squamous cell carcinoma [LUSC]), Core Gastrointestinal cancer (esophageal carcinoma [ESCA], colon adenocarcinoma [COAD], stomach adenocarcinoma [STAD], and rectum adenocarcinoma [READ]), Development Gastrointestinal cancer (liver hepatocellular carcinoma [LIHC], cholangiocarcinoma [CHOL], pancreatic adenocarcinoma [PAAD]), Gynecologic cancer (endometrioid cancer [UCEC], cervical cancer [CESC], breast cancer [BRCA]), Urologic cancer (prostate cancer [PRAD], bladder cancer [BLCA], kidney papillary cell carcinoma [KIRP], kidney clear cell carcinoma [KIRC], kidney chromophobe [KICH]). 37 In general, a total of 8886 TCGA samples with YTH family gene expression profiles were collected here, and the corresponding tumor and normal sample numbers for each cancer type were illustrated in Figure 1a. The sample size for 22 cancer types ranged from 45 for CHOL to 1205 for BRCA, respectively (Supplemental Table S1).
The differential expression pattern of YTH family gene among pan-cancer was shown in Figure 1b to g, which was evaluated by each cancer type. Results showed that YTH family genes were significantly differentially expressed in most of the cancers. Particularly, most YTH genes displayed low expression patterns in Endocrine and Urologic cancers, but high expression patterns in Gastrointestinal cancers when compared with corresponding normal samples. On the other hand, YTH genes showed staggered patterns with high and low expression in Gynecologic, CNS, Head and Neck, Neural-crest derived tissue, and Thoracic system cancer (Figure 1b and Supplemental Table S2). Similar to the results of YTH family genes, we found that the selected “writers” (METTL3, METTL14, WTAP) and “erasers” (FTO, ALKBH5) exhibited differential expression patterns in most tumor samples among pan-cancer level, with low expression tendency in Endocrine, Gynecologic, and Urologic cancers, but high expression patterns in Gastrointestinal cancers (Supplemental Figure S1). Unfortunately, YTH family genes as well as “writers” and “erasers” failed to illustrate dramatic up or down regulations among different cancers.
Notably, YTHDC1 was significantly differentially expressed in 14 of 22 cancers, such as lowly expressed in Endocrine cancer (THCA), one Thoracic cancer (LUAD), some Gynecologic cancer (UCEC, CESC), and Urologic cancer (PRAD, BLCA, KIRP, KICH), while highly expressed in Head and neck cancer (HNSC), and most Gastrointestinal cancers (ESCA, COAD, STAD, LIHC, CHOL; Figure 1b and c). In YTHDC2, only 9 of 22 cancers showed significantly expressed patterns, where one CNS cancer (GBM), Endocrine cancer (THCA), one Thoracic cancer (LUSC), and partial Urologic cancer (KIRP, KICH) exhibited low expression, whereas most Gastrointestinal cancers (STAD, LIHC, CHOL) and one Urologic cancer (KIRC) displayed high expression versus corresponding normal samples (Figure 1b and d). Besides, YTHDF1 was significantly expressed in 20 cancers, such as highly expressed in CNS cancers (GBM, LGG), Head and Neck cancer (HNSC), Neural-crest derived tissue cancer (PCPG), Thoracic cancer (LUSC, LUAD), most Gastrointestinal cancer (ESCA, COAD, STAD, READ, LIHC, CHOL), most Gynecologic cancer (UCEC, CESC), and partial Urologic cancer (PRAD, BLCA, KIRP). In contrast, cancers with low YTHDF1 expression only included Endocrine cancer (THCA), and partial Urologic cancer (KIRC, KICH; Figure 1b and e). As for YTHDF2, 15 of 22 cancers showed significantly expressed patterns, such as Endocrine cancer (THCA), and partial Urologic cancer (KIRP, KIRC, KICH) illustrated low expressions patterns, while Head and neck cancer (HNSC), one Thoracic cancer (LUAD), most Gastrointestinal cancers (ESCA, COAD, STAD, READ, LIHC, CHOL), most Gynecologic cancer (UCEC, BRCA), and one Urologic cancer (BLCA) elucidated high expression patterns (Figure 1b and f). Similarly, YTHDF3 tended to be lowly expressed in Endocrine cancer (THCA), one Gastrointestinal cancer (COAD), one Gynecologic cancer (UCEC) and partial Urologic cancer (BLCA, KIRP, KICH), whereas highly expressed in Head and neck cancer (HNSC), and most Gastrointestinal cancers (ESCA, STAD, LIHC, CHOL), etc (Figure 1b and g).
Together, YTH family genes as well as “writers” and “erasers” were prone to be significantly lowly expressed in Endocrine cancers and Urologic cancers, while highly expressed in Gastrointestinal cancers, illustrating their potential role in the regulation of tumor progressions.
YTH family genes are associated with tumor prognosis in pan-cancer
To detect the potential role in tumor prognosis, we used the univariate Cox PH regression model to assess the relationship between YTH family gene and survival time among pan-cancer. Results in Figure 2 illustrated the association of YTH family gene and tumor OS in pan-cancer. For YTHDC1, it could only significantly affect the prognosis of KIRC in Urologic cancer (P-value: 9.10E-05) with the hazard ratio (HR) of 0.69 (95% Confidence Interval [CI]: 0.58-0.83; Figure 2a). Among 22 cancers, YTHDC2 was the prognosis protective factor for Gastrointestinal cancer including COAD (P-value: .04; HR: 0.65; 95%CI: 0.43-0.99) and READ (P-value: 6.30E-03; HR: 0.47; 95%CI: 0.27-0.81), and Urologic cancer including KIRC (P-value: 4.60E-03; HR: 0.78; 95%CI: 0.65-0.92). Whereas high expression of YTHDC2 illustrated poor prognosis of one CNS cancer (LGG) with HR of 1.82 (P-value: 1.20E-03; 95%CI: 1.27-2.61), and Endocrine cancer (THCA) with HR of 3.00 (P-value: .05; 95%CI: 1.04-8.68; Figure 2b).

The forest plot of YTH family genes in overall survival (OS) by univariate Cox PH regression analysis in pan-cancer. The forest plot of (a) YTHDC1; (b) YTHDC2; (c) YTHDF1; (d) YTHDF2; (e) YTHDF3 in pan-cancer; (f) The summary results of univariate Cox PH regression analysis of YTH gene in pan-cancer. P-values were calculated by log-rank test. P < .05 represents statistically significant.
Also, YTHDF1 was the independent prognosis effect factor for one Gastrointestinal cancer (READ; P-value: .04; HR: 0.46; 95%CI: 0.22-0.98), and one Urologic cancer (KIRC; P-value: .05; HR: 0.74; 95%CI: 0.55-1.00), in which high expression of YTHDF1 indicated good prognosis. For CNS cancers (LGG; P-value: 2.10E-05; HR: 2.86; 95%CI: 1.77-4.62), Endocrine cancer (THCA; P-value: .01; HR: 5.03; 95%CI: 1.49-16.92), Gastrointestinal cancer (LIHC; P-value: 8.30E-05; HR: 1.94; 95%CI: 1.39-2.70), and Gynecologic cancer (BRCA; P-value: .05; HR: 1.32; 95%CI: 1.00-1.73), YTHDF1 appeared to be a risk factor for cancer prognosis (Figure 2c). Similarly, YTHDF2 significantly affected the prognosis of one CNS cancer (LGG; P-value: 2.00E-057; HR: 2.91; 95%CI: 1.94-4.37), one Gastrointestinal cancer (LIHC; P-value: 7.40E-05; HR: 1.95; 95%CI: 1.40-2.71), Gynecologic cancer (UCEC; P-value: .03; HR: 0.61; 95%CI: 0.38-0.96), and Urologic cancers including KIRC (P-value: 1.8E-04; HR: 0.61; 95%CI: 0.47-0.79) and KICH (P-value: 6.20E-03; HR: 11.12; 95%CI: 2.30-53.71; Figure 2d). Moreover, YTHDF3 was the protective factor for cancer prognosis in Urologic cancer of KIRC (P-value: 2.60E-04; HR: 0.69; 95%CI: 0.57-0.84), and the risk factor for CNS cancer of LGG (P-value: .02; HR: 1.58; 95%CI: 1.07-2.32), Endocrine cancer (THCA; P-value: .02; HR: 3.27; 95%CI: 1.17-9.12), Gynecologic cancer of BRCA (P-value: 8.80E-03; HR: 1.32; 95%CI: 1.07-1.62), and Urologic cancer of KICH (P-value: .04; HR: 4.05; 95%CI: 1.09-15.05; Figure 2e).
Besides, association results of “writers” (METLL3, METLL14, and WTAP) and “erasers” (FTO and ALKBH5) with OS illustrated their distinct regulation roles in tumor prognosis compared with “readers” (Supplemental Figure S2). Specifically, METTL3 was an independent prognostic risk factor for LIHC and KICH, while a protective factor for PAAD with significant statistics (Supplemental FigureS2a and S2f). METTL14 significantly affected the OS of LGG and CESC as a risk factor, while READ and KIRC as a protective factor (Supplemental Figure S2b and S2f). WTAP dramatically exhibited as a risk factor for LGG, LIHC and CESC (Supplemental Figure S2c and S2f). In the “erasers” of m6A methylation, high expression of FTO led to poor prognosis of STAD and BLCA, whereas resulted in a prolonged prognosis of KIRC (Supplemental Figure S2d and S2f). ALKBH5 was significantly associated with 7 cancers, of which it was a risk factor for 5 cancers (GBM, LGG, THCA, BLCA, KICH), and a protective factor for 2 cancers (ESCA and PAAD; Supplemental Figure S2e and S2f). Above results indicated that most of the “writers” and “erasers” could affect the OS of LGG, which was consistent with the function of “readers.” Inversely, most of the “readers” were prone to be related with the OS of KIRC, THCA, LIHC, etc, while “writers” were tended to affect the prognosis of LIHC and CESC, and “erasers” mostly regulated the prognosis of BLCA.
Similar results were obtained for the association analysis between DSS and YTH family genes (Supplemental Figure S3). Collectively, YTHDC1 only significantly affected the OS and DSS in Urologic cancer of KIRC (Figure 2a and f, Supplemental Figure S3a and S3f). Also, YTHDC2 was the independent prognosis factor for OS of CNS cancer (LGG), Endocrine cancer (THCA), Gastrointestinal cancer (COAD, READ), and Urologic cancer of KIRC (Figure 2b and f), while it affected the DSS of LGG and KIRC (Supplemental Figure S3b and S3f). Moreover, YTHDF1 was the OS protective factor for Gynecologic cancer of READ and Urologic cancer of KIRC, and the prognosis risk factor for CNS cancers of LGG, Endocrine cancer of THCA, Gastrointestinal cancer of LIHC, and Gynecologic cancer of BRCA (Figure 2c and f). For DSS, YTHDF1 affected the prognosis of LGG, THCA, LUSC, LIHC and KIRC (Supplemental Figure S3c and S3f). Also, YTHDF2 significantly influenced the OS and DSS in CNS cancer of LGG, Gastrointestinal cancer of LIHC, Gynecologic cancer of UCEC, and Urologic cancer including KIRC and KICH (Figure 2d and f, Supplemental Figure S3d and S3f). Moreover, YTHDF3 was the independent prognosis factor for OS of CNS cancer (LGG), Endocrine cancer (THCA), Gynecologic cancer (BRCA), and Urologic cancer including KIRC and KICH (Figure 2e and f), also significantly associated with DSS in Urologic cancer of PRAD. Whereas YTHDF3 simultaneously affected the OS and DSS of LGG and KIRC, and was observed to be OS risk factors for THCA and BRCA, as well as OS protective factor for KIRC (Supplemental Figure S3e and S3f).
Supplemental Figure S4 shows the relationship of “writers” and “erasers” with DSS. Results illustrated that METTL3 was the risk factor for the prognosis of PCPG, LIHC and KICH (Supplemental Figure S4a and S4f). Also, high expression of METTL14 was correlated with poor prognosis of LGG and LUSC, while good prognosis of READ and KIRC (Supplemental Figure S4b and S4f). Meanwhile, WTAP could significantly affect the prognosis of LGG, LIHC and KIRC (Supplemental Figure S4c and S4f). FTO was the risk factor for the prognosis of LUSC, STAD and BLCA, while the protective factor for KIRC (Supplemental Figure S4d and S4f). ALKBH5 significantly regulated the DSS of GBM, LGG, BLCA, KICH as a risk factor, while regulated KIRC as a protective factor (Supplemental Figure S4e and S4f). Above results illustrated that most of the “readers,” “writers” and “erasers” were associated with the prognosis of LGG and KIRC. Together, we detected 4 representative cancers with significant impacts of YTH family genes on prognosis from several major types of cancer, including CNS cancers of LGG, Endocrine cancer of THCA, Gastrointestinal cancer of LIHC, and Urologic cancer of KIRC for subsequent analysis.
YTHScore constructed by YTH family genes can distinguish tumor prognosis
To further examine how the expressions of YTH family genes affect the cancer prognosis, we performed KM survival curve analysis of YTH family genes for 4 cancers including LGG, THCA, LIHC, and KIRC. Here, the best group cutoff of each YTH gene was obtained for sample classification of corresponding cancers (see Methods), which were shown in Table S3. Results of OS analysis in Supplemental Figure S5 showed that YTHDC1 could significantly differentiate the prognosis in LGG (Log-rank test: P-value = .0079), LIHC (Log-rank test: P-value = .0018) and KIRC (Log-rank test: P-value < .0001), while failing to distinguish the survival curves of 2 groups in THCA (Log-rank test: P-value = .099). Notably, high expression of YTHDC1 was prone to prolong the survival time of LGG and KIRC, whereas decreased the survival time of LIHC (Supplemental Figure S5a-S5d). As for YTHDC2, low expression significantly improved the prognosis of LGG (Log-rank test: P-value < .0001) and THCA (Log-rank test: P-value = .006), while shortening the survival time of KIRC (Log-rank test: P-value = .00021; Supplemental Figure S5e-S5h). Interestingly, YTHDF1 (Supplemental Figure S5i-S5l), YTHDF2 (Supplemental Figure S5m-S5p), and YTHDF3 (Supplemental Figure S5q-S5t) were all able to significantly differentiate the prognosis of these 4 cancers, in which low expression significantly increased the survival time of LGG (Supplemental Figure S5i, S5m, and S5q), THCA (Supplemental Figure S5j, S5n, and S5r), and LIHC (Supplemental Figure S5k, S5o, and S5s), while decreased the survival time of KIRC (Supplemental Figure S5l, S5p, and S5t). Survival analysis of “writers” and “erasers” in Supplemental Figure S6 showed that, METTL3 could significantly distinguish the OS of LIHC (P < .0001), in which low expression contributed to prolonged survival time, rather than the other 3 cancers of LGG, THCA and KIRC (Supplemental Figure S6a). Conversely, METTL14 and ALKBH5 participated in an essential role in regulating the prognosis of 4 of 3 cancers including LGG, THCA, and KIRC (Supplemental Figure S6b and S6e). Notably, WTAP and FTO could significantly differentiate the OS of all these 4 cancers with low expression indicating good prognosis, except for WTAP in KIRC and FTO in LGG and KIRC (Supplemental Figure S6c and S6d).
Similar results were found in the DSS-related survival analysis (Supplemental Figure S7). Particularly, the high expression of YTHDC1 dramatically improves the prognosis of LGG and KIRC, while decreasing the survival time of THCA (Supplemental Figure S7a-S7d). YTHDC2 could significantly classify the survival curves in LGG, THCA, and KIRC (Supplemental Figure S7e-S7h). As for YTHDF1, it significantly distinguished the prognosis in all 4 cancers (Supplemental Figure S7i-S7l). Both YTHDF2 and YTHDF3 could differentiate the survival curves in LGG and KIRC (Supplemental Figure S7m, S7p, S7q, and S7t). Moreover, low expression of YTHDF2 significantly improved the prognosis of LIHC (Supplemental Figure S7o), while low expression of YTHDF3 significantly improved the prognosis of THCA (Supplemental Figure S7r). Also, Supplemental Figure S8 indicated the DSS survival analysis of “writers” and “erasers” in 4 types of cancers. Results showed that METTL3 could significantly differentiate the DSS of LGG, THCA, and LIHC, where high expression could increase the survival time of LGG, while decrease the survival time of THCA and LIHC (Supplemental Figure S8a-S8d). METTL14 played an important role in distinguishing the DSS of LGG and KIRC (Supplemental Figure 8e-8h). Besides, WTAP and ALKBH5 could dramatically identify the 2 survival curves of 3 cancer types, with WTAP for LGG, LIHC and KIRC (Supplemental Figure S8i-S8l), as well as ALKBH5 for LGG, THCA and KIRC (Supplemental Figure S8q-S8t). It is noted that FTO exhibited distinguishable performance in the DSS of 4 types of cancers, where high expression could improve the DSS of LGG and KIRC whereas decrease the DSS of THCA and LIHC (Supplemental Figure S8m-S8p). These results suggested that the “writers” and “erasers” could serve as prognostic biomarkers in most of the 4 cancer types, which was similar to “readers.”
To further detect the comprehensive effects of YTH family genes on tumor prognosis, YTHScores of each cancer were calculated by multivariate Cox PH regression model by combining 5 YTH family genes and corresponding survival time (see Methods). The YTHScores represented the overall association of YTH family genes with prognosis, and were generated by the coefficients between 5 YTH family genes and tumor survival. Here, samples in each cancer type were classified with corresponding YTHScore by its grouped cutoff (see Methods), which were shown in Supplemental Table S3. Then, survival analysis was performed on the grouped samples of each cancer by YTHScore (Figure 3).

The survival analysis of YTHScore in OS among LGG, THCA, LIHC, and KIRC. The KM survival curves of (a) YTHScore in LGG; (b) YTHScore in THCA; (c) YTHScore in LIHC; (d) YTHScore in KIRC. P-values were calculated by log-rank test. P < .05 represents statistically significant.
Particularly, the YTHScore in LGG was calculated by multivariate Cox PH regression model on YTH gene expression and OS as formula (1). According to the best cutoff of YTHScore (4.48) in LGG, samples were classified into high and low groups with 113 and 394 samples, respectively. Survival analysis indicated that the 2 sample groups divided by YTHScore exhibited a significant difference in tumor survival time (Log-rank test: P-value < .0001), in which low YTHScore stimulated prolonged survival time of LGG (Figure 3a). Similarly, YTHScore in THCA was shown in formula (2). Survival analysis on THCA samples grouped by the best cutoff of YTHScore (1.93) illustrated that, samples with low YTHScore (447 samples) appeared to significantly increase the survival time (Log-rank test: P-value < .0001), compared with high YTHScore groups (57 samples; Figure 3b). Moreover, according to the best cutoff (4.30) of YTHScore calculated in formula (3), LIHC samples were divided into 133 and 235 ones in high and low groups, respectively. Further survival analysis indicated that, YTHScore could significantly distinguish the prognosis of 2 sample groups (Log-rank test: P-value < .0001) in LIHC, where low YTHScore contributed to improving tumor prognosis (Figure 3c). Accordingly, in KIRC, the samples were divided into high and low groups by the best cutoff (−2.09) of YTHScore calculated in formula (4), with 176 and 354 samples, respectively. Results showed that samples with low YTHScore in KIRC indicated significantly prolonged survival time (Log-rank test: P-value < .0001; Figure 3d).


Furthermore, RMEscore was also calculated through multivariate Cox PH regression model by combining m6A methylation related “readers” (YTHDC1/2, YTHDF1/2/3), “writers” (METTL3, METTL14 and WTAP) and “erasers” (FTO and ALKBH5) with corresponding survival time. Results indicated that OS in 2 types of samples classified by the best cutoff of RWEScore could be significantly distinguished in LGG, THCA, LIHC, and KIRC, which displayed comparable ability in OS classification with YTHScore (Supplemental Figure S9).
Similar results were obtained in the DSS analysis with corresponding YTHScores and RWEScore in 4 types of cancers (Supplemental Figure S10 and S11 and Supplemental Table S3), where YTHScore and RWEScore displayed equally comparable ability to significantly differentiate the survival curves of LGG, THCA, LIHC, and KIRC and high scores suggested prolonged DSS. Through the above analysis, we found that the “readers,” “writers” and “erasers” could synergistically regulate the tumor prognosis. Thus, we further revealed their internal associations, and correlation analysis of gene expression implied that these 10 genes were positively correlated with each other, among which the correlation between YTHDC1, YTHDC2 and METTL4 displayed the highest correlation (Supplemental Figure S12a). Besides, protein-protein network through STRING database indicated that the “readers,” “writers” and “erasers” interact closely with various forms such as curated database origin, experimentally determined, gene fusion, gene co-occurrence, suggesting their collaborative mode of action in tumor prognosis (Supplemental Figure S12b). Furthermore, enrichment analysis of these 10 genes indicated that the “readers,” “writers” and “erasers” enriched in mRNA destabilization/modification biological process, located in RNA N6-methyladenosine methyltransferase complex and nuclear speck, and participated in the molecular function of N6-methyladenosine-containing RNA reader activity and mRNA binding (Supplemental Figure S12c), implying their regulation of m6A methylation. Above results illustrated that the “readers,” “writers” and “erasers” might synergistically regulated m6A methylation and tumor prognosis through multi-dimensional interactions. Together, low YTHScore and RWEScore could improve tumor prognosis from both OS and DSS in 4 types of cancers, which might indicate clues from immune signatures and clinical features.
YTHScore reveals immune characteristics associated with tumor prognosis
Immune-related signatures were reported to play an essential role in the regulation of tumor prognosis.38,39 To further explore the potential immune mechanism of cancer prognosis, we calculated the fraction of immune cells of different YTHScore sample groups in 4 cancer types by the CIBERSORT algorithm 33 (Figure 4 and Supplemental Figure S13). Results in Figure 4 displayed the difference in the fraction of 10 important immune cells between the 2 groups of samples in 4 cancers, including the innate immune-related gamma delta T cells (γδ T cells), activated NK cells, monocytes, activated dendritic cells, activated mast cells and neutrophils, as well as acquired immune-related plasma cells, CD8 T cells, T helper follicular cells, and regulatory T cells (Tregs).

The comparison of immune cells fraction in different YTHScore groups in LGG, THCA, LIHC, and KIRC. The immune cell fraction of High and Low YTHScore group in (a) LGG; (b) THCA; (c) LIHC; (d) KIRC. “H” and “L” represent the high group and low sample groups divided by corresponding YTHScore in each cancer, respectively. P-values were calculated by wilcoxon test. “-”: no significance; “*”: P < .05; “**”: P < .01; “***”: P < .001; “****”: P < .0001.
In LGG, it was founded that acquired immune-related cells including CD8 T cells, Tregs were significantly decreased in YTHScore low group, while partial innate immune-related cells such as monocytes, activated mast cells, and neutrophils were dramatically induced in the YTHScore low group, indicating the improved prognosis in LGG might contribute to the enhanced innate immunity (Figure 4a). On the contrary, plasma cells and Tregs were significantly stimulated, accompanied by inhibited monocytes in the YTHScore low group of THCA, implicating activated acquired immune prolonged the survival time in THCA (Figure 4b). Similar results were exhibited in LIHC, where CD8 T cells remarkably increased in the YTHScore low group of LIHC, while γδ T cells, and activated NK cells were significantly improved with decreased neutrophils (Figure 4c). Notably, there were 8 of 10 types of immune cells showed significant differences between the 2 sample groups of KIRC (Figure 4d). In innate immune-related cells, γδ T cells, monocytes and neutrophils tended to increase in YTHScore low groups, with decreased activated NK cells, whereas acquired immune-related cells such as plasma cells, CD8 T cells, T helper follicular cells, and regulatory T cells were suppressed in the YTHScore low group, which suggested that activated innate immunity might be more helpful in suppressing tumor cells.
Collectively, the immune signature analysis suggested that immune properties associated with tumor prognosis might display cancer specificity, with more possibly accompanied by the activation of innate immunity.
YTHScore indicates the association of clinical features with tumor prognosis
Besides immune signatures, clinical features may execute indispensable roles in cancer prognosis.40,41 In this study, we selected the clinical features including T stage, N stage, M stage, gender, age, stage and immune type to detect the potential clinical characteristics of different prognostic groups in 4 cancer types (Figure 5). Also, the percentage of samples in each clinical group was calculated in Supplemental Figure S14. In LGG, only 3 features including gender, age and immune types were obtained. Results indicated that, gender and age appeared no difference between 2 groups divided by YTHScore. While there were more immune subtypes of Immunologically Quiet and fewer Lymphocyte Depleted in the YTHScore low group, compared with the YTHScore high group in LGG (Figure 5a and Supplemental Figure S14a). As for THCA, the low YTHScore group tended to be at younger ages, while the high group at older ages. Besides, there was no apparent difference in the Immune type of 2 groups, and confusing classification in gender, N stage, M stage, T stage and stage (Figure 5b and Supplemental Figure S14b).
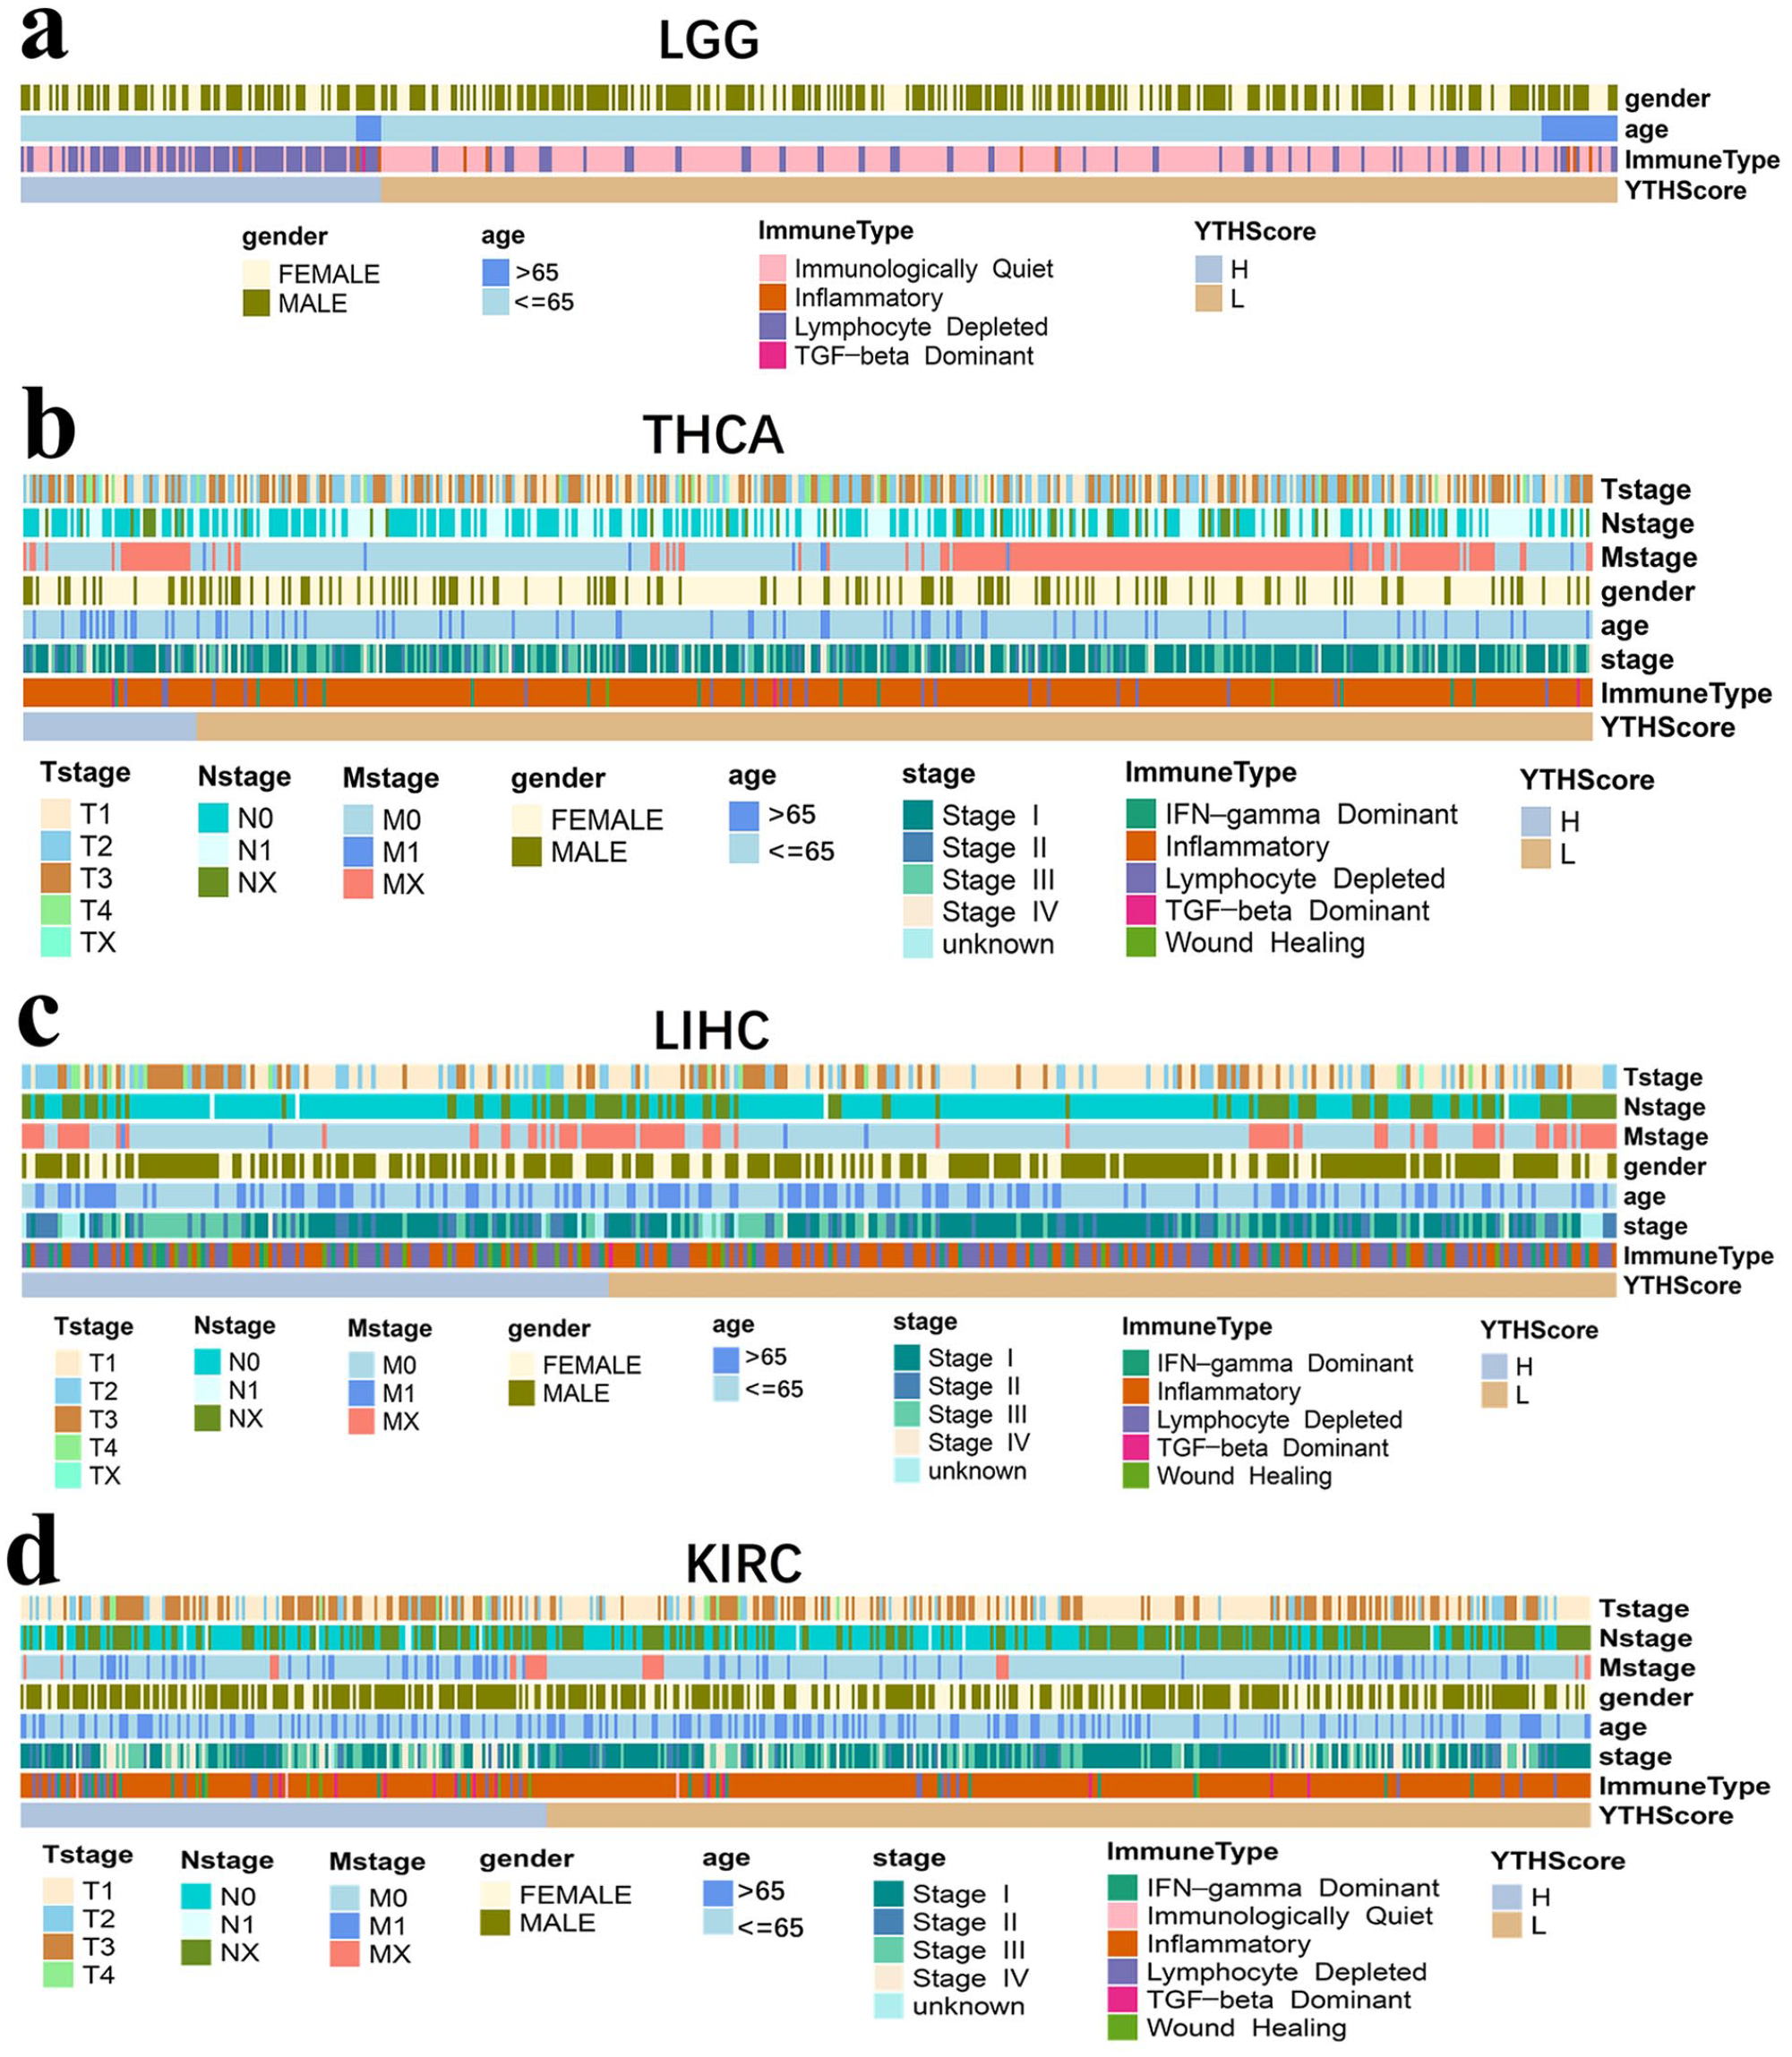
The clinical feature analysis of different YTHScore groups in LGG, THCA, LIHC, and KIRC. The clinical feature analysis of different YTHScore groups in (a) LGG; (b) THCA; (c) LIHC; (d) KIRC. “H” and “L” represent the high group and low sample groups divided by corresponding YTHScore in each cancer, respectively.
Similarly, in LIHC, the samples in the low YTHscore group tended to be at a younger age. However, gender and immune type showed no significant differences between the 2 groups, and N stage, M stage, T stage, and stage showed confusion in the 2 sample groups (Figure 5c and Supplemental Figure S14c). Interestingly, there were clearly lower clinical stage, T stage, and M stage in YTHScore low group compared with the high group in KIRC, and the female samples were a little predominant in the low group, which might contribute to the prolonged survival (Figure 5d and Supplemental Figure S14d). However, Inflammatory immune type was more in low group, and N stage appeared no obvious difference in 2 sample groups.
In conclusion, the diversity of tumor prognosis among cancers may be related to their differential clinical characteristics. Diagnostic age, gender, clinical stage, TNM stage, and immune type may play various roles in different cancer prognoses.
Discussion
Cancer is a major concern regarding public health, with globally rapidly increasing morbidity and mortality. 42 The complexity and diversity of cancer posed an urgent requirement for clarifying the molecular mechanisms elucidating cancer pathogenesis patterns from multiple perspectives and identifying reliable biomarkers for early detection, diagnosis and treatment. 43 Recently, m6A methylation was observed to play crucial roles in cell proliferation, tumor progression, and prognosis, 44 becoming a promising potential candidate for therapeutic targets. Increasingly, more evidence has demonstrated that heterogeneity exists across tumor types and among tumors arising from the same tissue. 45 Therefore, it is urgently needed to construct cancer-specific prognostic prediction system at pan-cancer level based on the tumor essence. 46 Pan-cancer analysis can reveal the similarities and differences of different tumors, which provide theoretical support for cancer prevention, therapeutic target design, and potential therapeutic drug screening.47,48 Large-scale genomics projects like TCGA database, provide matched molecular and clinical prognosis of various cancers, which help systematically elucidate the survival impact of single or combined gene expression. 42 Herein, we focused on YTH domain family genes, known as one of the pivotal “readers” of m6A methylation, whose prognosis regulatory effects at pan-cancer level remained insufficient. 49 Through establishing a pan-cancer transcriptomic signature analysis for survival prognostication, 50 this study would provide an opportunity to unearth the association between YTH domain family genes and clinical outcomes, thereby facilitating the discovery of potential prognostic biomarkers, and clinical transformation, 46 such as screening potential active compounds,51,52 as well as activators and inhibitors in cancer therapy. 53
In this study, we systematically elucidated the expression patterns of m6A methylation regulator YTH domain family genes and their modulation on tumor prognosis in 8 categories of cancers at the pan-cancer level. By combining the RNA sequencing datasets, we found that YTH family genes were significantly differentially expressed in most of the cancers (Figure 1), consistent with the previous studies that RNA m6A modification proteins were frequently upregulated or downregulated in human cancer tissues. 7 Particularly, YTH domain family genes were generally highly expressed in Gastrointestinal cancers, while lowly expressed in Urologic cancers (Figure 1), which was similar with “writers” and “erasers” (Supplemental Figure S1). Notably, these results are highly consistent with previous researches at pan-cancer level. 54 Therein, YTHDC1 was significantly highly expressed in Head and neck cancer (HNSC), Gastrointestinal cancers including ECSA, COAD, STAD, LIHC, and CHOL, while lowly expressed in Endocrine cancer (THCA), and one of Thoracic cancer (LUAD; Figure 1b and c). Accordingly, Zhang et al observed that YTHDC1-knockdown could decrease the proliferation in HepG2 cells in contrast with that in the control group, which verified that YTHDC1 was overexpressed in Hepatocellular carcinoma (HCC). 55 Besides, YTHDC1 was reported to be highly expressed in gastric cancer to stimulate cancer development and progression through modulating nuclear enrichment of the splicing factor ROD1. 56 YTHDC2 was significantly overexpressed in 3 Gastrointestinal cancers including STAD, LIHC and CHOL, as well as one of the Urologic cancers (KIRC), which was consistent with Yuan et al’s study of YTHDC2 on gastric cancer. 57 Whereas YTHDC2 was under-expressed in one of the CNS cancers (GBM), Endocrine cancer (THCA), one Thoracic cancer (LUSC), and several Urologic cancers including KIRP and KICH (Figure 1b and d). As reported, YTHDC2 overexpression significantly inhibited non-small cell lung cancer (NSCLC) cell proliferation, migration, and invasion, indicating its low-expression at tumor environment. 58
Moreover, YTHDF1 was significantly highly expressed in CNS cancers (GBM, LGG), Head and neck cancer (HNSC), Soft tissue cancer (PCPG), Thoracic cancer (LUSC, LUAD), most of the Gastrointestinal cancers including ESCA, COAD, STAD, READ, LIHC, CHOL, 1 of Gynecologic cancer (CESC), and 3 of Urologic cancers including PRAD, BLCA, and KIRP, while lowly expressed in the left Urologic cancers including KIRC and KICH (Figure 1b and e). It was consistent with the study that, the expression of YTHDF1 was significantly upregulated in HCC, colorectal cancer and lung cancer, 59 which showed positive correlations with the pathological stage, 60 drove immunosuppression, 61 , and promoted cancer progression, 62 respectively. Also, YTHDF1 was found to be highly expressed in human colon and gastric cancer tissues, in which the up-regulation was associated with poor prognosis.18,19 Furthermore, the downregulation of YTHDF1 expression was prone to be significantly suppressed the tumorigenicity of colorectal cancer (CRC) cells and the growth of mouse xenografts. 60 Moreover, multiple cancers including Head and neck cancer (HNSC), 1 Thoracic cancer (LUAD), most Gastrointestinal cancers (ESCA, COAD, STAD, READ, LIHC, and CHOL), 2 Gynecologic cancers (UCEC, BRCA) and 1 Urologic cancer (BLCA) exhibited high expression patterns in YTHDF2, while only Endocrine cancer (THCA), and 3 of Urologic cancers including KIRP, KIRC and KIRP displayed low expression patterns in YTHDF2 (Figure 1b and f). As in previous studies, YTHDF2 is found to be up-regulated in lung cancer tissues and functions as an oncogene in lung cancer. 15 Also, YTHDF2 was reported to be frequently upregulated at both the RNA and protein level in BLCA. 63 As for YTHDF3, only Head and neck cancer (HNSC), and some Gastrointestinal cancers including ESCA, STAD, LIHC and CHOL showed high expression patterns in tumor samples, whereas Endocrine cancer (THCA), one Gastrointestinal cancer (COAD), one gynecologic cancer (UCEC), and some Urologic cancers including BLCA, KIRP and KICH showed low expression patterns (Figure 1b and g), which was highly consistent with the study of Cao et al. 64 As reported, m6A regulators including YTHDC1, YTHDF1, YTHDF2 and YTHDF3 showed increased expression in esophageal cancer (EC) samples. Also, YTHDC2 was significantly correlated to worse outcomes and advanced stages in EC. 65 Besides, study found that YTHDF3 was upregulated in STAD tissue samples and associated with poor prognosis in patients. 66
Then in the prognosis association analysis, we found that all YTH domain family genes were related to the OS and DSS in KIRC, and showed as prognosis protective factors (Figure 2a-f and Supplemental Figure S3a-S3f), which was similar with the “erasers” of FTO in KIRC (Supplemental Figure S2 and S4). Also, 4 of these YTH genes including YTHDC2, YTHDF1, YTHDF2 and YTHDF3, as well as “writers” of METTL14/WTAP, and “erasers” of ALKBH5 were displayed as risk factors for OS and DSS in LGG (Figure 2b-e and Supplemental Figures S2, S3b-S3e, and S4), where YTHDF2 in OS of LGG was verified by Li et al ’s study. 54 As for THCA, YTHDC2, YTHDF1, YTHDF3, 64 and “erasers” of ALKBH5 were associated with OS (Figure 2b, c and e and Supplemental Figure S2e and S2f), and YTHDF1 was also shown as a risk factor for DSS (Supplemental Figure S3c). Moreover, YTHDF1 and YTHDF2 were both risk factors of OS and DSS for LIHC (Figure 2c and d and Supplemental Figure S3c-S3d), same with the “writers” of METTL3 and WTAP. As reported, YTHDF2 was shown to be associated with hepatocellular carcinoma (HCC) patient prognosis. 20 Also,YTHDF2 was found to enhance OCT4 mRNA translation in an m6A-dependent manner, thereby promoting HCC stem cell phenotype and cancer metastasis. 20 Moreover, YTHDF2 could suppress hepatocellular carcinoma (HCC) cell proliferation and growth by promoting the degradation of epidermal growth factor receptor (EGFR), 67 and aggravate inflammation, vascular remodeling and metastasis of HCC. 68 The above results supported the association between YTHDF2 and the prognosis of HCC.
Furthermore, survival analysis in 4 exampled cancers illustrated that, high expression of YTHDC1 and FTO significantly improved the OS and DSS of LGG and KIRC, while decreasing the OS of LIHC and DSS of THCA (Supplemental Figures S5-S8). Zou et al obtained that YTHDC1 was significantly associated with the HCC survival and served as a risk prognostic factor through Univariate Cox regression analysis. 69 Also, FTO was reported to be significantly correlated with OS of papillary thyroid carcinoma, and was identified as risk gene. 70 As for YTHDC2, its high expression significantly inhibited the OS and DSS of LGG and THCA, but prolonged the OS and DSS of KIRC (Supplemental Figures S5e-S5h and S7e-S7h), which was similar with that of ALKBH5 (Supplemental Figures S6 and S8). Consistent with the previous study, YTHDC2 was significantly correlated with the prognosis of LGG, and high expression level of YTHDC2 presented worse OS and DSS in LGG. 49
Moreover, there were significant differences in OS and DSS between the 2 groups with different YTHDF1 expressions in LGG, THCA, LIHC and KIRC, where low expression of YTHDF1 induced the survival of the first 3 cancers but contributed to the poor prognosis of KIRC (Supplemental Figures S5i-S5l and S7i-S7l), so was WTAP in the OS of these 4 cancer types (Supplemental Figure S6i-S6l). It was reported that up-regulation of YTHDF1 was associated with poor prognosis in HCC patients.71 -73 Also, Wang et al reported that a low level of YTHDF1 expression was associated with better survival of HCC patients through Kaplan-Meier analysis. 60 Besides, YTHDF1 was shown to play an important role in cell cycle and metabolism of HCC cells, thus participating in the prognosis of HCC. 71 Survival analysis in YTHDF2 showed similar results with YTHDF1, except for the failure in the distinction of DSS in 2 groups of THCA (Supplemental Figures S5m-S5p and S7m-S7p). As for LIHC, it was consistent with the previous study that, high expression of YTHDF2 was positively correlated with OCT4 m6A methylation and overexpression in human HCC tissues, and was associated with poor prognosis in both datasets from the TCGA database and clinical centers. 20 Moreover, Chen et al’s study indicated that YTHDF2 was significantly associated with OS of clear cell renal cell carcinoma and could serve as a protective gene. 74 As for YTHDF3, its low expression increased the OS of LGG, THCA and LIHC, as well as DSS of LGG and THCA, while shortening the OS and DSS in KIRC (Supplemental Figures S5q-S5t and S7q-S7t). These results were similar to those observed for METTL14, WTAP, and ALKBH5 in OS and DSS (Supplemental Figures S6 and S8), in which METTL14 was verified as protective gene of clear cell renal cell carcinoma. 74
Particularly, YTHScore in 4 exampled cancers could all significantly distinguish the survival curves of different sample groups, and low YTHScore showed dramatical abilities to improve the OS and DSS (Figure 3 and Supplemental Figure S10), which was consistent with the result of RWEScore (Supplemental Figures S9 and S11). These results indicated that m6A methylation “readers” alone could achieve equally comparable prognostic classification as further combined with “writers” and “erasers.” Further immune signature analysis indicated that samples in YTHScore low groups displayed different patterns depending on cancer specificity (Figure 4 and Supplemental Figure S13). The primary pattern illustrated that the increase of partial innate immune-related cells might help to improve the prognosis of cancers. As reported, activation of innate immunity may be necessary for T cell activation and accumulation. 75 Moreover, the ability to harness innate immunity was shown to be a promising solution to improve cancer immunotherapy. 76 Furthermore, the investigation on clinical characteristics elucidated that, Age at diagnosis, clinical stage, TNM stage and immune types might also be the essential factors to affect the tumor prognosis (Figure 5 and Supplemental Figure S14), which were consistent with the previous studies.77 -80 Actually, not all cancers show significant differences in immune and clinical characteristics between the sample groups with different prognoses, probably because these characteristics were not the key mechanism behind determining tumor prognosis in all cancers. More experiments and datasets are needed for further complement and improvement. Besides, there is a lack of promotion and verification on additional independent datasets, and the modulation effects of YTH domain family genes on pan-cancer and the underlying mechanism need to be further confirmed.
Conclusion
This study comprehensively explored the expression pattern and prognostic regulatory roles of m6A “readers” (YTH family genes) as well as other “writers” (METTL3, METTL14, WTAP) and “erasers” (FTO, ALKBH5) at the pan-cancer level, and further analyzed the prognosis-related immune and clinical characteristics. Results illustrated that most of the m6A “readers, “writers,” and “erasers” were generally significantly overexpressed in Gastrointestinal cancers, while lowly expressed in Endocrine and Urologic cancers. Moreover, both YTHScore and RWEScore could dramatically classify the prognosis of 4 exampled cancers. Furthermore, analysis of immune signature and clinical characteristics implied that the other factors such as activity of innate immune, diagnostic age, clinical stage, TNM stage and immune types, might play an important role in tumor prognosis.
Supplemental Material
sj-docx-1-cix-10.1177_11769351241300030 – Supplemental material for Detecting the Tumor Prognostic Factors From the YTH Domain Family Through Integrative Pan-Cancer Analysis
Supplemental material, sj-docx-1-cix-10.1177_11769351241300030 for Detecting the Tumor Prognostic Factors From the YTH Domain Family Through Integrative Pan-Cancer Analysis by Chong-ying Zhu, Qi-wei Yang, Xin-yue Mu, Yan-yu Zhai, Wen-yan Zhao and Zuo-jing Yin in Cancer Informatics
Footnotes
Acknowledgements
Abbreviations
YTH: YT521-B homology; RNAseq: RNA sequencing; OS: overall survival; DSS: disease-specific survival; LGG: lower grade glioma; THCA: thyroid cancer; LIHC: liver hepatocellular carcinoma; KIRC: kidney clear cell carcinoma; TNM: Tumor-Node-Metastasis; IGF2BP: insulin-like growth factor 2 mRNA binding proteins; SETD7: suppressor ensemble domain 7; KLF4: Kruppel-like factor 4; ITGA6: integrin subunit α6; TCGA: The Cancer Genome Atlas; FC: fold change; Cox PH: cox proportional hazards; KM: Kaplan–Meier; CNS: central nervous system; GBM: glioblastoma; LGG: lower grade glioma; HNSC: head and neck cancer; THCA: thyroid cancer; PCPG: pheochromocytoma and paraganglioma; LUAD: lung adenocarcinoma; LUSC: lung squamous cell carcinoma; ESCA: esophageal carcinoma; COAD: colon adenocarcinoma; STAD: stomach adenocarcinoma; READ: rectum adenocarcinoma; LIHC: liver hepatocellular carcinoma; CHOL: cholangiocarcinoma; PAAD: pancreatic adenocarcinoma; UCEC: endometrioid cancer; CESC: cervical cancer; BRCA: breast cancer; PRAD: prostate cancer; BLCA: bladder cancer; KIRP: kidney papillary cell carcinoma; KIRC: kidney clear cell carcinoma; KICH: kidney chromophobe; CI: Confidence Interval; CRC: colorectal cancer; EC: esophageal cancer; HCC: hepatocellular carcinoma; EGFR: epidermal growth factor receptor.
Author Contributions
CYZ and ZJY made substantial contributions to the design of the work, analysis and interpretation of data, and preparation of the manuscript. CYZ, QWY, and XYM made substantial contributions in the analysis of the result, validation of the methods, and design of the figures and tables. YYZ and WYZ participated in the revision of the manuscript, figures and tables. ZJY conceived, designed, and supervised the study. All authors revised the manuscript critically for important intellectual content, and approved the final version of the manuscript.
Availability of Data and Materials
Funding:
The author(s) disclosed receipt of the following financial support for the research, authorship, and/or publication of this article: This work was supported by National Natural Science Foundation of China for Youths (No. 82002664); Shanghai jiading district health commission scientific research project youth fund (No. 2020-QN-02); and Meng Chao Talent Training Plan - Youth Research Talent Training Program of Eastern Hepatobiliary Surgery Hospital.
Declaration Of Conflicting Interests:
The author(s) declared no potential conflicts of interest with respect to the research, authorship, and/or publication of this article.
Ethics Approval and Consent to Participate
As the data is publicly available at The Cancer Genome Atlas (TCGA) database, Ethical approval and consent of participation are not applicable.
Consent for Publication
Not applicable.
Supplemental Material
Supplemental material for this article is available online.
References
Supplementary Material
Please find the following supplemental material available below.
For Open Access articles published under a Creative Commons License, all supplemental material carries the same license as the article it is associated with.
For non-Open Access articles published, all supplemental material carries a non-exclusive license, and permission requests for re-use of supplemental material or any part of supplemental material shall be sent directly to the copyright owner as specified in the copyright notice associated with the article.