
Abstract
Objectives:
Adrenocortical carcinoma (ACC), a rare and aggressive adrenal cortex cancer, poses significant challenges due to high mortality, poor prognosis, and early post-surgery recurrence. Variability in survival across ACC stages emphasizes the need to uncover its molecular underpinnings. Adrenocortical adenoma, a benign tumor, adds to diagnostic challenges, highlighting the necessity for molecular insights. The Non-SMC Associated Condensin Complex (NCAP) gene family, recognized for roles in chromosomal structure and cell cycle control. This study focuses on evaluating NCAP gene functions and importance in ACC through gene expression profiling to identify diagnostic and therapeutic targets.
Methods:
Microarray datasets from ACC patients, obtained from the Gene Expression Omnibus database, were normalized to eliminate batch effects. Differential expression analysis of NCAP family genes, facilitated by the GEPIA2 database, included survival and pathological stage evaluations. A Protein-Protein Interaction network was constructed using GeneMANIA, and additional insights were gained through Gene Ontology enrichment analysis, correlation analysis, and ROC curve analysis.
Results:
ACC samples exhibited elevated levels of NCAPG, NCAPG2, and NCAPH compared to normal and adenoma samples. Increased expression of these genes correlated with poor overall survival, particularly in advanced disease stages. The Protein-Protein Interaction network highlighted interactions with related proteins, and Gene Ontology enrichment analysis demonstrated their involvement in chromosomal structure and control. Differentially expressed NCAP genes showed positive associations, and ROC curve analysis indicated their high discriminatory power in identifying ACC from adenoma and normal samples.
Conclusion:
The study emphasizes the potential importance of NCAPG, NCAPG2, and NCAPH in ACC, suggesting roles in tumor aggressiveness and diagnostic relevance. These genes could serve as therapeutic targets and markers for ACC, but further exploration into their molecular activities and validation studies is imperative to fully harness their diagnostic and therapeutic potential, advancing precision medicine approaches against this rare but lethal malignancy.
Introduction
Adrenocortical carcinoma (ACC) is a rare and aggressive malignancy that begins in the adrenal cortex and has an annual incidence rate of 0.7 to 2.0 cases per 1 000 000 people. 1 ACC is distinguished by high mortality, a poor prognosis, and vulnerability to recurrence, with the majority of recurrences occurring within the first 2 years after surgical resection.2,3
The dramatic discrepancy in survival rates among different phases of the disease is one of the major features of ACC. 4 Patients with localized ACC have a median 5-year survival rate of 74%, which drops to 56% in the presence of regional metastases and even lowers to 37% in the presence of distant metastases. 5 At the moment, the major therapy approach for ACC is complete surgical resection. Nonetheless, a significant proportion of ACC patients have metastases at the time of diagnosis, posing a significant treatment challenge.1,6 As a result, a thorough investigation into the molecular underpinnings of ACC becomes critical, as understanding the processes driving its progression is thought critical for the development of novel diagnostic and treatment strategies.
Adrenocortical adenoma, a benign neoplasm that originates in the adrenal cortex, is a kind of adrenal tumor. While not as dangerous as ACC, adrenocortical adenomas are important in the setting of adrenal tumors. They appear as non-cancerous growths in the adrenal cortex, and distinguishing between ACC and adrenocortical adenoma is crucial for accurate diagnosis and patient management.1,7
The Non-SMC Associated Condensin Complex (NCAP) gene family has lately sparked interest in cancer biology. Condensins, known for their critical functions in cellular mitosis and chromosome organization, have been discovered to be involved in the regulation of a wide range of cellular processes. 8 Their participation in chromosomal aggregation and segregation during the cell cycle makes them fascinating targets for investigation in a condition characterized by uncontrolled cellular proliferation.9,10 Nonetheless, the precise roles and regulatory mechanisms of NCAP genes in the context of ACC are mainly unknown. Understanding the role of NCAP family genes in ACC may lead to the discovery of novel diagnostic and treatment mechanisms.
In recent years, gene expression profiling, made possible by microarray technology, has emerged as a powerful tool for examining the molecular foundations of ACC. This work uses gene expression microarrays to investigate the roles of the NCAP gene family in the context of ACC. This paper takes a comprehensive approach to elucidating the roles and significance of the NCAP gene family in the context of ACC, including gene expression data analysis, survival and stage analysis, the construction of protein-protein interaction networks, gene ontology enrichment analysis, correlation analysis, and ROC curve analysis. This extensive investigation has the potential to shed light on novel diagnostic and therapeutic targets for ACC, ultimately improving our understanding of this rare but deadly cancer (Figure 1).

Flowchart of the current study.
Material and Methods
Obtaining microarray data
Two microarray datasets comprising mRNA expression profiles of ACC patients were obtained from the Gene Expression Omnibus (GEO) database (https://www.ncbi.nlm.nih.gov/geo/) for the identification of differentially expressed genes (DEGs) associated with ACC. 11 To retrieve the functional genomic data, the GEOquery package (version 2.68.0) in R language software (version 4.3.1) was used. 12 GSE33371 and GSE12368 were the 2 datasets used in this analysis. These datasets share the same microarray platform, GPL570 (HG-U133_Plus_2), based on the Affymetrix Human Genome U133 Plus 2.0 Array. GSE33371 contains samples from 33 ACC patients, 22 Adrenocortical Adenomas, and 10 normal adrenal cortex samples, all from different people. There are 12 ACC samples, 16 Adrenocortical Adenoma samples, and 6 normal adrenal cortex samples in GSE12368. All raw expression values were normalized and log2 transformed to ensure data comparability. To eliminate the possibility of batch effects, the sva package (version 3.48.0) in R was used to combine data from the 2 separate datasets. 13
Evaluation of NCAP family genes expression
The NCAP family genes’ differential expression was examined using the R limma package (version 3.56.2), which is available on the Bioconductor platform. 14 DEGs were identified using the |log2FoldChange| ⩾ 1 criterion and an adjusted P-value of <0.01. Given the existence of ACC, adenoma, and normal samples, 3 distinct analyses were carried out: 1. carcinoma versus normal samples; 2. carcinoma versus adenoma samples; and 3. adenoma samples versus normal samples.
NCAP family genes survival and stage analysis
The Kaplan-Meier technique was used to analyze the survival of NCAP family genes using the GEPIA2 (Gene Expression Profiling Interactive Analysis, version 2) database. 15 For large-scale expression profiling and interactive analysis, this online resource makes use of data from The Cancer Genome Atlas (TCGA) and Genotype-Tissue Expression (GTEx).16,17 In addition, pathological stage analysis for ACC was performed in GEPIA2 using the “Expression Analysis-Pathological Stage Plot” module. This resulted in violin plots depicting the expression levels of NCAP family genes at various stages of ACC.
Protein-protein interaction (PPI) network construction
A Protein-Protein Interaction (PPI) network was created using the GeneMANIA Cytoscape plugin.18,19 GeneMANIA uses a comprehensive collection of functional relationships to identify genes related with a set of input genes, including protein and genetic interactions, pathways, co-expression, co-localization, and protein domain similarity. The interaction network was shown using Cytoscape, an open-source bioinformatics software.
NCAP PPI network gene ontology enrichment analysis
A functional enrichment analysis was performed to discover functions that were overrepresented among a set of genes that were likely related to experimental circumstances. 20 For this analysis, the clusterProfiler package (version 4.8.3) in R was utilized, with an emphasis on Gene Ontology (GO). 21 GO is a bioinformatics resource that uses standardized vocabulary to describe gene products’ biological processes, cellular components, and molecular functions. Significantly enriched proteins were found using groupGo, and enrichGO using a q-value of <.01 as the significance criterion.
Analysis of correlation
Pearson correlation analysis, a statistical method for determining the strength and direction of linear correlations between continuous variables, was used to examine the link between NCAP family members. Significant correlations were determined using a P-value ⩽ .05 and a correlation coefficient ⩾ .5.
ROC curve evaluation
Receiver Operating Characteristic (ROC) curve analysis was performed in R using the pROC package (version 1.18.4) to assess the predictive potential of the NCAP gene family in the context of ACC. 22 ROC curves are useful for determining the sensitivity and specificity of diagnostic tests or biomarkers. The Area Under the Curve (AUC) was calculated to measure the capacity of NCAP family gene expression to differentiate between distinct sample types (Carcinoma vs Adenoma and Normal) in this study. An AUC of 0.5 indicates that there is no discriminatory power (equivalent to random chance), whereas an AUC of 1.0 indicates complete discrimination. In general, a greater AUC indicates higher efficiency.
Results
Data gathering
GSE33371 and GSE12368 microarray datasets containing expression data from Adrenocortical Carcinoma (ACC) patients, Adrenocortical Adenoma, and Normal samples were acquired and processed for the study. The first stages in data preprocessing were to convert raw expression values into log2 values using R software, followed by normalization using the Normalize-Quantiles function. These datasets were combined, and any batch effects were removed (Figure 2), yielding a total of 99 samples, which were allocated among the Carcinoma, Adenoma, and Normal sample groups, as shown in Table 1.

A visual representation of the elimination of batch effects using ComBat for Affymetrix platforms. Boxplot (A) displays the distributions of gene expression and the samples of microarray datasets prior to the elimination of batch effects. Boxplot (B) shows the corresponding concepts after batch removal. The boxplots illustrate the normalization and reduction in technical diversities among datasets.
The sample information of 2 datasets.

Evaluation of NCAP family gene expression
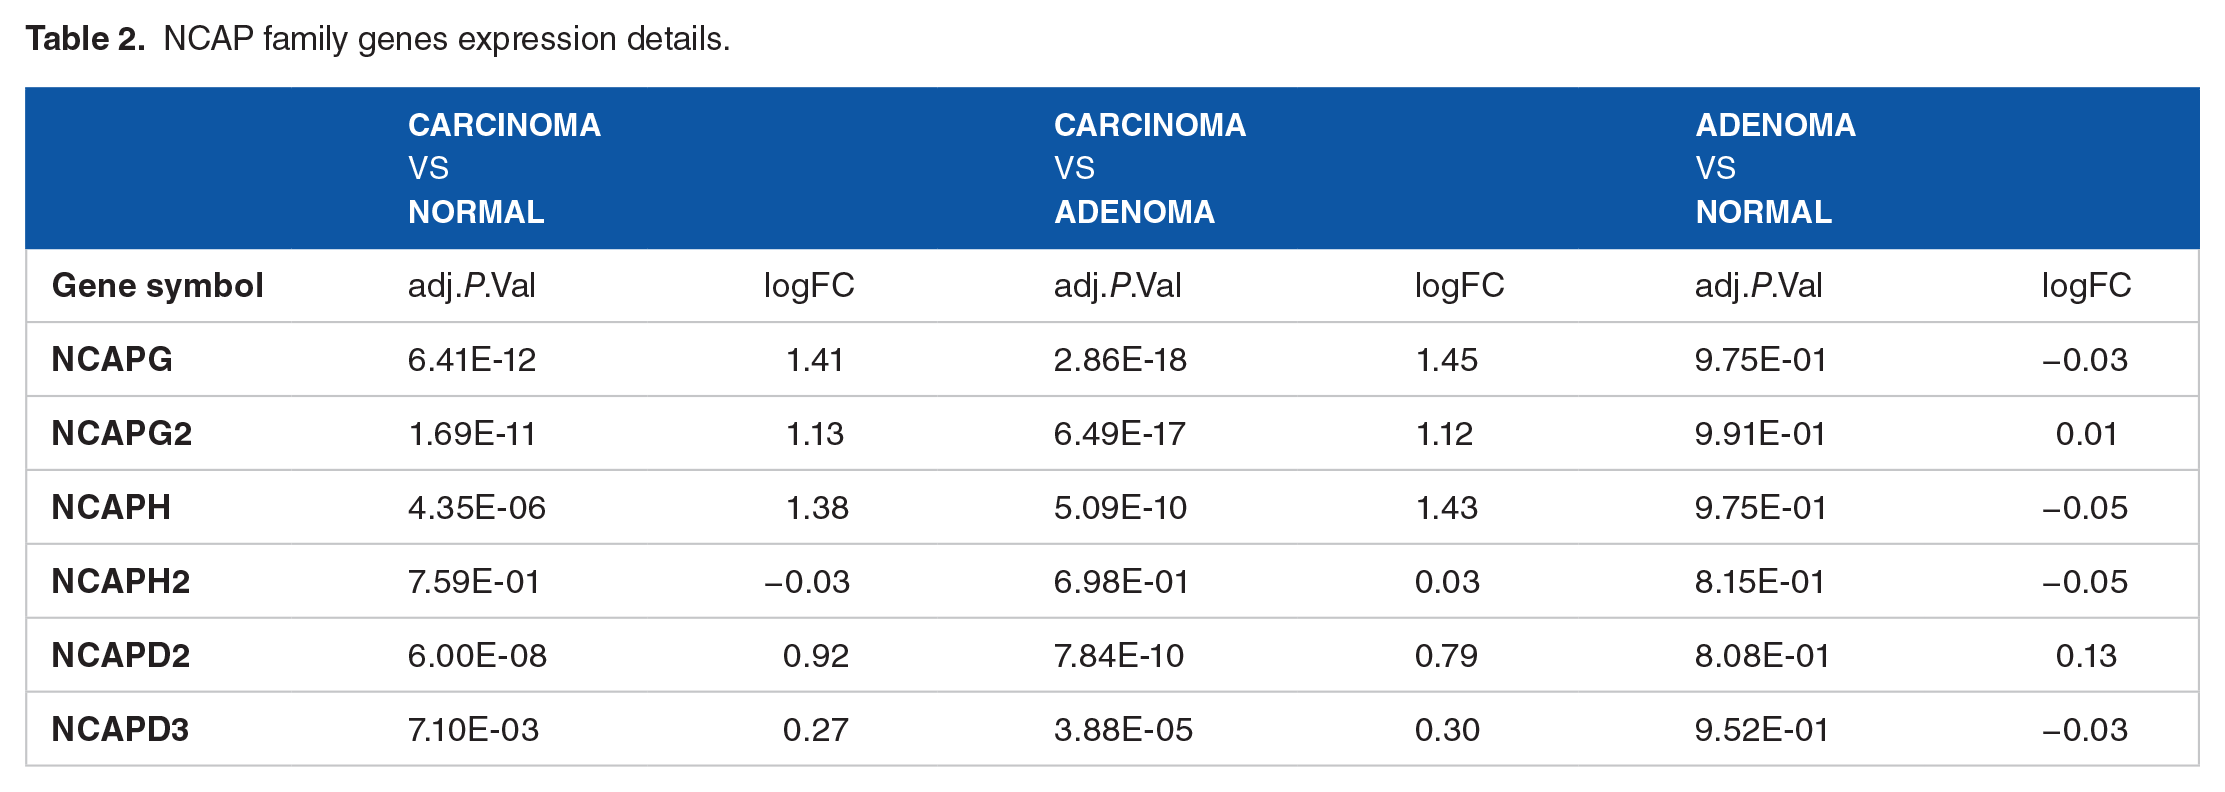
Using the limma software, differential expression analysis revealed that 3 of the 6 NCAP family genes (NCAPG, NCAPG2, and NCAPH) were statistically significant (Figure 3). These genes showed differential expression in Carcinoma samples when compared to Normal samples and in Carcinoma samples when compared to Adenoma samples, but no significant changes were seen when Adenoma samples were compared to Normal samples (Table 2). In addition, there were no significant differences in the expression patterns of NCAPH2, NCAPD2, and NCAPD3 when Carcinoma samples were compared to Adenoma and Normal samples (Figure 4).
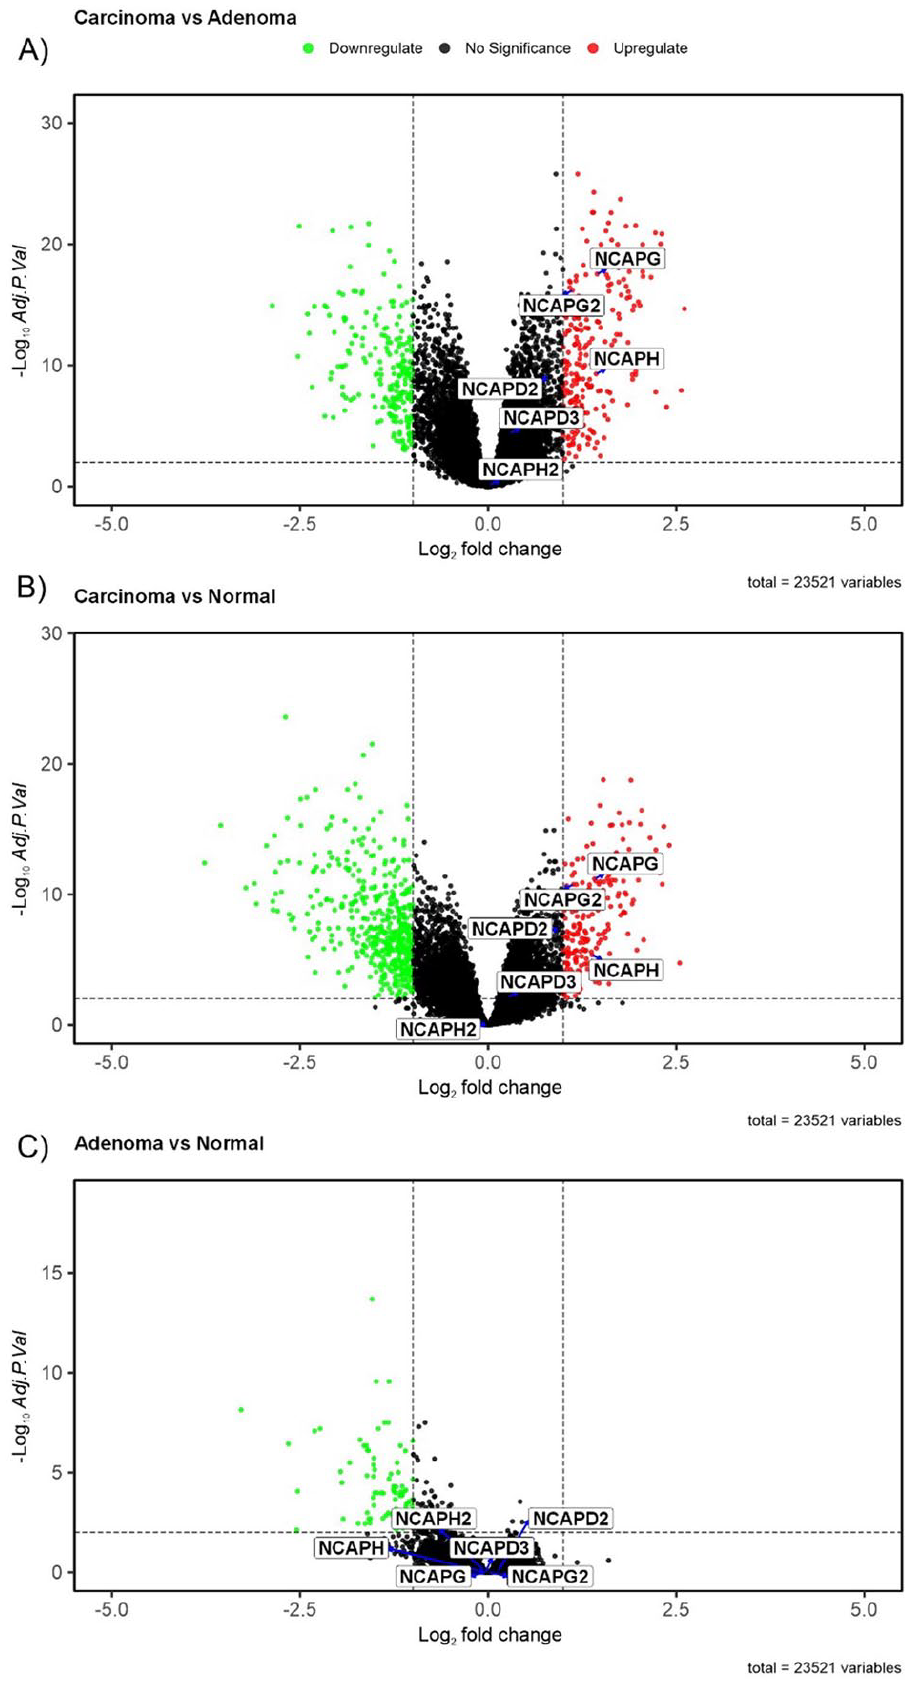
The differential expression analysis showed that 3 of the 6 NCAP family genes (NCAPG, NCAPG2, and NCAPH) were statistically different when carcinoma samples were compared to adenoma samples. This was shown on the volcano plot. (B) Additionally, the genes NCAPG, NCAPG2, and NCAPH exhibited a statistically significant increase in expression in carcinoma samples compared with normal samples. (C) However, there were no notable alterations observed in the expression of NCAP family genes when comparing adenoma samples with normal samples.
NCAP family genes expression details.

Boxplots comparing the expression levels of 6 genes from the NCAP family in carcinoma, adenoma, and normal tissues. (A) NCAPG, (B) NCAPG2, (C) NCAPH, (D) NCAPD3, (E) NCAPD2, (F) NCAPH2.
NCAP family gene survival and stage analysis
Using the GEPIA database, we evaluated the clinical prognostic significance of NCAPG, NCAPG2, and NCAPH in ACC. According to the GEPIA database, increased expression of NCAPG, NCAPG2, and NCAPH was associated with poor overall survival in ACC patients (P ⩽ .05). Also, NCAPG, NCAPG2, and NCAPH had very significant and high overall survival hazard ratios of 6 (P = .00015), 6.2 (P = .00011), and 6.5 (P = 9.3e-05) respectively (Figure 5). Furthermore, these genes were shown to be significantly overexpressed in advanced ACC stages (stages III and IV) compared to primary stages (stages I and II) (Figure 6).

Kaplan-Meier curves show 3 of 6 NCAP family members have a significant impact on the survival of the patients: (A) NCAPG, (B) NCAPG2, (C) NCAPH.

The result of expression evaluation based on pathologic stage shows the meaningful upregulation of (A) NCAPG, (B) NCAPG2, and (C) NCAPH in the advanced pathologic stages (III, IV) of adrenocortical carcin.
Protein-protein interaction (PPI) network construction
A PPI network was built utilizing NCAPG, NCAPG2, and NCAPH genes using the GeneMania database to obtain the top 20 linked proteins based on Physical Interaction, Co-expression, Co-localization, Pathway, Predicted, and Shared protein domains. The finished PPI network contained 23 nodes and 275 edges. These 20 proteins from highest degree to lowest degree include SMC2, NCAPD2, SMC4, AURKB, PRIM1, CCNA2, TOP2A, LMNB1, NDC80, CENPF, PRIM2, BRCA2, NCAPD3, MKI67, NEK6, NCAPH2, PLEC, HSF2, HECTD3, SLC15A4 (Figure 7).
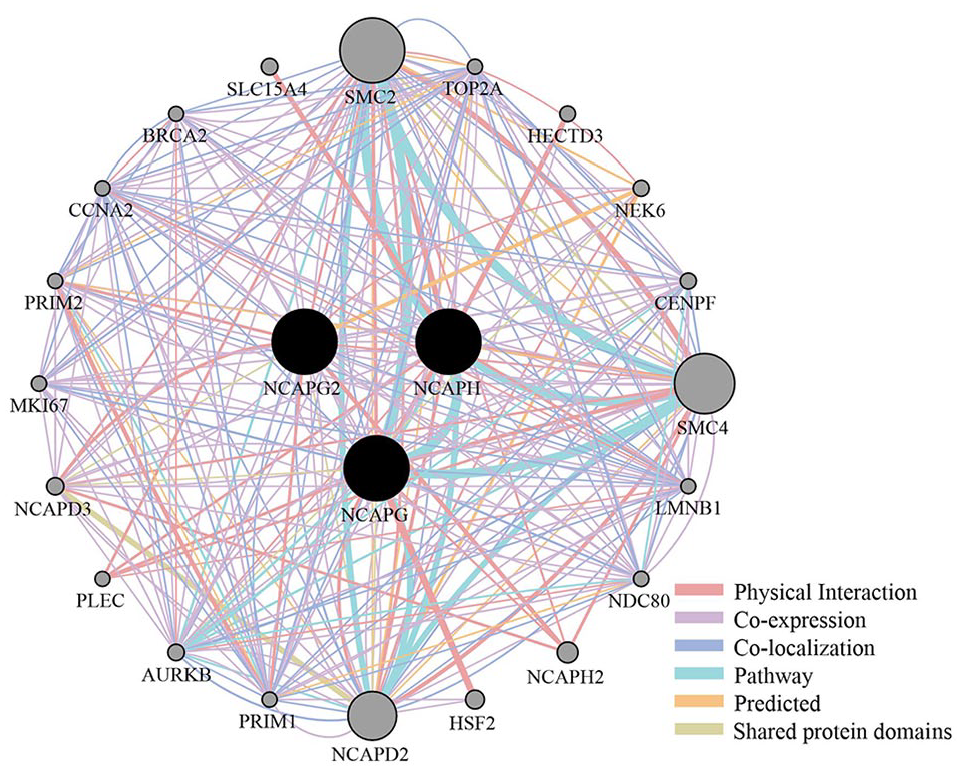
A protein-protein interaction (PPI) network was created for the NCAPG, NCAPG2, and NCAPH using the GeneMANIA plugin in the Cytoscape app. The network edge is color-coded to represent various bioinformatics methods used, including physical interaction, co-expression, predicted, co-localization, pathway, and shared protein domains.
NCAP PPI network gene ontology enrichment analysis
Gene Ontology (GO) enrichment analysis was used to determine the functional roles and signaling processes of genes in the NCAP family’s PPI network. This study discovered links between biological processes such as “regulation of chromosome segregation,” “regulation of chromosome separation,” and “chromosome separation,” among others. These genes were found in cell components such as “condensed chromosome,” “nuclear chromosome,” and “condensed nuclear chromosome.” In terms of molecular function, enrichment was observed in “single-stranded DNA binding,” “magnesium ion binding,” and "DNA-directed 5’−3” RNA polymerase activity (Figure 8A)."

(A) The dot plot displays the most significant GO terms linked to biological process (BP), cellular component (CC), and molecular function (MF). (B) The Cnet map displays the individual roles of each gene in the most significant pathways.
The NCAP family genes and their linked proteins are shown in the Cnetplot to be involved in the regulation of chromosomal shape and dynamics. These genes play a role in chromosome segregation, chromosome condensation, chromosome separation, and chromosome organization, all of which are required for successful cell division (Figure 8B).
Analysis of correlation
The present study used Pearson correlation analysis in R to evaluate the relationship between the expression of NCAPG, NCAPH, and NCAPG2. The study discovered positive correlations between all 3 NCAP genes that were differentially expressed in ACC, NCAPG and NCAPG2 (Correlation = .85, P-value = 6.21e-29), NCAPG and NCAPH (Correlation = .85, P-value = 8.79e-29), and NCAPH and NCAPG2 (Correlation = .78, P-value = 4.03e-21) (Figure 9).

Correlation between gene expression levels of (A) NCAPG and NCAPG2, (B) NCAPG and NCAPH, (C) NCAPG2 and NCAPH.
ROC curve evaluation
ROC curve studies revealed that NCAPG, NCAPG2, and NCAPH have great discriminatory strength in distinguishing between distinct sample types, as evidenced by high Area Under the Curve (AUC) values. The AUC for NCAPG was 0.963 (P-value: 2.6e-15), for NCAPG2 0.943 (P-value: 4.1e-14), and 0.857 (P-value: 1.1e-09) for NCAPH (Figure 10).

ROC curve analysis demonstrates the diagnostic performance of the (A) NCAPG, (B) NCAPG2, and (C) NCAPH Scores in predicting diagnostic values for these genes.
Discussion
Adrenocortical carcinoma (ACC) is a rare and deadly malignancy, with most patients diagnosed at an advanced stage, contributing to its poor prognosis and high mortality rates. This study aimed to comprehensively investigate the potential roles of Non-SMC Associated Condensin Complex (NCAP) family genes in ACC. By employing a multifaceted approach, including microarray data analysis, survival and stage assessments, construction of protein-protein interaction networks, enrichment analysis, correlation, and the ROC curve analysis, we sought to shed light on the involvement of these genes in ACC and their clinical implications.
The complexity of tumorigenesis involves intricate genetic and molecular changes. Among the 6 NCAP family genes, including NCAPG, NCAPG2, NCAPH, NCAPH2, NCAPD2, and NCAPD3, recent studies have highlighted their possible significance in various clinical disorders.23-25
These observations imply that NCAP family genes may indeed participate in carcinogenesis, tumor growth, and aggressiveness, making them potential candidates for therapeutic targeting.31,32
In our study, the initial step involved the acquisition of 2 microarray datasets, GSE33371 and GSE12368, from the GEO database. These datasets contained mRNA expression patterns from ACC patients, adrenocortical adenomas, and healthy tissues. Merging these datasets after appropriate normalization was essential to ensure data comparability and eliminate potential batch effects. Among the 6 NCAP family genes, NCAPG, NCAPG2, and NCAPH exhibited statistically significant overexpression when comparing ACC samples to normal and adenoma samples. In contrast, no significant changes were detected when comparing adenoma and normal tissues. These findings suggest that NCAPG, NCAPG2, and NCAPH may play vital roles in ACC, possibly acting as diagnostic markers or therapeutic targets. Evaluating the clinical relevance of these gene expression changes is of utmost importance.
Our analysis using the GEPIA database revealed a significant correlation between high expression levels of NCAPG, NCAPG2, and NCAPH and poor overall survival in ACC patients. The associated hazard ratios were notably high, underscoring their potential prognostic significance. Additionally, these genes were found to be substantially overexpressed in advanced ACC stages (stages III and IV) compared to primary stages (stages I and II). This highlights the potential of NCAP family genes as disease progression, critical for tailoring effective treatment regimens based on the stage of the disease.
We further constructed a PPI network for NCAPG, NCAPG2, and NCAPH using the GeneMANIA database. This network provided insights into potential functional associations among these genes. Subsequently, a Gene Ontology (GO) enrichment analysis indicated that these genes are closely associated with the regulation of chromosomal dynamics, segregation, separation, and condensation. These findings imply that the NCAP family genes play significant roles in controlling chromosomal dynamics and organization, which will guide future research into their precise mechanisms in ACC. The chromosomal regulatory pathway in cancer refers to the processes and mechanisms that maintain chromosome stability and integrity in normal cells, as well as how these processes become dysregulated in cancer cells. Chromosomes are structures in the nucleus of cells that carry DNA, an organism’s genetic material. They are critical in preserving the genome’s integrity and appropriate functioning. Any changes in the structure or number of chromosomes can cause genomic instability, which is a hallmark of cancer.
Correlation analysis among the differentially expressed NCAP family genes showed positive and significant relationships, suggesting potential co-regulation or interplay among these genes in ACC. Understanding these interrelationships may provide deeper insights into their combined roles in ACC development. Moreover, the ROC curve analysis demonstrated the strong discriminatory power of NCAPG, NCAPG2, and NCAPH in distinguishing between different sample types, signified by the high Area Under the Curve (AUC) values. These findings suggest their potential utility as reliable diagnostic markers for distinguishing ACC from adenoma and normal samples. However, further validation studies are necessary to confirm their diagnostic accuracy.
Limitation
Functional enrichment analysis and PPI network construction provide valuable insights into the potential roles of NCAP family genes, these analyses are based on computational predictions and database annotations, which may not fully capture the complexity of gene functions in specific biological contexts. Experimental validation of gene functions is necessary to confirm the findings. Also, the association between NCAP family gene expression levels and clinical outcomes, such as overall survival and disease stage, provides important prognostic insights. However, these findings are based on retrospective analyses and correlation studies, which do not establish causality. Prospective studies and experimental validations in clinical settings are needed to confirm the clinical relevance of these genes as prognostic markers or therapeutic targets.
While this study highlights the potential significance of NCAP family genes in ACC, the precise biological mechanisms underlying their roles remain elusive. Functional studies, including gene knockout or overexpression experiments, pathway analysis, and mechanistic investigations, are essential to elucidate the molecular pathways and cellular processes involving these genes in ACC pathogenesis. Addressing these limitations and conducting further research to validate the findings could strengthen the scientific evidence supporting the involvement of NCAP family genes in ACC and facilitate the development of targeted diagnostic and therapeutic strategies for this aggressive cancer.
Conclusion
In conclusion, this study provides substantial evidence for the significance of 3 NCAP family genes, namely NCAPG, NCAPG2, and NCAPH, in adrenocortical carcinoma. These genes exhibit higher expression levels, prognostic implications, stage-dependent expression, and involvement in critical biological processes. To fully harness the diagnostic and therapeutic potential of NCAP family genes in ACC, further research into the molecular mechanisms governing their activities is essential. This study lays the foundation for developing tailored treatments and precision medicine approaches to combat this aggressive cancer.
Footnotes
Acknowledgements
Not Applicable.
Authors contribution
All authors contributed to the study conception and design. Original draft preparation and data analysis was conducted by MA and DA. Writing, reviewing and editing of the draft manuscript was completed by MA, DA, and SF. PG supervised the writing, analyses, and revision of the manuscript. All authors commented on previous versions of the manuscript. All authors read and approved the final manuscript.
Funding:
The author(s) received no financial support for the research, authorship, and/or publication of this article.
Declaration of Conflicting Interests:
The author(s) declared no potential conflicts of interest with respect to the research, authorship, and/or publication of this article.
Ethics approval and consent to participate
Not Applicable.
Consent for publication
Not Applicable.
Availability of data and materials
The authors declare that the data supporting the findings of this study are addressed within the article.