
Abstract
Features for standard expression microarray and RNA-Seq classification are expression averages over collections of cells. Single cell provides expression measurements for individual cells in a collection of cells from a particular tissue sample. Hence, it can yield feature vectors consisting of higher order and mixed moments. This article demonstrates the advantage of using these expression moments in cancer-related classification. We use synthetic data generated from 2 real networks, the mammalian cell cycle network and a melanoma-related pathway network, and real single-cell data generated via fluorescent protein reporters from 2 cell lines, HT-29 and HCT-116. The networks consist of hidden binary regulatory networks with Gaussian observations. The steady-state distributions of both the original and mutated networks are found, and data are drawn from these for moment-based classification using the mean, variance, skewness, and mixed moments. For the real data, we only observe 1 gene at a time, so that only the mean, variance, and skewness are considered, the analysis being done for 2 genes, EGFR and ERRB2. For the synthetic data, classification improves as we move from just the mean to mean, variance, and skewness and then to these plus the mixed moments. Comparisons are done with 3, 4, or 5 features, using feature selection. Sample size effects are considered. For the real data, we only consider mean, variance, and skewness, with results improving when the higher order moments are used as features.
Introduction
Transcriptome analysis is a powerful strategy to connect genotype to phenotype of cells. Essentially, all cells share the same genetic code inherited from their ancestor, but transcriptomes of individual cells characterize a subset of genes expressed to reflect their epigenetic status or their genetic regulatory system leading to specific phenotypes.1,2 Hence, ideally, the transcriptome should be profiled for each individual cell; however, owing to technical limitations, until recently, most transcriptomic profiling has been done on bulk cells, yielding only average behavior of tens of thousands of cells. Recent advances in next-generation sequencing technologies have allowed in-depth investigation of the transcriptome at a single-cell resolution, 3 thereby opening avenues for innovative target discovery. 4 A recent theoretical analysis has compared phenotype classification based on single-cell expression trajectories with mean expression levels across multiple cells, as is the case with both ordinary RNA-Seq and expression microarrays. 5 Bulk expression measurement (multiple-cell averaging) destroys both intercell and dynamical information, and therefore using single-cell trajectories should be expected to achieve lower misclassification rates for phenotype classification. In the work by Karbalayghareh et al., 5 cell trajectory versus average cell classification is studied in the context of Boolean networks with perturbation (BNp) and, except in some cases where the network attractors have special form,6–8 single-cell trajectory data outperform average cell measurements. In practice, regulatory asynchronicity would lead to missing values. 9 Moreover, lower amounts of messenger RNA in individual cells can cause experimental issues that would also lead to dropouts. 10 Thus, the modeling in the work by Karbalayghareh et al. 5 assumes random missing values in trajectory readouts, with missing value rates as high as 50%.
Looking into the future, we should expect that nondynamical (nontrajectory) single-cell data in sufficient supply for cancer classification will become available before sufficient dynamical single-cell data. In this case, because a gene’s expression is not static, expression measurements for a gene will possess a distribution over the cell collection and not simply from measurement error. Moreover, as genes interact, they will possess a joint expression distribution. Reducing this multivariate distribution to a set of averages entails a significant compression of information. If single-cell measurements were available, then each cell would yield an expression vector, the collection of cells would yield a sample of expression vectors, sample moments (not just averages) can be computed, and moment-based classification could proceed using higher order and mixed moments. The latter can be particularly useful because they reveal interaction and the alteration of signaling pathways can significantly alter gene interaction, thereby enabling phenotype discrimination.
Methods
For moment-based classification, suppose that for each tissue,
If there are
Synthetic data via a gene regulatory network
If we assume a network model, then we can solve for the Bayes classifier and generate synthetic data to study classifier design and feature selection. 12 We shall assume Gaussian networks generated from hidden discrete networks, which we will take to be BNp 6 but which could also be probabilistic Boolean networks 8 or Bayesian networks. 13 Knowing the generating BNp allows us to study the effects of regulatory alteration, for instance, classifying between a nominal network and another resulting from mutation or drugs. Using Gaussian measurements allows us to model basal-level expressions and variability. We describe the network model for a single BNp and later return to classification with 2 BNps.
Consider a BNp with

where
When the BNp is perturbed, a different TPM will follow which results in a different steady-state distribution. We refer to the steady-state distribution for the unperturbed and perturbed BNps as
If there are
In this study, we generate synthetic data using 2 pathway networks: Pathway Network 1 (PN1) is a mammalian cell cycle network and Pathway Network 2 (PN2) is melanoma-related pathway network (Figure 1). Both of these have been previously proposed and described. 14 Briefly, PN1 includes a few key genes in the mammalian cell cycle whose signals and controls play a critical role in cell growth, among which P27 is active in the absence of the cyclins and blocks the action of CycE or CycA. When P27 is mutated and always off, it introduces a mutated phenotype where the growth factors are inactive. On the other hand, PN2 focuses on gene Wnt5a, which has been found to be highly discriminating between cells with properties typically associated with high versus low metastatic competence, as validated in melanoma cells. A different type of perturbation is applied to PN2, where we added the regulatory predictor Ret1 for S1000p (dashed arrow from Ret1 in Figure 1) as a function wiring modification. A summary of these networks is shown in Table 1.
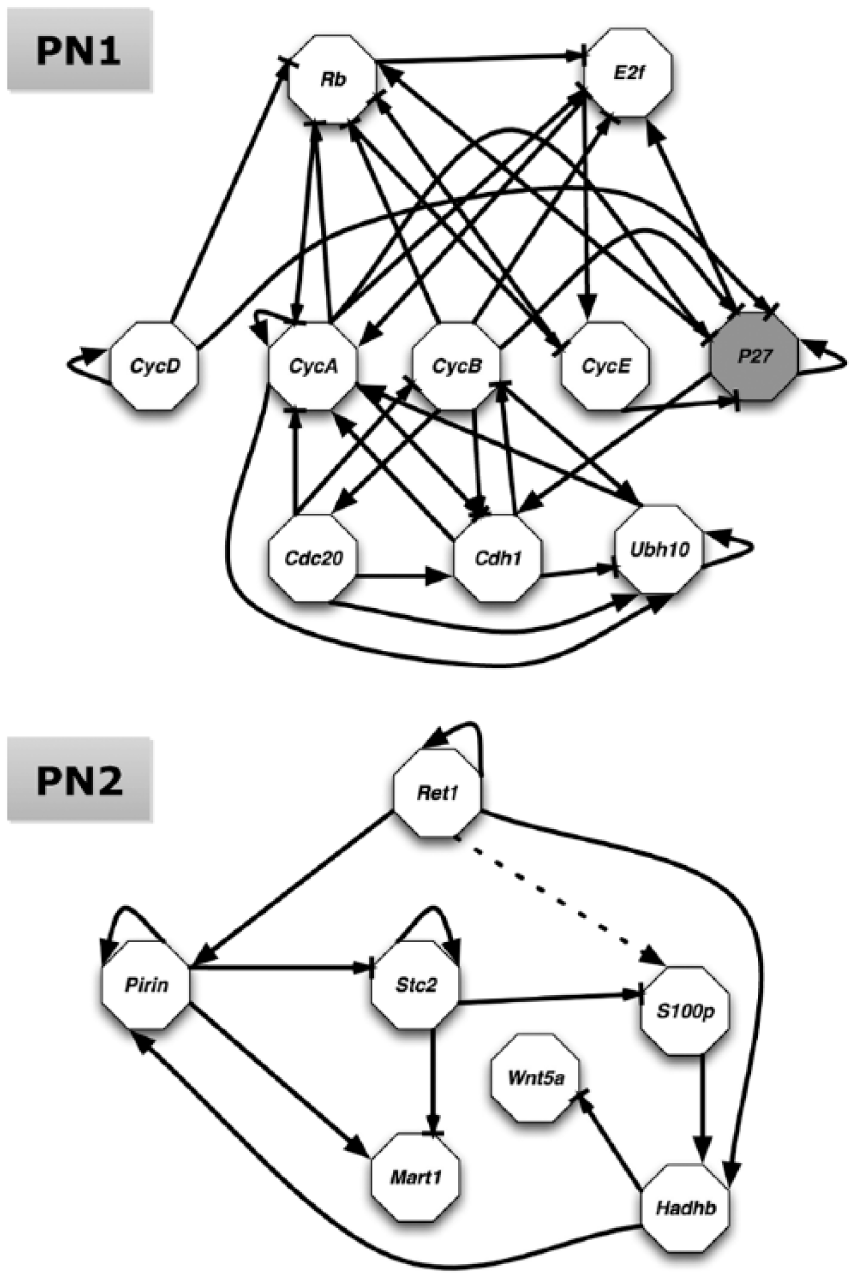
Logical regulatory network graphs for a mammalian cell cycle network (PN1) and a melanoma-related pathway network (PN2), modified from Figures 3 and 1 in Qian and Dougherty, 14 respectively. An arrow represents activation regulation, whereas an arrow ending with a bar represents inhibition. A different steady-state distribution resulted from P27 stuck-at-0 change (shaded node in PN1) or regulatory change (dashed arrow in PN2). PN1 indicates Pathway Network 1; PN2, Pathway Network 2.
A summary of the pathway networks in this study.

Real data from fluorescent protein reporters
Ideally, single-cell RNA-Seq technology could be used to profile the whole transcriptome of hundreds of cells from individual patients/cell lines. However, because this technology is still under intensive development and not widely adopted with a common protocol, current publicly available single-cell RNA-Seq data sets are generated to demonstrate the ability of a certain methodology, usually the amount and quality of cells profiled per patient/cell line. As a result, these data sets contain extremely small numbers of patient/cell line sample points per phenotype, usually 1 or 2, thus thwarting any effort for realistic classification based on such data. Thus, in this study, we use an in-house data set collected through a high-content imager that tracks a given gene’s transcription level in individual cancer cells via fluorescent protein reporters.15,16
Prior to the introduction of single-cell RNA-Seq, fluorescent protein reporters, along with single-molecule fluorescent in situ hybridization and single-cell quantitative polymerase chain reaction, have been the most common approaches to examine transcriptional heterogeneity among cells.17–20 In the fluorescent technology, the protein reporter is assembled by fusing the coding sequence of a fluorescent protein reporter with the promoter region of the target gene and then transfecting it into target cells. The abundance of the fluorescent protein indicates the transcriptional level and it can be captured by an epifluorescent microscope. In our experimental setup, each cell is transfected with just one reporter to follow the transcription of one specific target gene. The fluorescent images are commonly taken as 2-color image pairs with a blue channel for the nuclei and a green channel for the fluorescent reporters. Then, the expression levels of individual cells are extracted using an in-house software that first identifies the individual nuclei in the nuclei channel and then extracts the corresponding fluorescent protein signal in the other channel.
Compared with single-cell technology, the fluorescent protein reporter technology detects only 1 gene, rather than the whole transcriptome. An advantage of a high-content imager is that one can capture the transcriptional activities in many wells on the plate simultaneously, where each well is an independent sample point from the corresponding cell line. With this size, we can test the potential of moment classification, even with just a single gene. The drawback is that there are no second-order mixed moments. Nonetheless, we can test moment classification using the first 3 moments and demonstrate its advantage over classification using only the mean.
Our simulation study involves 2 cell lines, HT-29 and HCT-116, that are resistant and sensitive to the drug lapatinib, respectively. Lapatinib is a cancer drug that has been approved for treating breast cancer by inhibiting Egfr and Erbb2, 2 membrane-bound protein receptors commonly associated with cancer. Thus, we have selected Egfr and Erbb2 as the 2 genes to be profiled. Because each cell has only 1 fluorescent protein, Egfr and Erbb2 expressions are profiled separately. The number of wells (sample points) available for each (cell line, gene) combination from our experiment is shown in Table 2. The images are taken 2 hours before lapatinib is added.
Number of wells/samples measured for every gene and cell line.

Median number of cells per well: 247.
Results and Discussion
Synthetic data
To compare classification error rates using features from different moments, we repeatedly sample
Figure 2 shows data plots for network PN1, with sample size

The 3-dimensional scatterplots for network PN1 sample points, with sample size
Average error rates
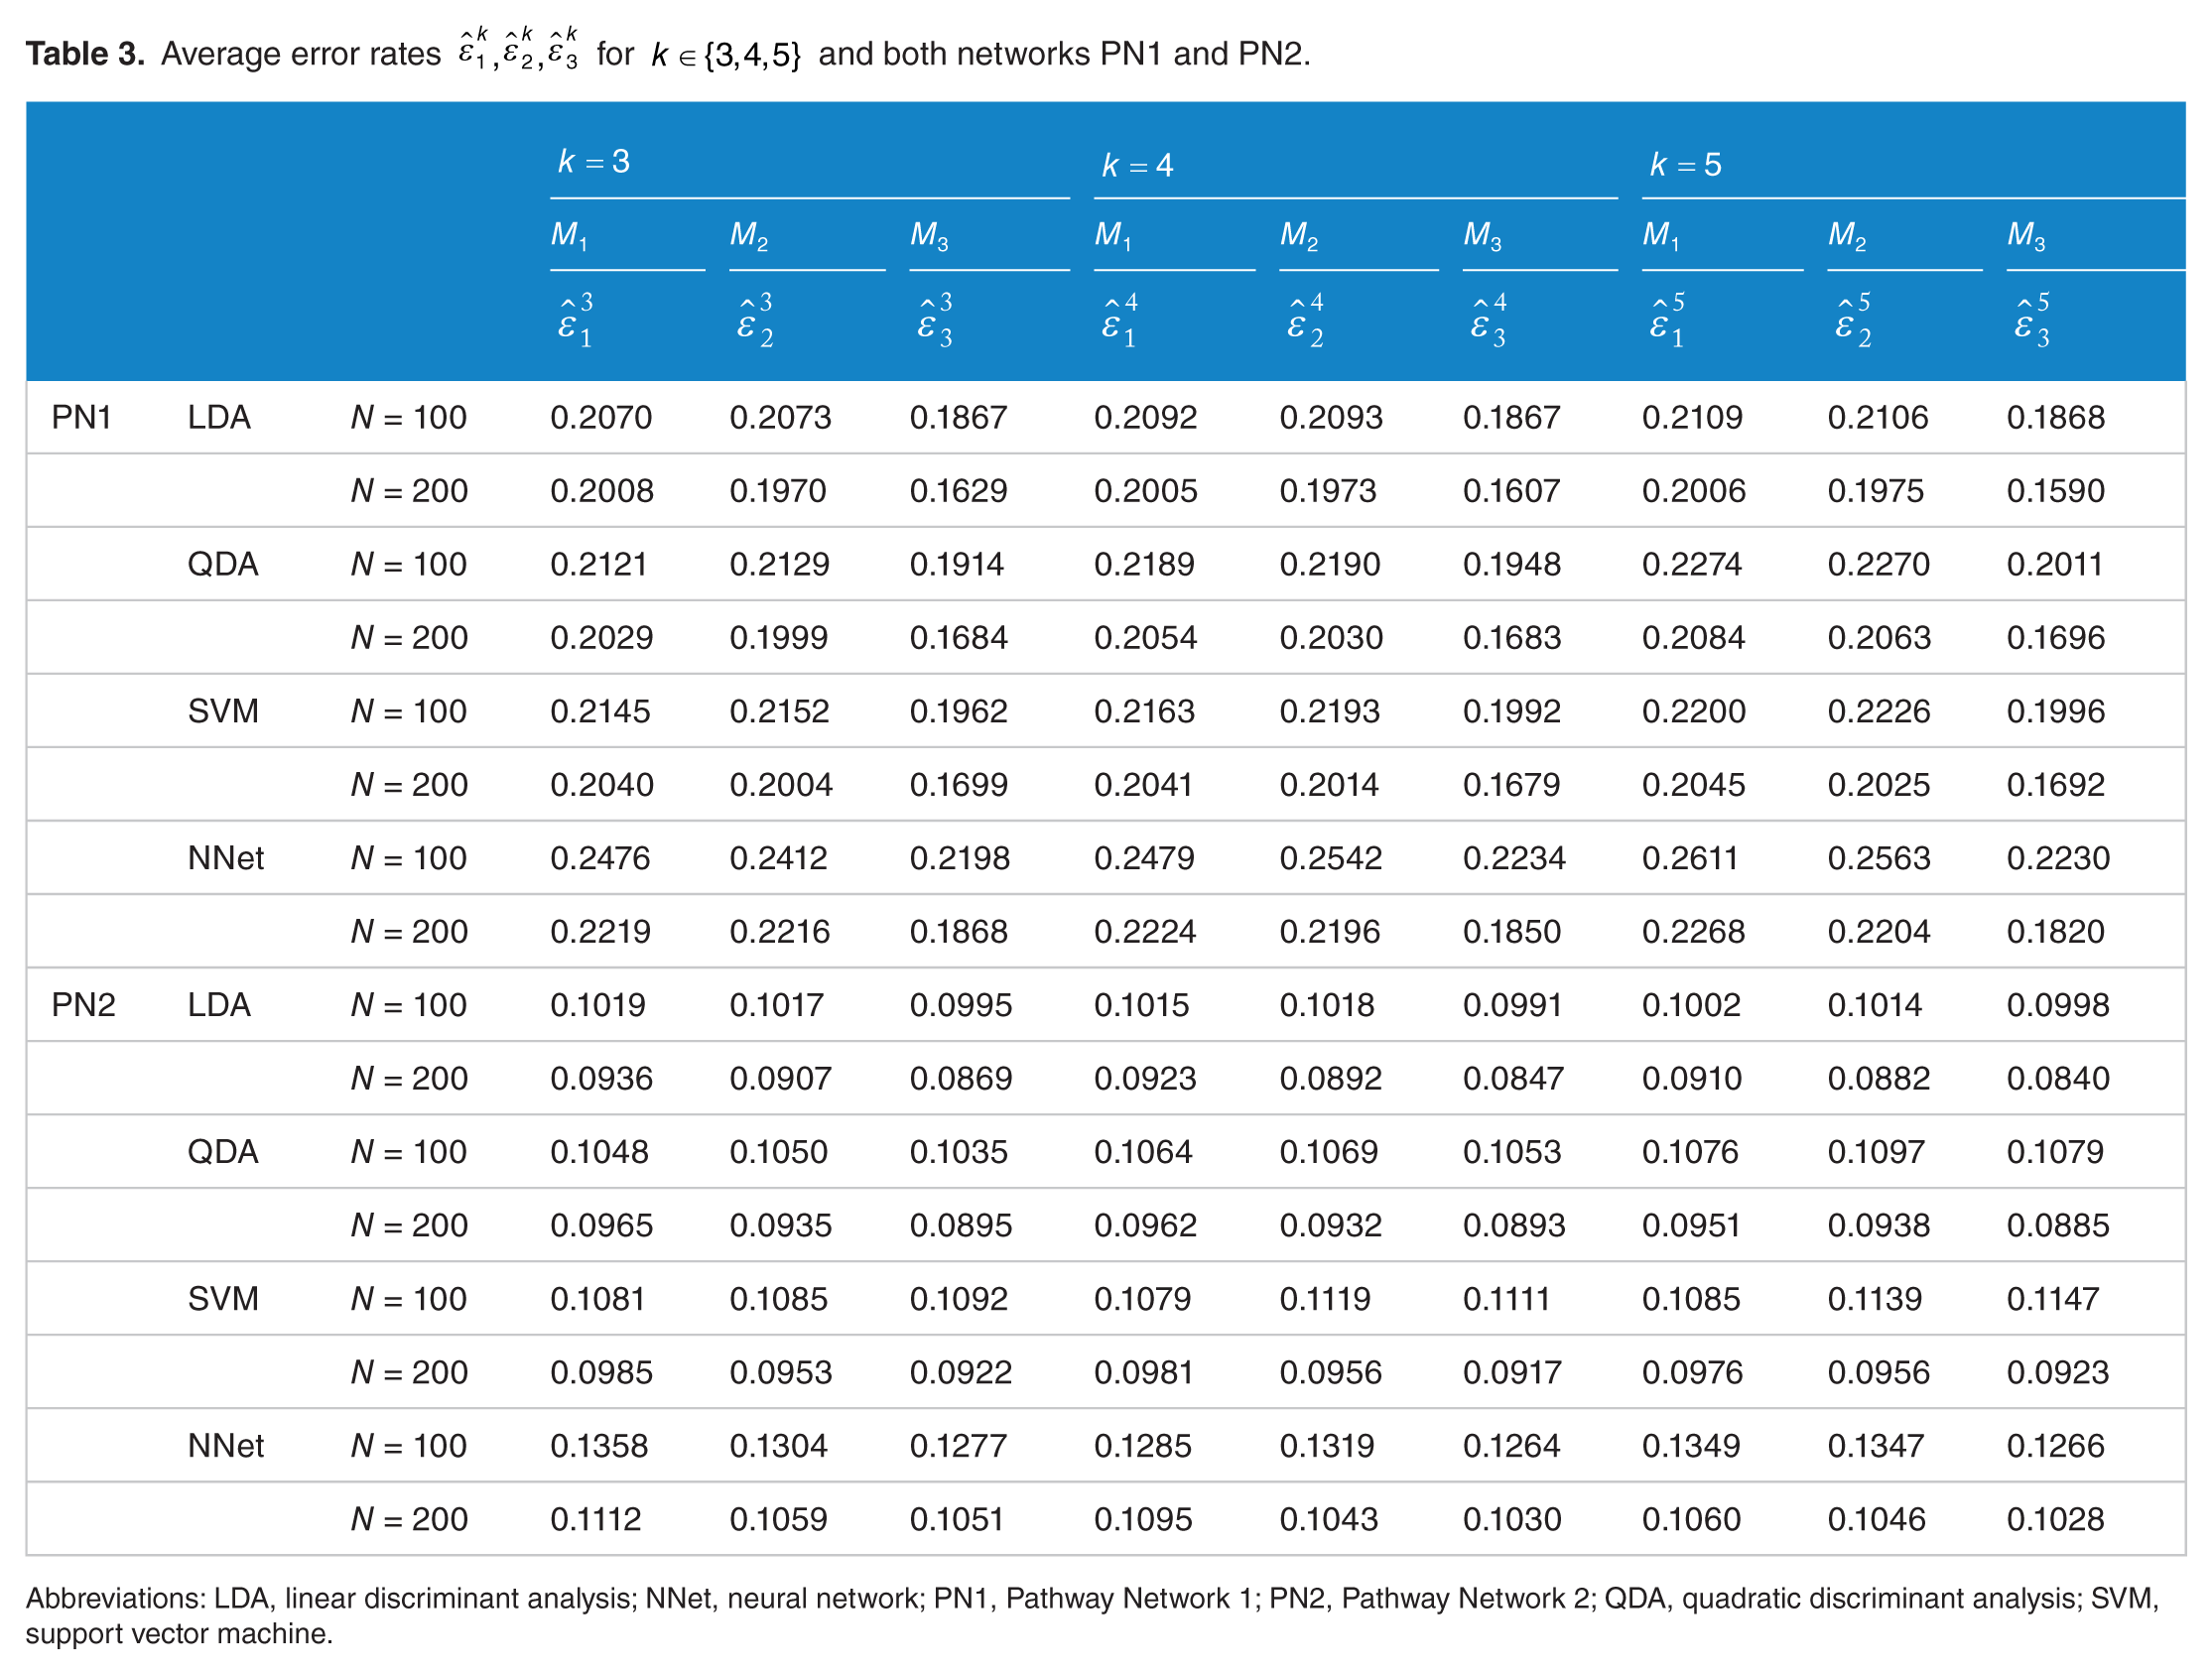
Abbreviations: LDA, linear discriminant analysis; NNet, neural network; PN1, Pathway Network 1; PN2, Pathway Network 2; QDA, quadratic discriminant analysis; SVM, support vector machine.
A considerable amount of insight can be gleaned from Table 3. Focusing first on PN1 with
For the smaller sample size
Similar effects are seen for network PN2 with LDA but the improvement is significantly less for PN2 as compared with PN1. In part this is because the overall error rates are much smaller and, perhaps, in part because there are less mixed moments to choose from or because there are no strong mixed-moment effects due to regulatory change (which can happen if the effects of the regulatory change are spread out in the steady-state distribution).
To get a better sense of the contribution of extra features resulting from single-cell classification, in Figure 3, we have plotted the distributions

Distribution plots
QDA, SVM, and NNet show similar behavior to that of LDA for network PN1 and
Real data
For the fluorescent imaging data, as we have profiled 1 gene for each cell, for each case, there are 3 features associated with that gene: mean, variance, and skewness. To test the potential of moment-based classification, we have tested all 7 feature combinations: mean, variance, skewness, mean plus variance, mean plus skewness, variance plus skewness, and all 3 features. Linear discriminant analysis is used for classification (QDA performs poorly on account of small sample size). The 10-fold cross-validation averaged over 10 repeats has been used to estimate errors. The simulation results are summarized in Table 4.
Classification error rates for linear discriminant analysis on all possible feature combinations for Egfr or Erbb2, based on 10-fold cross-validation repeated for 10 times.
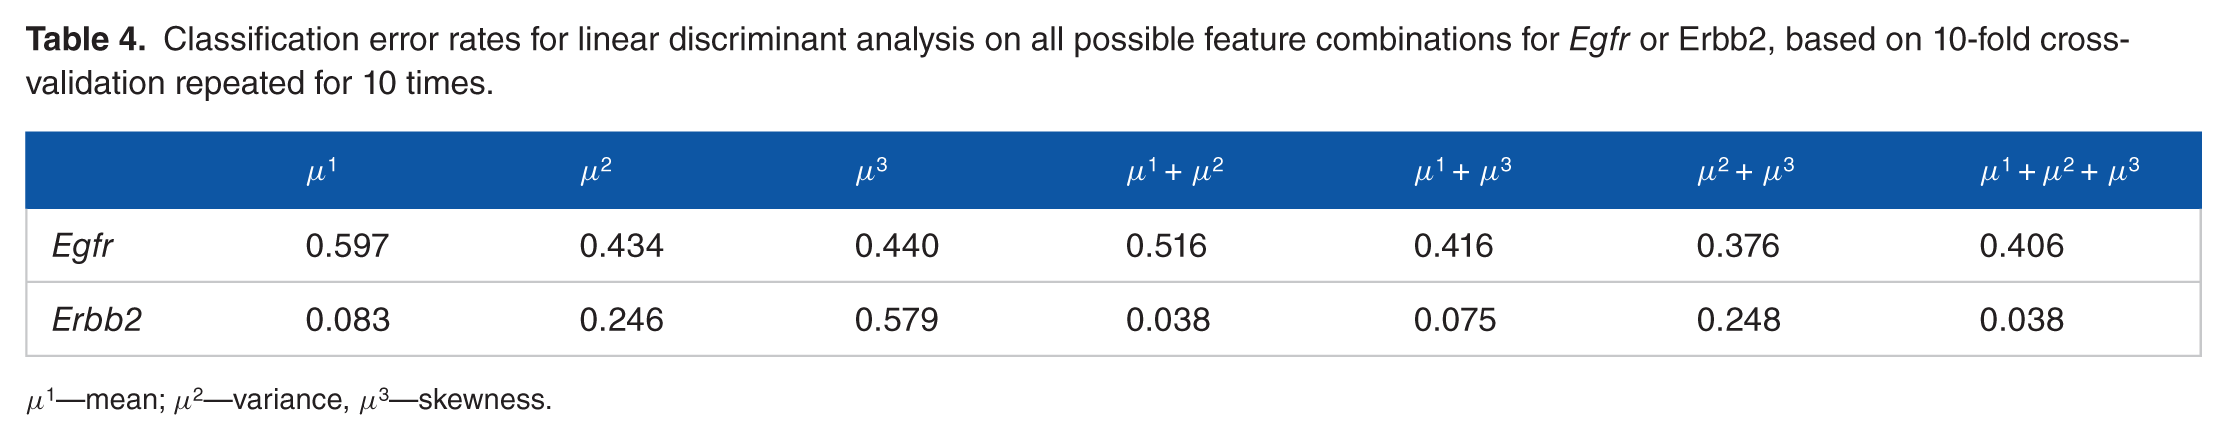
With higher moments added to the feature pool, classification performance can improve significantly. For Egfr, it is hard to classify with only the mean. Using variance and skewness, classification performance improves from
Conclusions
The advent of single-cell expression measurement creates the potential for high-throughput expression-based classification with much greater accuracy than simply using mean expression over many cells. As we have demonstrated with both synthetic data generated from real networks and real single-cell data, higher order moments can improve moment-based classification, and the inclusion of mixed moments can make a more substantial improvement, not only because there are simply more features but also because mixed moments can capture gene-gene regulatory differences. Hopefully, these results will spur the development of more sophisticated single-cell technology so that practical sample sizes can be efficiently generated.
Footnotes
Author Contributions
CS, JH, and MLB generated the real data. CS and JH performed the computations. CS, JH, SK, and ERD drafted the manuscript. All authors discussed the results and commented on the final manuscript.
Funding:
The author(s) disclosed receipt of the following financial support for the research, authorship, and/or publication of this article: This work has been supported in part by the TEES-Agrilife Center for Bioinformatics and Genomic Systems Engineering (CBGSE).
Declaration of conflicting interests:
The author(s) declared no potential conflicts of interest with respect to the research, authorship, and/or publication of this article.