
Abstract
Introduction:
One of the most pressing goals for cancer immunotherapy at this time is the identification of actionable antigens.
Methods:
This study relies on the following considerations and approaches to identify potential breast cancer antigens: (i) the significant role of the adaptive immune receptor, complementarity determining region-3 (CDR3) in antigen binding, and the existence cancer testis antigens (CTAs); (ii) chemical attractiveness; and (iii) informing the relevance of the integration of items (i) and (ii) with patient outcome and tumor gene expression data.
Results:
We have assessed CTAs for associations with survival, based on their chemical complementarity with tumor resident T-cell receptor (TCR), CDR3s. Also, we have established gene expression correlations with the high TCR CDR3-CTA chemical complementarities, for Granzyme B, and other immune biomarkers.
Conclusions:
Overall, for several independent TCR CDR3 breast cancer datasets, the CTA, ARMC3, stood out as a completely novel, candidate antigen based on multiple algorithms with highly consistent approaches. This conclusion was facilitated by use of the recently constructed Adaptive Match web tool.
Introduction
Breast cancer is one of the leading causes of death among women in United States. According to the World Health Organization, breast cancer is the most commonly diagnosed type of cancer globally. Moreover, the incidence of breast cancer has been increasing in recent years, leading to increased suffering, and to economic burdens. 1 Thus, despite significant advances in the detection and treatment of primary breast cancer, additional prevention and treatment advances remain very important goals, and especially in the case of metastatic breast cancer, very challenging goals. Specifically, subsets of aggressive breast cancers, such as triple negative breast cancer (TNBC), can present with T-cell infiltrates, and can be responsive to immune checkpoint blockade (ICB). 2 Responsiveness is possible even with metastatic tumors. 2 However, ICB responsiveness varies, for example in the TNBC setting, and at this time, there is no marker, including immune checkpoint protein expression, that defines the subset of ICB responsive patients. 2
For several cancers, the general mutation burden can be predictive of immunotherapy responses,3-9 however, this is by no means a pan-cancer opportunity. Thus, given basic advances in breast cancer immunotherapy, but with indicators of success still lacking, it is possible that a further understanding of specific, potential antigenic targets will improve treatment protocols. Regarding this report, cancer testes antigens (CTAs) are relatively novel proteins to consider in the overlap of the breast cancer and immunotherapy settings. CTAs are normally expressed in benign testis and placenta; and CTAs show aberrant expression in many malignancies, including breast cancer. 10 Many studies have also shown that the CTAs are highly immunogenic, 11 that is, CTAs have been established as antigenic in conventional, in vitro, or preclinical assays, over decades.
For the most part, breast cancer represents a B-cell response,12-14 and detailed immunogenomics parameters that might be applied to patients receiving immunotherapies are largely limited to B-cell features, for example, chemical complementarity between B-receptors (BCRs) and TP53 mutants. 15 The reasons for comparatively less knowledge of the specificity of the T-cell response to primary breast cancer are largely unknown but could involve a technical issue, such as the timing of the immune response versus common periods of breast cancer detection; or a biological issue, such as a lower numbers of T-cells in general, participating in the breast cancer immune response.
In this report, we applied a novel algorithm 16 to an assessment of the T-cell receptor alpha (TRA) and T-cell receptor beta (TRB) chemical complementarities to CTAs. The complementarity assessment algorithm focuses on the amino acids (AA) of the complementarity determining region-3 (CDR3) regions of the tumor resident TRA and TRB polypeptides, as the CDR3 AAs are most important for antigen binding. Also, by focusing on the assessment of the CDR3, it is possible to inform very large CDR3 datasets with survival, and other patient information. This approach also incorporates the same antigen, or sets of antigens, for the entire patient population, rather than focusing on a subset of cases that may have an AA substitution as a neoantigen. By employing the entire case set, for several breast cancer datasets, the statistical signal above noise was detectable, and provided evidence of T-cell specificity, in particular for a CTA never before associated with breast cancer immunology, namely ARMC3.
Methods
Isolation of the adaptive immune receptor (IR) recombination reads
The programmatic extraction of the adaptive IR recombination reads, from exome (WXS) files, and the identification of the CDR3 domains, has been extensively described.13,17-20 The software used for the extraction is freely available at https://github.com/bchobrut-USF/blanck_group. And, there is a container version of the software at https://hub.docker.com/r/bchobrut/vdj. The complete collection of TRA and TRB recombination data extracted from the TCGA and CMI-MBC datasets, except for the actual nucleotide sequences, is available in the supporting online material (SOM, Tables S1A, S1B). The access to the TCGA-BRCA WXS files (phs000178) was via database of genotypes and phenotypes (dbGaP) approval number 6300; and the access to the CMI-MBC (phs001709) was via dbGaP approval number 25670. These 2 datasets are accessible via the genomic data commons: https://portal.gdc.cancer.gov/repository.
Assessment of the chemical complementarity of the CDR3 AA sequences and candidate CTAs
The electrostatic, sliding window, complementarity scores (SW-CSs) were determined as described by Chobrutskiy et al, and colleagues,
16
using software freely available at https://github.com/bchobrut/brca_swcs. In all cases, unless specified in
Adaptivematch.com construction and use
Biochemical complementarity between the immune receptor CDR3s and candidate antigens was scored using the sliding-window complementarity scoring method as first described. 16 Briefly, a hybrid array was generated for each AA sequence, as follows. First a linear array representing single-residue electrostatic charges at pH 7.0 was generated, then a second array representing a 3-residue frame average of electrostatic charges was generated. These 2 arrays were compared and the value with the furthest absolute value from zero (most positive or most negative) for each position was used to generate the final, hybrid electrostatic charge array. This approach allowed a charge influence for close but not directly aligned AAs in the subsequent CS calculations, while keeping the higher value, for example, a negative or positive singularity, for a direct alignment of charged AAs. To assess electrostatic complementarity of the CDR3 AA sequence and any other candidate, epitope AA sequence, a pairwise alignment between final, hybrid electrostatic charge arrays of those 2 AA sequences was performed. This alignment was repeated in single AA steps, for the AA sequences represented by the CDR3, as illustrated in an mp4 file of the supporting online material (SOM) of ref. 16 The most negative product, that is, a highly positive charge multiplied by a highly negative charge, derived from the repeated, and tested alignments of the CDR3 AA and candidate antigen sequences was defined as the most biochemically complementary interaction, that is, the electrostatic CS for that pair. The arithmetic sign of the product was inverted to produce a final, high score. The above array generations, alignments, and CS calculations were performed for every CDR3 and antigen in the input files for the adaptivematch.com web tool, which conducts the indicated mathematical manipulations.21,22 Adapivematch.com processing includes the above steps for Uversky hydropathy values representing all AAs, 23 thereby providing a hydropathy CS; and performs the calculations for combination electrostatic-hydropathy CSs. To calculate the combination CS, the same sliding window CS process was repeated using both the electrostatic charge arrays and hydrophobicity arrays to generate a summed combination CS for each CDR3-candidate antigen pair. In sum, the adaptive match web tool will output the maximal product of the 3 above chemical assessments, with 3 scores: electrostatic, hydrophobic, and combo CS for each CDR3-candidate antigen pair for the inputted datasets. Examples of adaptivematch.com files are in the SOM, as follows: Table S2, input CDR3 AA sequences; Tables S3 and S4, example, input candidate antigen AA sequences; Table S5, input survival data; Table S6, CS output; Table S7, example spot checking of CSs. Note, Tables S2 to S5 are provided as PDFs and would have to be converted to csv files for use as input at adaptivematch.com. Finally, the adaptivematch.com web tool has been extensively benchmarked in Eakins et al 24 and has been used for projects described in Patel et al, 21 Huda et al, 22 Barker et al. 25
Kaplan-Meier analyses for figure preparation
The results obtained via adaptivematch.com were verified with GraphPad prism, which was used to produce the KM analyses in the article figures, as in numerous previousreports.15,16,18,23,26 In general, for the CS results, the KM analysis is done to compare survival probability for the upper and lower 50th percentiles. In the case of the electrostatic CSs, the 50th percentile breakpoint often occurred where the numerical value of the score did not change, on either side of the 50th percentile, with respect to the case ID count. In these cases, the 50th percentile breakpoint was established as the last case ID representing a numerical value, before a change in the numerical value, going from high CS to low CS. Thus, for all electrostatic CS upper 50th percentile groups, the number of the cases is higher than in the lower 50th percentile groups. This breakpoint adjustment was not applied as often to the combo CSs because the combo CS calculations produced highly precise values (due to the great variety of Uversky hydropathy assignments for AAs 23 ) where the breakpoint for the 50th percentiles much less often represented a combo CS value that was the same above and below that breakpoint.
Multivariate analysis
The multivariate analyses were conducted exactly as described. 27 Briefly, the IBM statistical package for the social sciences, version 27 was used. Combo CS values and age were treated as continuous variables and the remaining variables were treated as categorical variables.
Results
ARMC3 as a candidate antigen
We reasoned that a CTA that was facilitating survival via its interaction with the immune system would be expressed at a relatively high level in the breast cancer tumor samples. Thus, we first determined whether the expression levels of any CTAs correlated with the overall survival (OS) or disease-free survival (DFS) probabilities for breast cancer with respect to upper versus lower 50th percentile for mRNA expression, based on the RNAseq values for the TCGA-BRCA (Firehose legacy) dataset, available at cbioportal.org.28,29 Among a set of approximately 280 CTAs established at http://www.cta.lncc.br/, ARMC3 expression stood out as representing a strong distinction for survival rates for both OS and DFS (Figure 1A, DFS, logrank P-value = .0105 and Figure 1B, OS, logrank P-value = .0147). We next compared the OS and DFS rates for case IDs representing high electrostatic complementarity, for ARMC3, and tumor resident TRA and TRB CDR3s, versus low electrostatic complementarity, based on the sliding window, complementarity scoring algorithm of Chobrutskiy et al
16
and additional information in

Kaplan-Meier (KM) analysis of OS and DFS for TCGA-BRCA case IDs based on ARMC3 RNA expression levels and the electrostatic CSs of ARMC3 and tumor resident, TRA, TRB CDR3s: (A) KM analysis of DFS for case IDs representing the upper (black, n = 505) and lower (gray, n = 493) 50th percentiles of ARMC3 RNA expression (P-value = .0105). Median DFS time represented by the upper 50th percentile, undefined; median DFS time for lower 50th percentile, 168.1 months, (B) KM analysis of OS for case IDs representing the upper (black, n = 547) and lower (gray, n = 542) 50th percentiles of ARMC3 RNA expression (P-value = .0147). Median OS time represented by the upper 50th percentile, 130.1 months; median OS time for lower 50th percentile, 114.7 months, (C) Comparison of DFS for case IDs representing the upper (black, n = 352) and lower (gray, n = 347) 50th percentiles of electrostatic CSs for TRA, TRB CDR3s and ARMC3 16 (logrank p-value = .019). Median DFS time represented by the upper 50th percentile, undefined; median DFS time for lower 50th percentile, 214.7 months, and (D) Comparison of OS for case IDs representing the upper (black, n = 381) and lower (gray, n = 380) 50th percentiles of electrostatic CSs for TRA, TRB CDR3s and ARMC3 (logrank p-value = .0860). Median OS time represented by the upper 50th percentile, 244.9 months; median OS time for lower 50th percentile, 122.7 months. The CSs of Figure 1C and D were based on the WXS-based TRA, TRB CDR3s (Table S1A, S2).
We next considered the possibility that a productive TCR CDR3-ARMC3 interaction would be consistent with the expression of immune biomarkers. The RNA expression of a panel of immune markers was analyzed to see if there were Pearson’s correlations with the electrostatic CSs for TCR-ARMC3. Results indicated higher RNA expression of certain immune markers (GZMA, CD4, CD8A, CIITA, ICOS, CTLA4, CD3D, GZMB) with increasing electrostatic CS values (Table 1), with GZMB in particular indicating a likely relationship between high CS and T-cell mediated cytotoxicity.
Immune biomarker RNA expression associated with increasing electrostatic CS values for the ARMC3 based CSs, using the TRA, TRB CDR3s sourced from the TCGA-BRCA WXS files (Tables S1A, S2, S8).

Adding a hydrophobicity component to calculation of the electrostatic TRA, TRB CDR3-ARMC3 CSs
To further understand the potential application of the basic algorithm, and to enhance the capability of the algorithm to distinguish patient groups, the above indicated, electrostatic complementarity scoring process was augmented with a hydrophobicity component
23
(
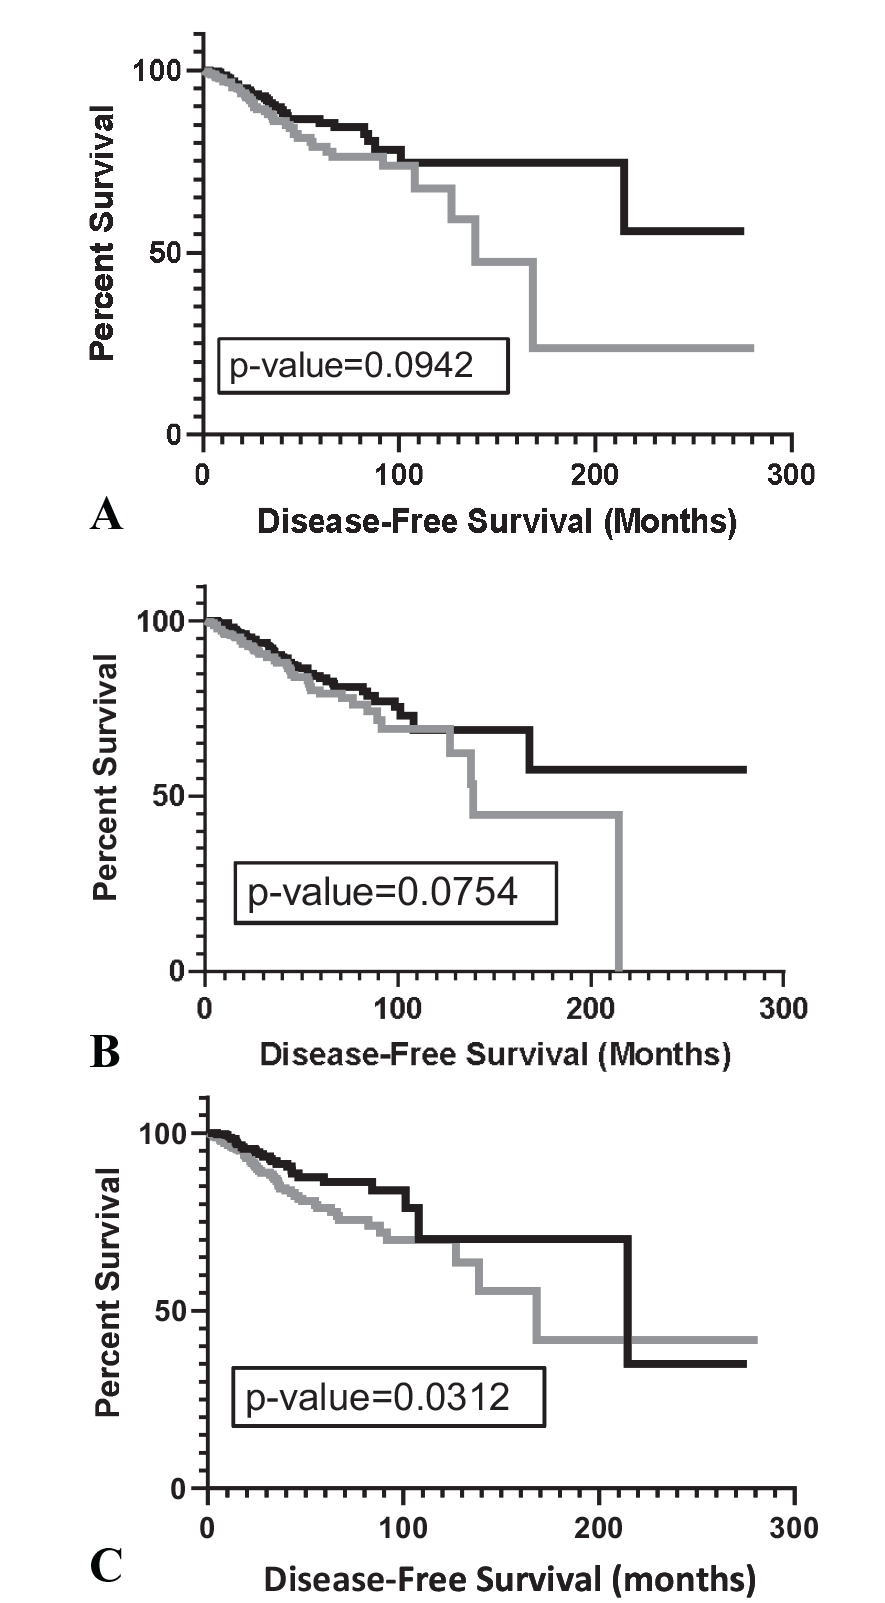
KM analysis of TCGA-BRCA case IDs based on the combo CSs representing CDR3s obtained from either WXS files or RNAseq files: (A) Comparison of DFS for case IDs representing the upper (black, n = 350) and lower (gray, n = 350) 50th percentiles of combo CSs based on TRA, TRB CDR3s from WXS files and ARMC3 (logrank P-value = .0942). Median DFS time represented by the upper 50th percentile, undefined; median DFS time for lower 50th percentile, 138.8 months, (B) Comparison of DFS for case IDs representing the upper (black, n = 487) and lower (gray, n = 478) 50th percentiles of combo CSs based on TRA, TRB CDR3s obtained from TCGA-BRCA RNAseq files 30 and ARMC3 (logrank P-value = .0754). Median DFS time represented by the upper 50th percentile, undefined; median DFS time for lower 50th percentile, 138.76 months, and (C) Comparison of DFS for case IDs representing the upper (black, n = 352) and lower (gray, n = 348) 50th percentiles of ARMC3 combo CSs, where the combo CS is represented by the average combo CS for a given case ID (rather than the maximal CS available for a given case ID). TRA, TRB CDR3s were sourced from WXS files (logrank P-value = .0312). Median DFS time represented by the upper 50th percentile, 214.7; median DFS time for lower 50th percentile, 168.1 months.
Assessing the CS algorithm with non-TCGA data
We next sought to understand the CS algorithm in terms of variations in the calculation approach. In particular, we considered the possibility that sourcing the CDR3s from case IDs where the recovery of TRA and TRB recombination reads could be very robust, selecting the maximal CS for each case ID would reduce the opportunity to establish survival distinction among the cases. Thus, we considered assessing the average CDR3-ARMC3 CS, from among every CS for a given case ID, rather than assessing potential survival distinctions based on the maximal value of the combo CS, for each case ID, as was done for all KM analyses above. Indeed, the average of the case ID combo CSs, using the WXS-based TRA, TRB CDR3s, indicated a survival distinction for the upper and lower 50th percentiles of combo CSs, with the upper 50th percentile representing a greater DFS probability (Figure 2C, logrank P-value = .0312), demonstrating some versatility and reduction of constraint for the basic approach. Finally, to further replicate the basic results of the CS algorithm, namely to establish a CS based biomarker for ARMC3, for assessing survival distinctions, the combo CS approach was used to determine whether it was possible to distinguish subgroups of a non-TCGA breast cancer dataset, in this case, the CMI-MBC dataset (Table S1B,
Reduced association of high, average ARMC3-related, combo CSs with metastatic breast samples, based on TRA and TRB CDR3s, sourced from the CMI-MBC RNAseq files.

Assessing the association of ARMC3 segment CSs with survival probabilities
We next considered the possibility that segments of the ARMC3 protein sequence would vary in their CSs and in the association of those CSs with survival distinctions. Thus, we divided the ARMC3 protein sequence into 15 segments (Table S4) and evaluated each segment for combo TRA, TRB CDR3-ARMC3 segment CSs, and their survival associations. This approach indicated that 1 segment, Segment 14, had a strong combo CS association with survival distinctions (Figure 3A, OS logrank P-value = .039; Figure 3B, DFS logrank P-value = .0451). These results were replicated when using the TRA, TRB CDR3s sourced from the TCGA-BRCA RNAseq files 30 (Figure 3C, OS logrank P-value = .0043; Figure 3D DFS, logrank P-value = .0194).

KM analysis of OS and DFS based on combo CSs for ARMC3 AA Segment 14 (GHVKKGIFYHRALLFKALADRIGIGCSLVRGEYGRAWNEVMLQNDSRKGVIGGLPAPEMY) (Table S4): (A) Comparison of OS for TCGA-BRCA case IDs representing the upper (black, n = 382) and lower (gray, n = 380) 50th percentiles of the combo CSs for ARMC3 Segment 14 (logrank P-value = .039), with the CSs based on the TRA, TRB CDR3s recovered from WXS files. Median OS time represented by the upper 50th percentile, 216.6 months; median OS time for lower 50th percentile, 129.6 months, (B) Comparison of DFS for TCGA-BRCA case IDs representing the upper (black, n = 382) and lower (gray, n = 380) 50th percentiles of combo CSs for ARMC3 Segment 14 (logrank P-value = .0451), with the CSs based on the TRA, TRB CDR3s recovered from the WXS files. Median DFS time represented by the upper 50th percentile, 216.6 months; median DFS time for lower 50th percentile, 129.6 months, (C) Comparison of OS for TCGA-BRCA case IDs representing the upper (black, n = 525) and lower (gray, n = 527) 50th percentiles of combo CSs for ARMC3 Segment 14 (logrank P-value = .0043), where the CSs were based on the TRA, TRB CDR3s recovered from the RNAseq files. 30 Median OS time represented by the upper 50th percentile, undefined; median DFS time for lower 50th percentile, 113.7 months, and (D) Comparison of DFS for TCGA-BRCA case IDs representing the upper (black, n = 525) and lower (gray, n = 527) 50th percentiles of combo CSs for ARMC3 Segment 14 (logrank P-value = .0194), where the CSs were based on the TRA, TRB CDR3s recovered from the RNAseq files. Median DFS time represented by the upper 50th percentile, undefined; median DFS time for lower 50th percentile, 138.8 months.
Multivariate analysis
Multivariate analysis of clinical factors for case IDs and ARMC3-based CSs was performed. For the ARMC3 CSs, the combo CSs for Segment 14 (Figure 3) were used. The clinical factors included age, race, menopause, and stage of the breast cancer. Results indicated that only the tumor stage and the ARMC3 based CS represented independent factors associated with survival distinctions (Table 3).
Multivariate analysis including the Segment 14, combo CS variable.

Abbreviation: NA, not available. A total of 607 TCGA-BRCA cases were available with the complete set of data for this analysis.
Application of the CS algorithm to other CTAs in breast cancer
We identified 3 additional CTAs that represented a DFS distinction, when comparing the upper and lower 50th percentiles for RNA expression, where the case IDs representing the higher level of CTA expression all represented increased DFS probability: ROPN1 (P-value = .0055), POTEH (P-value = .0135), TPPP2 (P-value = .0210). We next assessed the relationship of the CSs to survival distinctions, where the CSs were based on the WXS-based TRA, TRB CDR3s, and the above indicated CTAs. For each of the 3 CTAs, results of a KM analysis indicated better DFS probabilities with a higher CS (ROPN1, Figure 4A, P-value = 0.0307; POTEH, Figure 4B, P-value = .0129; TPPP2, Figure 4C, P-value = .0382).

KM analysis for TCGA-BRCA case IDs based on the CSs for the CTAs, ROPN, POTEH, TPPP2: (A) KM analysis of DFS for case IDs representing the upper (black, n = 348) and lower (gray, n = 351) 50th percentiles of the electrostatic CSs for ROPN (P-value = .0307). Median DFS time represented by the upper 50th percentile, 214.7 months; median DFS time for lower 50th percentile, 138.8 months, (B) KM analysis of DFS for case IDs representing the upper (black, n = 353) and lower (gray, n = 347) 50th percentiles of the electrostatic CSs for POTEH (P-value = .0129). Median DFS time represented by the upper 50th percentile, 214.7 months; median DFS time for lower 50th percentile, 138.8 months, and (C) KM analysis of DFS for case IDs representing the upper (black, n = 351) and lower (gray, n = 349) 50th percentiles of the combo CSs for TPPP2 (P-value = .0382). Median DFS time represented by the upper 50th percentile, undefined; median DFS time for lower 50th percentile, 138.8 months. All CSs were based on the WXS-based TRA, TRB CDR3s (Table S1A, S2).
Discussion
The cancer-specific pattern of expression of CTAs and their extensively studied immunogenicity highlights CTAs as promising candidates for cancer immunotherapy protocols. Different CTAs have been studied in breast cancer cases to augment the plans for cancer immunotherapy and to establish basic biomarkers for prognosis. 31 However, based on the approaches used in this report, it is clear that additional CTAs should be added to breast cancer list of relevant CTAs. In particular, an overlap of 2 approaches, 1 highly novel, 16 has indicated that 4 additional CTAs (ARMC3, ROPN1, POTEH, TPPP2), not previously studied at all or not studied very extensively in breast cancer, could be useful for assessing immunotherapy outcomes or designing immunotherapies. In all 4 cases, the higher the expression level, the better the survival probability, consistent with the role of an antigen supporting an immune response; and in all 4 cases, the better the chemical relationship to a series of tumor resident TCR CDR3s, the better the survival probabilities. While the complementarity scoring process is unique, in at least 1 case, higher expression of a CTA has been correlated with better outcomes in breast cancer, 32 as well as with a higher immune infiltrate.
The chemical complementarity scoring approach used in this report was originally developed for an assessment of CDR3 complementarity with cancer mutant peptides, that is, this approach took into consideration not only the chemistry of the cancer mutant AA but also the chemistry of the wild-type AAs surrounding the cancer mutant AA. Thus, this sliding window, complementarity scoring algorithm 16 was, in effect, suited for any candidate peptide antigen, keeping in mind the integration of the complementarity scoring results with survival data, and immune biomarker gene expression. In particular, the association of the immune biomarker gene expression with high CSs, especially the expression of Granzyme B and CIITA, provide a strong indication that, at least over a large dataset, the high CSs represent T-cell killing of the tumor cells, which presumably would also be consistent with the greater survival probabilities.
The complementarity scoring process is limited, especially in taking into consideration only the chemical relationship of the tumor resident TCR CDR3s to the candidate antigen, as opposed to a more extensive assessment of the TCR binding to a candidate antigen, for example with a molecular dynamics approach or in vitro approaches. However, the CDR3 is considered the most important part of the TCR binding site, 33 and it is unlikely that there would be many candidate antigens that do not have chemical complementarity with the TCR CDR3 where the binding of such an antigen would lead to T-cell activation. Meanwhile, the chemical complementarity algorithm is highly accessible in the big data setting, now with the Adaptive Match web tool. Thus, the chemical complementarity approach, when combined with other clinical and molecular data platforms, represents a strong, and highly efficient possibility for prioritizing antigens for further study. And, the efficiency and speed of this approach offers the very rapid opportunity to narrow down on segments of whole proteins that might represent the best possible segments for the above discussed immunotherapy related goals (Figure 3).
Conclusion
Based on an integration of several big-data platforms with basic immune receptor-antigen binding principles, ARMC3 expression in particular is important to consider as reflective of an antigen that could indicate the usefulness of breast cancer immunotherapies.
Supplemental Material
sj-csv-1-cix-10.1177_11769351231177269 – Supplemental material for Chemical Complementarity of Breast Cancer Resident, T-Cell Receptor CDR3 Domains and the Cancer Antigen, ARMC3, is Associated With Higher Levels of Survival and Granzyme Expression
Supplemental material, sj-csv-1-cix-10.1177_11769351231177269 for Chemical Complementarity of Breast Cancer Resident, T-Cell Receptor CDR3 Domains and the Cancer Antigen, ARMC3, is Associated With Higher Levels of Survival and Granzyme Expression by Nagehan Pakasticali, Andrea Chobrutskiy, Dhruv N. Patel, Monica Hsiang, Saif Zaman, Konrad J. Cios, George Blanck and Boris I. Chobrutskiy in Cancer Informatics
Supplemental Material
sj-csv-2-cix-10.1177_11769351231177269 – Supplemental material for Chemical Complementarity of Breast Cancer Resident, T-Cell Receptor CDR3 Domains and the Cancer Antigen, ARMC3, is Associated With Higher Levels of Survival and Granzyme Expression
Supplemental material, sj-csv-2-cix-10.1177_11769351231177269 for Chemical Complementarity of Breast Cancer Resident, T-Cell Receptor CDR3 Domains and the Cancer Antigen, ARMC3, is Associated With Higher Levels of Survival and Granzyme Expression by Nagehan Pakasticali, Andrea Chobrutskiy, Dhruv N. Patel, Monica Hsiang, Saif Zaman, Konrad J. Cios, George Blanck and Boris I. Chobrutskiy in Cancer Informatics
Supplemental Material
sj-csv-3-cix-10.1177_11769351231177269 – Supplemental material for Chemical Complementarity of Breast Cancer Resident, T-Cell Receptor CDR3 Domains and the Cancer Antigen, ARMC3, is Associated With Higher Levels of Survival and Granzyme Expression
Supplemental material, sj-csv-3-cix-10.1177_11769351231177269 for Chemical Complementarity of Breast Cancer Resident, T-Cell Receptor CDR3 Domains and the Cancer Antigen, ARMC3, is Associated With Higher Levels of Survival and Granzyme Expression by Nagehan Pakasticali, Andrea Chobrutskiy, Dhruv N. Patel, Monica Hsiang, Saif Zaman, Konrad J. Cios, George Blanck and Boris I. Chobrutskiy in Cancer Informatics
Supplemental Material
sj-pdf-4-cix-10.1177_11769351231177269 – Supplemental material for Chemical Complementarity of Breast Cancer Resident, T-Cell Receptor CDR3 Domains and the Cancer Antigen, ARMC3, is Associated With Higher Levels of Survival and Granzyme Expression
Supplemental material, sj-pdf-4-cix-10.1177_11769351231177269 for Chemical Complementarity of Breast Cancer Resident, T-Cell Receptor CDR3 Domains and the Cancer Antigen, ARMC3, is Associated With Higher Levels of Survival and Granzyme Expression by Nagehan Pakasticali, Andrea Chobrutskiy, Dhruv N. Patel, Monica Hsiang, Saif Zaman, Konrad J. Cios, George Blanck and Boris I. Chobrutskiy in Cancer Informatics
Footnotes
Acknowledgements
Authors thank USF research computing and Ms. Corinne Walters, for administrative assistance with the NIH approval process for dataset access. Authors thank the taxpayers of the State of Florida.
Correction (July 2023):
The X-axis label of figures panels 1A and 2C have been updated.
Funding:
The author(s) received no financial support for the research, authorship, and/or publication of this article.
Declaration of conflicting interests:
The author(s) declared no potential conflicts of interest with respect to the research, authorship, and/or publication of this article.
Authors’ Contributions
NP: Formal analysis; Methodology; Visualization; Writing—review & editing Methodology; Software. AC: Conceptualization; Visualization; Methodology. DNP: Data curation; Formal analysis. SZ, MH: Software; data curation. KJC: Resources; Methodology; Data curation. GB: Writing—review & editing; Methodology; Project administration; Supervision. BIC: Conceptualization; Supervision; Formal analysis; Methodology; Project administration; Resources; Visualization; Methodology; Software.
Ethics Approval and Consent to Participate
This article does not contain any studies with human participants or animals performed by any of the authors. (The data access was available via NIH dbGaP approved project numbers 6300 and 25670.) Informed consent was not applicable to this study.
Patient Consent
Not applicable.
Availability of Data and Materials
Most of the data generated in this study is in the SOM files. The remainder of the data generated in the present study may be requested from the corresponding author.
Supplemental Material
Supplemental material for this article is available online.
References
Supplementary Material
Please find the following supplemental material available below.
For Open Access articles published under a Creative Commons License, all supplemental material carries the same license as the article it is associated with.
For non-Open Access articles published, all supplemental material carries a non-exclusive license, and permission requests for re-use of supplemental material or any part of supplemental material shall be sent directly to the copyright owner as specified in the copyright notice associated with the article.