
Abstract
Motivation:
Somatic mutations can have critical prognostic and therapeutic implications for cancer patients. Although targeted methods are often used to assay specific cancer driver mutations, high throughput sequencing is frequently applied to discover novel driver mutations and to determine the status of less-frequent driver mutations. The task of recovering somatic mutations from these data is nontrivial as somatic mutations must be distinguished from germline variants, sequencing errors, and other artefacts. Consequently, bioinformatics pipelines for recovery of somatic mutations from high throughput sequencing typically involve a large number of analytical choices in the form of quality filters.
Results:
We present vcfView, an interactive tool designed to support the evaluation of somatic mutation calls from cancer sequencing data. The tool takes as input a single variant call format (VCF) file and enables researchers to explore the impacts of analytical choices on the mutant allele frequency spectrum, on mutational signatures and on annotated somatic variants in genes of interest. It allows variants that have failed variant caller filters to be re-examined to improve sensitivity or guide the design of future experiments. It is extensible, allowing other algorithms to be incorporated easily.
Availability:
The shiny application can be downloaded from GitHub (https://github.com/BrianOSullivanGit/vcfView). All data processing is performed within R to ensure platform independence. The app has been tested on RStudio, version 1.1.456, with base R 3.6.2 and Shiny 1.4.0. A vignette based on a publicly available data set is also available on GitHub.
Introduction
A broad array of variant callers and computational pipelines serving a diverse range of research requirements has been developed to identify somatic mutations from DNA sequencing data. Each method comes with its own set of performance characteristics. 1 Despite differences in calling algorithms and applications, most use tumour and normal next-generation sequencing (NGS) data, aligned to a reference as input and output detailed tumour-specific single nucleotide variants and indel records in variant call format (VCF). 2 One of the most popular callers in clinical oncology, 3 Mutect2, 4 has been shown to perform well in terms of overall balanced accuracy. 1 It employs a series of filters to flag likely false-positive variants, resulting from biases, artefacts, or failure to meet confidence thresholds.
The frequency spectrum of mutations is often of particular interest. Somatic mutations with relatively high frequency (>0.25, accounting for ploidy and sample purity) 5 are often clonal (i.e. they occur in every cancer cell) and some of these may be cancer driver mutations and therefore of particular interest for precision oncology. The somatic mutation spectrum can also provide information about the evolutionary dynamics of the tumour.5,6 In the case of blood cancers, variant frequencies are used for risk stratification and prognosis for a number of myeloid malignancies.7,8 High throughput sequencing can be used as an alternative to polymerase chain reaction (PCR)-based clinical analysis of mutant allele burden, 9 with the advantage that it has the potential to provide an accurate estimate of the mutant frequency and can detect clinically relevant mutations that are not targeted a priori. Moreover, mutational signatures that can be recovered from high throughput sequencing data have been associated with distinct clinical outcomes and are emerging as potential biomarkers for novel targeted therapies. 10
There are significant technical challenges that inhibit the application of next-generation sequencing in cancer treatment, including the lack of user-friendly tools and data analysis pipelines. 11 The data derived from cancer sequencing is complex, making it difficult to extract information on relevant variants. Candidate variants flagged by the caller as having failed quality filters are routinely removed from analysis; however, they have the potential to highlight sources of technical artefacts. These variants may also contain false negatives that are of clinical or research interest. Command-line based, hard-filtering approaches such as VCFtools, 2 GATK VariantFiltration, 12 and SnpSift 13 use variant attribute values combined with logical operators to further subset a VCF file. Such tools are complex to configure and lack a means to review the impact of analytical choices involved when subsetting the data. This significantly limits the scope and pace of exploratory analysis of VCF data.
We developed vcfView as an interactive graphical tool to support filtering of putative somatic variants. vcfView displays the allele frequency spectrum as well as mutation patterns and signatures inferred from all putative mutations so that the user can assess the impact of different filtering choices on the variants discovered. All displays are updated dynamically as the user adjusts the filters that are applied to the data. Users can also display somatic mutations on a gene of interest, gaining insights about which mutations are lost from the gene as different filters are applied. To demonstrate its utility, we use vcfView to isolate putative tumour-in-normal (TiN) variants in acute myeloid leukaemia (AML) samples from The Cancer Genome Atlas (TCGA). These variants, which were removed from analysis in TCGA, were significant enrichment for known AML driver mutations.
Features
vcfView enables users to analyse mutations that fall within a region of the mutation frequency spectrum and that pass or fail user-specified quality filters. Analyses available by default include mutation patterns, mutational signatures and the functional effects of the mutations on proteins of interest. The user can explore how these change in different regions of the frequency spectrum or when different filters or other user configurable thresholds are applied. The interface features a variant allele frequency (VAF) density plot within which a region of interest may be selected for further filtering or analysis. The results are displayed inset within the top corner of the density plot. An additional feature allows for a summary file created from a number of individual VCF files to be analysed to identify patterns that may exist across a collection of samples. High-resolution publication standard plots and a filtered copy of the original VCF file may be saved at any stage.
Density plot, thresholds, and filters
The central window of the vcfView user interface is the VAF Density plot (Figure 1) that displays the frequency spectrum of somatic mutations. To the right, a series of checkboxes present the researcher with the available quality filters, which are parsed directly from the input file, as well as user configurable thresholds for calling somatic mutations. These provide a means to threshold on the evidence for a somatic mutation at a site. Variants that pass all these filters are displayed in the VAF density plot. The colour in the plot indicates the median sequencing depth of variants in the VAF bin shown on the x-axis. All plot data are updated when the user modifies any filter or threshold settings. The density plot also includes interactive click and drag functionality, enabling the researcher to extract a region of interest from the allelic spectrum for further analysis.

vcfView user interface. Display shows the VAF Density plot with signatures inset plot active, filter panel to the right and inset function selection below.
Inset plots
Variants that are included within the selected frequency range can be visualized in several alternative inset plots on the main VAF display (Figure 2). The required inset function is specified using the radio button list below the density plot. The inset plot is triggered when one of these buttons is activated and redrawn when a region of the allelic spectrum is selected (either with the mouse or by updating the relevant numeric inputs on the user interface) or when filter/threshold settings are updated. vcfView is configured with four inset plots by default, displaying mutation signatures, mutation processes, functional impacts of variants on a selected protein, and candidate filters. The architecture is extensible allowing integration of third-party or custom algorithms to produce alternative inset plots. The signatures inset plot displays the estimated contribution of each of the Catalogue of Somatic Mutations in Cancer (COSMIC) 14 reference signatures to the selected mutations. The mutation processes plot shows a bar plot of the fraction of the mutations in each of the 96 trinucleotide contexts. 14 The protein function inset plot is a lollipop diagram indicating the functional impacts of mutations in the selected frequency range on the specified gene. The dropdown list from which this gene is chosen is updated dynamically so that only genes with a protein impacting variant in the selected frequency range are displayed. Finally, the candidate filters function shows the number of variants that have failed each variant caller filter within the selected range.
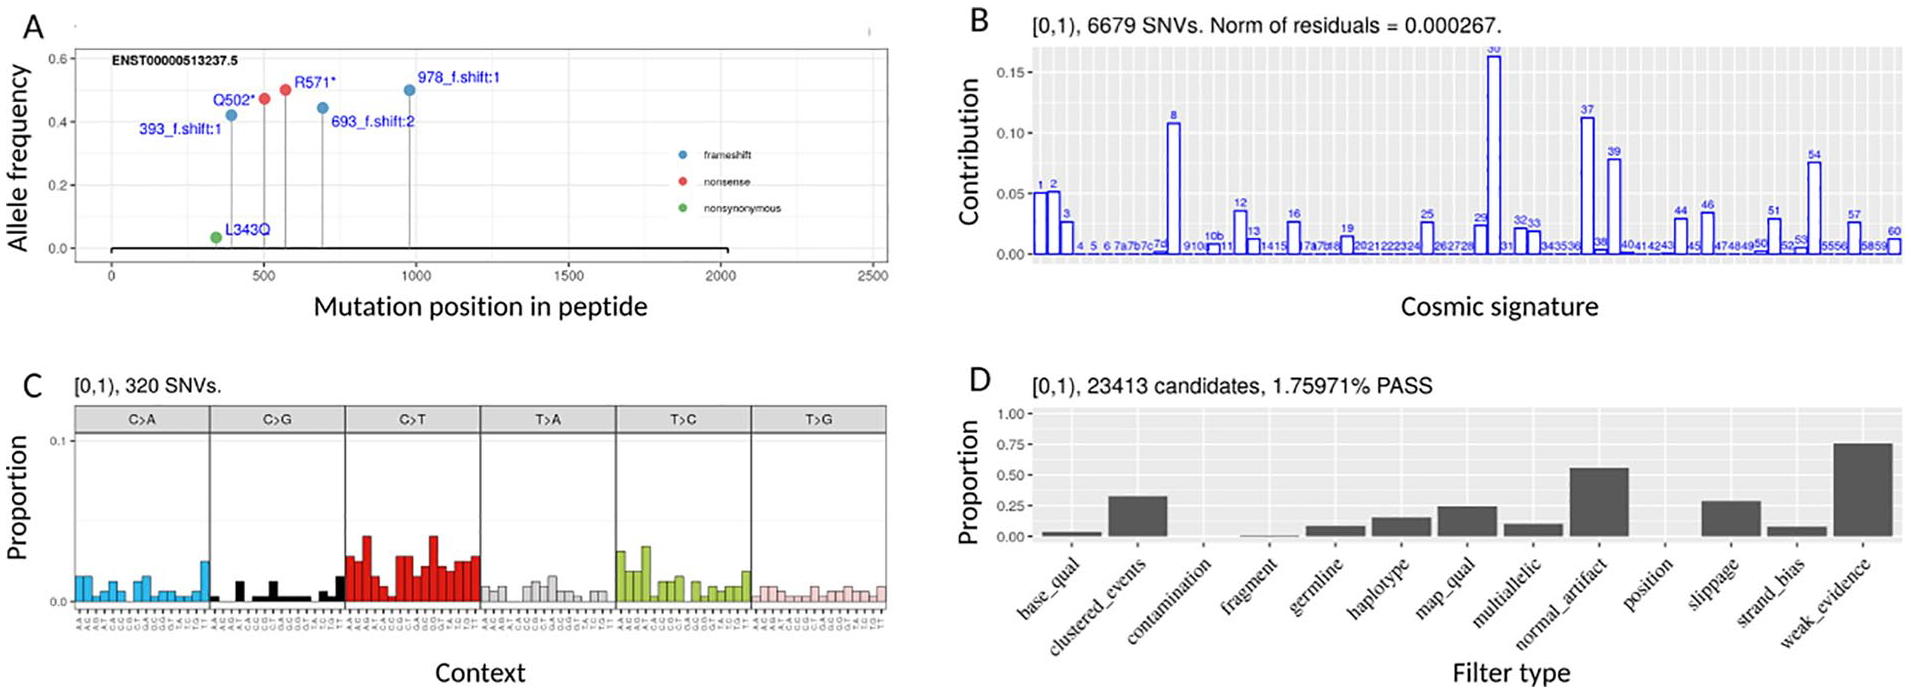
vcfView inset analysis function plots showing (A) protein analysis plot, (B) mutational signatures, (C) trinucleotide contexts, and (D) candidate filters plot.
Package vignette
The package vignette demonstrates the functionality of vcfView using publicly available data from The Texas Cancer Research Biobank (TCRB). It is composed of three main sections. It first demonstrates exploratory analysis of a single VCF file from the data set. Mutational processes and signatures within a somatic allele frequency window are identified. Candidate variants within that region are subsetted according to various thresholds and filter settings, and the impact of selected variants on proteins of interest is visualized. This enables the evidence for the presence of potential driver variants to be assessed.
The vignette also describes how to generate a summary of all VCF files within a data set to identify patterns that may exist across that cohort. A summary file is loaded into vcfView and analysed in the same way as an individual VCF file. It may be used, for example, to identify mutational signatures or processes across a data set from patients with the same cancer type or who have undergone the same therapy. It can help to determine if variants are impacting a putative driver gene across multiple patients. A subset of candidate variants that have failed specific filters may be re-examined in an attempt to recover information previously excluded from analysis. In the vignette, a summary file is created and used to check for the existence of putative tumour-in-normal variants within the TCRB data set that may have resulted in failure to call some cancer somatic variants.
Finally, the vignette shows how to integrate other packages into vcfView to produce additional inset plots. It provides a simple wrapper example that integrates a third-party algorithm with vcfView’s extensible function set. This enables the researcher to use that library within the inset window of vcfView and take advantage of its preprocessing capabilities.
vcfView Architecture
Interactive visualization is implemented in R 15 with Shiny. 16 All data processing is performed within the R environment to facilitate platform independence. It leverages several Bioconductor packages17–21 to functionally annotate VCF-formatted data and drive exploratory visualizations within a user-selectable allele frequency window.
VCF-based record details together with amino acid and trinucleotide context annotation is maintained in two internal data structures for ease of manipulation and subsetting. An index into the original VCF object is used to save a subsetted version of the VCF as required. Functional annotation of protein impact (enumerated as frameshift, nonsense, nonsynonymous, or synonymous) provided by the UCSC transcript annotation library 19 is displayed by the protein inset function using ggplot 22 and labelled using ggrepel. 23
Single base substitution (SBS) trinucleotide sequence context annotation for inset function signatures and mutational processes is provided by the Bsgenome annotation library. 18 In the signatures inset function, a summary of this annotation is used in conjunction with the lsqnonneg method (from pracma library) 24 to create the optimal combination of COSMIC v3 SBS signatures required to reconstruct the variant subset. This returns a non-negative linear least-squares fit of the 65 COSMIC mutational signatures (version 3). Processing is similar to that used in the MutationalPatterns 25 library but streamlined to reduce demands on system memory. All plots are rendered using the ggplot 22 library.
Visualization of Putative Tumour in Normal Variants in Leukaemia Samples With vcfView
To demonstrate the utility of vcfView, we used it to re-examine TCGA AML data to determine whether potentially relevant prognostic or diagnostic information could be recovered from candidate variants that have previously been excluded from analysis. Mutect2 filters potential false positives resulting from germline variants by scoring the confidence that a mutation is present in the tumour sample and absent from matched normal, typically a skin sample in the case of blood cancers. This could result in the failure to detect true somatic variants in the cancer if the same mutation is found in a subset of the cells in the skin sample or if the skin sample includes a proportion of cancer cells or cell-free DNA. Many cancer driver mutations have been found to be relatively common in normal skin cells. 26 Moreover, 3% to 5% of all nucleated cells in the epidermis are myeloid derived. 27 Therefore, it is possible that some of the driver mutations that are critical for gaining an insight into the cancer may also occur, albeit potentially at a lower level, in the skin sample. The use of skin as a normal sample for the identification of somatic mutations in leukaemia cells risks removing these variants from analysis. Mutect2 filters variants that are identified in a panel of normal samples to reduce the effects of recurrent sequencing artefacts and common genetic variation. This variant blacklist is usually derived from blood samples; however, a substantial proportion of blood samples may be affected by clonal haematopoiesis and contain somatic mutations that are relevant for blood cancers. 28 Here, we used vcfView to re-examine data from TCGA LAML samples for evidence of somatic variant exclusion due to the presence in the matched normal sample or in the panel of normals. We refer to these variants as putative tumour-in-normal (pTiN).
Exploratory analysis with vcfView highlighted a significant number of candidate variants that had been removed solely because they failed the allele in normal filter despite being present in extremely low amounts in the normal sample relative to the tumour. Further inspection with the protein inset function revealed a large number of these were in known AML drivers. We tested for enrichment of pTiN variants among known AML driver genes and isolated a significant number of pTiN AML driver variants previously excluded from analysis in TCGA LAML.
Methods
We downloaded the protected mutation annotation format (MAF) file containing variants previously identified in the TCGA LAML data set of 149 AML patient samples from the NCI’s Genomic Data Commons (GDC, https://portal.gdc.cancer.gov/files/66124158-7feb-4b8e-8fc4-393a5e641fea). We retrieved all protein-truncating variants that had failed the allele in normal and/or panel of normal Mutect2 filters for which the VAF was greater than 0.1 and at least 10 times the frequency of the variant in the normal samples. We further restricted to variants at loci with a read depth of at least 20 in both the tumour and normal samples and that were not found in dbSNP.
We next obtained a list of canonical transcript lengths for all protein coding genes in the exome from Ensembl. Further annotation was added to each gene in this list identifying it as AML driver or non-AML driver (as indicated by IntOGen) 29 and recording the number of pTiN variants contained per base of coding sequence. We performed Fisher’s exact test for enrichment of known AML drivers among genes containing pTiN variants. To account for coding sequence length, we also compared the number of pTiN variants per base between AML driver genes and non-AML drivers using the Wilcoxon rank sum test.
Results
A total of 3549 protein-truncating variants were flagged as occurring in the normal sample or panel of normals and were, therefore, not called as cancer somatic variants. Of these, 129 met all of the criteria we used for identifying pTiN variants (Table 1: see Methods for details). Among these pTiN variants, 16 occurred in AML driver genes obtained from IntOGen 29 (Figure 3A). One additional variant, RUNX11, not listed as a driver in IntOGen, was reported to be relevant to AML 30 and is included in Figure 3A.
Genes and patients affected by pTiN variants relevant to AML in TCGA AML.


(A) Alternative allele frequency plot of tumour (blue) and matched normal (red) TCGA LAML pTiN variants affecting AML-relevant genes. Error bars show 95% confidence intervals for the alternative allele frequency (estimated from reference and alternative read counts). (B) vcfView protein plot for NPM1 derived from a VCF summary of the TCGA LAML data set.
AML driver genes were significantly enriched among the set of genes affected by these 129 pTiN variants (P = 3 × 10⁻¹¹, Fisher’s Exact Test). This difference was also highly statistically significant when we compared the number of pTiN variants per base pair between AML driver genes and other genes to account for differences in length between genes in the two groups (P = 1 × 10−53, Wilcoxon rank-sum test). In all, variants in 9 genes of prognostic or diagnostic value were identified in 15 patients (Table 1). Thus, 10% of TCGA LAML patients had potential clinically actionable variants overlooked due to pTiN. For example, two patients had pTiN variants in NPM1 (Figure 3B). This would be of potential prognostic value for these patients, as mutations in NPM1, which occur in approximately 30% of patients with AML, are associated with favourable response to standard intensive chemotherapy. 35
Limitations
This tool is intended for use with matched cancer/normal VCF files only (not for germline VCFs). Although it has been used with VCFs generated by other callers, it is recommended for use with Mutect2 VCFs. It uses the Mutect2-specific ‘TLOD’ subfield to select within records that contain multiple possible alternative alleles. As other callers do not provide this value in their VCFs non-Mutect2 records containing multiple possible alternative alleles are currently discarded by vcfView. We intend to add an option in a future release allowing the user to specify the field and condition used to calculate the index required to select among multiple possible alternative alleles when using vcfView with VCFs generated by callers other than Mutect2. vcfView has been tested with tumour exome data from MuTect2 GATK3 and Mutect2 GATK4 VCF files. 4 We cannot guarantee it will work with all future versions of GATK without requiring modification. Mitochondrial DNA variants are currently excluded. We intend to add an option for their inclusion in a future release.
Footnotes
Acknowledgements
The author would like to acknowledge the TCGA data as it relates to data analyzed in the study.
Funding:
The author(s) disclosed receipt of the following financial support for the research, authorship, and/or publication of this article: This publication has emanated from research conducted with the financial support of Science Foundation Ireland (grant no. 16/IA/4612).
Declaration of conflicting interests:
The author(s) declared no potential conflicts of interest with respect to the research, authorship, and/or publication of this article.
Author Contributions
BOS developed the concept and wrote the code. CS supervised the research and suggested additional features and analyses. The authors co-wrote the paper.