
Abstract
Personalized medicine is promising a revolution for medicine and human biology in the 21st century. The scientific foundation for this revolution is accomplished by analyzing biological high-throughput data sets from genomics, transcriptomics, proteomics, and metabolomics. Currently, access to these data has been limited to either rather simple Web-based tools, which do not grant much insight or analysis by trained specialists, without firsthand involvement of the physician. Here, we present the novel Web-based tool “BioMiner,” which was developed within the scope of an international and interdisciplinary project (SYSTHER†) and gives access to a variety of high-throughput data sets. It provides the user with convenient tools to analyze complex cross-omics data sets and grants enhanced visualization abilities. BioMiner incorporates transcriptomic and cross-omics high-throughput data sets, with a focus on cancer. A public instance of BioMiner along with the database is available at http://systherDB.microdiscovery.de/ , login and password: “systher”; a tutorial detailing the usage of BioMiner can be found in the Supplementary File.
Keywords
Introduction
On the way to the medicine of the 21st century, personalized (also called individualized) medicine is a great and crucial step. It allows physicians to tailor therapy plans to the patient's distinctiveness, providing better treatment outcomes for patients and overall less drug use. This equates to faster recovery, less side effects, and lower expenses for the health care system. 1
Personalized medicine is especially promising with regard to the treatment of neoplastic disorders. They are among the most complex diseases known. Individualized medicine helps in developing pharmaceuticals and treatments that can efficiently eliminate cancer cells and at the same time cause the least amount of damage to the surrounding tissues and the patient overall. For personalized medicine and the fight against cancer, disease-centered high-throughput data sets are ideal resources. They can be used to generate or verify hypotheses, to compare own findings with public data, and to find novel biomarkers and identify their functional contexts. To achieve this, a complex data processing pipeline is required, comprising (at least) the following steps2,3:
Searching and downloading a suitable public data set Importing data into a statistical environment Performing adequate data normalization Performing quality control of data and normalization Formulating and implementing a statistical analysis and Interpreting the results
The realization of this workflow is very time consuming and requires special know-how in bioinformatics and statistics. 4 Physicians and biologists not experienced in high-throughput data analysis can profit immensely from a tool that allows easy and intuitive access to cross-omics high-throughput data sets, granting them firsthand access to this vast resource of knowledge.
The majority of biological high-throughput data sets are stored in public data repositories such as Gene Expression Omnibus (GEO) 5 and ArrayExpress 6 for microarray data, PRoteomics IDEntifications (PRIDE) 7 for proteomics data, or Sequence Read Archive (SRA) 8 of the National Center for Biotechnology Information for next-generation sequencing data. These repositories provide data storage for a dedicated set of single “omic” data type but do not support linking of different types of omics data (cross-omics). GEO and PRIDE also provide mining tools to inspect their data sets and to perform some limited data analysis.9,10 Workflow management systems such as KNIME, 11 TAVERNA, 12 Orange4WS, 13 and Galaxy 14 use graphical user interfaces to build complex multistep data-mining workflows. These tools are designed to grant some limited analysis capabilities but do not provide unified (cross-omics) access to data sets. Performing data analysis based on cross-omics data sets proves to be a challenging task, even for those experienced with data analysis. Table 1 presents a comparison of BioMiner with other systems.
Comparison of features between BioMiner and equivalent tools.

In a joint effort, the partners of the binational SYSTHER (Systems Biology Tools Development for Cell Therapy and Drug Development – ww.systher.eu) project successfully investigated the molecular mechanisms of different cancer types. To analyze cancer from multiple points of view, complementary high-throughput data sets from transcriptomics, metabolomics, and proteomics were collected.15–18 To store these different “omics” data sets together with complementary data from public resources, we created SystherDB, resorting to previous work.19,20
A database can only be beneficial to the user if the stored data are well presented and easily accessible. The complex nature of biological high-throughput data makes this a challenging task. Rising to this challenge, we developed BioMiner, a Web-based toolbox for mining and visualizing data stored in SystherDB. The main objective is to give all partners in the SYSTHER project a tool that they can use to obtain their own results from high-throughput data. Regardless of their expertise, the partners can use BioMiner to interactively explore public and proprietary multiomics data sets.
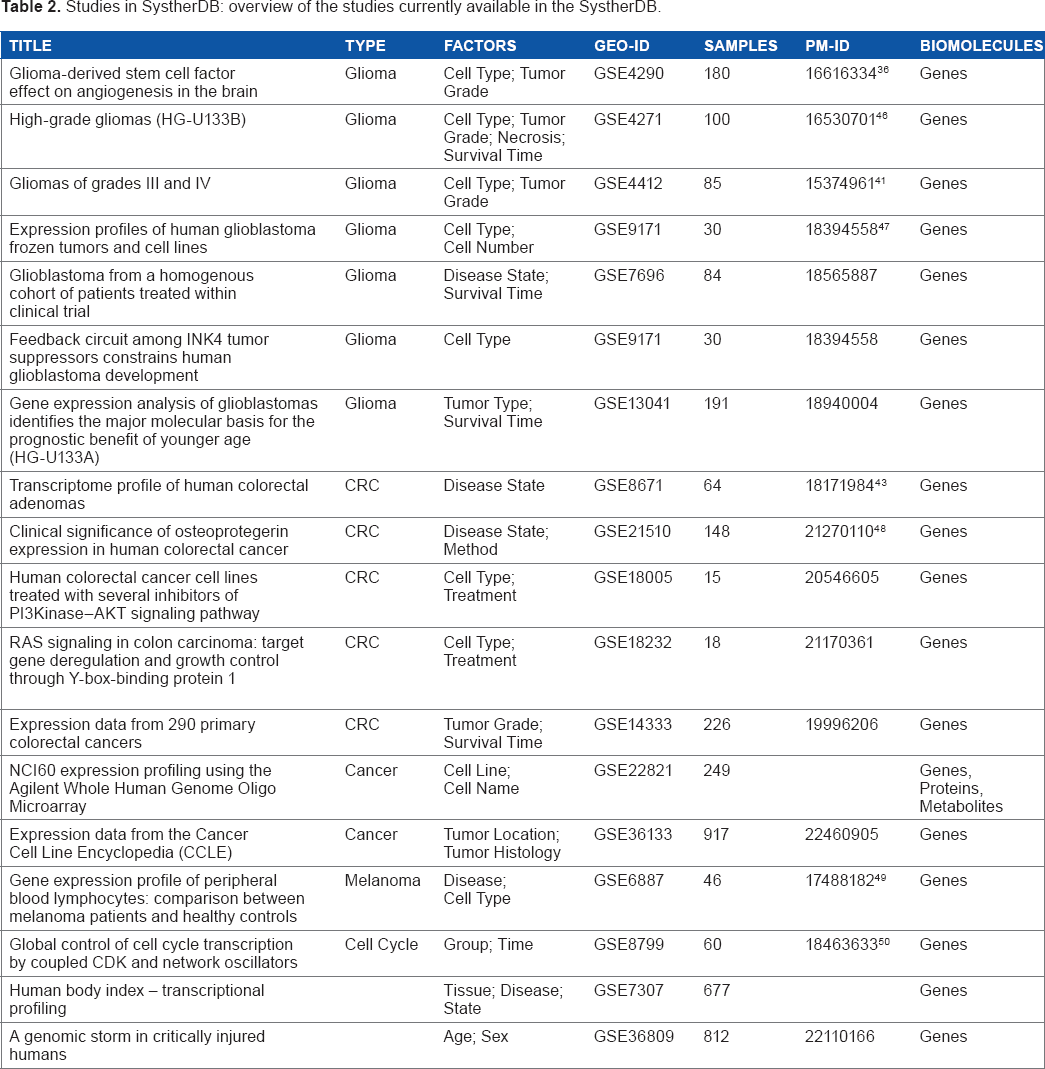
A public instance of BioMiner is freely available online. It currently contains 18 different studies (Table 2), with almost 4,000 microarrays and more than 187 Mio measured values of genes, proteins, or metabolites. Because BioMiner was developed in the SYSTHER project, most of the studies are related to the focus of the project, glioblastoma multiforme (GBM). Most of them have been imported from different public resources. The large studies in particular highlight the potential of BioMiner to easily inspect and analyze huge data sets. We demonstrate the application by presenting typical use cases for the identification of cancer biomarkers. A graphical representation of the workflow can be found in Figure 1.
Studies in SystherDB: overview of the studies currently available in the SystherDB.
All analyses presented in the methods section can readily be reproduced and expanded using the public Web server http://systherDB.microdiscovery.de/ , with login and password “systher.”

Typical workflow in which BioMiner can be integrated. The yellow boxes represent steps within the field of bioinformatics (or in this case, done in BioMiner), the green box represents the wet-lab work, and the gray box represents the theoretical part (eg, study design) of the workflow.
Methods
BioMiner is designed as a Web application and uses Google Web Toolkit (GWT) for the graphical user interface. GWT functionality is enhanced by customized plot-applets tailored for interactive visualization of large data sets. Results are presented in two parallel views composed of a table and a plot. Both views are interactive and user-defined selections can be synchronized. Pathway visualization is achieved by extending the PathVisio library. 21
Experimental data from genomics, proteomics and metabolomics are stored in a large manually curated MySQL ‡ database (SystherDB). To ensure data consistency, data import has to be performed by a dedicated specialist. Specific indexing methods have been implemented to achieve good response times. Even when querying large studies comprising several millions of measurements, response times are typically within just a few seconds. Metabolite data are annotated using three different identifier systems: Golm Metabolome Database, 22 Human Metabolome Database (HMDB), 23 and Kyoto Encyclopedia of Genes and Genomes (KEGG). 24 Integrating the different data types into a single outcome requires a predefined cross-omics relationship, eg, a mapping of metabolites onto genes or vice versa. Integration of semantic information is achieved by singular enrichment analysis. 25 Especially, pathway and functional information from Reactome, 26 KEGG, 24 WikiPathways, 27 and GeneOntology 28 are supported. Enrichment statistics with multiple testing-corrected P-values are calculated as described in Bluthgen et al. 29 Correlation analyses are based on Pearson correlation coefficients. To filter noise and improve response times, correlations are calculated for high-variance genes (by default, the top 500 genes).
BioMiner complies with public data management standards such as Minimum Information About a Microarray Experiment (MIAME), 30 Minimum Information About a Proteomics Experiment (MIAPE), 31 and Minimum Information About a Metabolomics Experiment (MIAMET). 32
Cross-Omics Mapping
For the mapping between genes and proteins, we use the relations provided by ENSEMBL # 33 database accessible via BioMart. 34 This mapping is updated on a regular basis (coupled with new versions of ENSEMBL). For establishing relations between genes and metabolites, we use the combined information of ConsensusPathDB 35 and HMDB. 23 These databases provide information about metabolites (compounds) and associated metabolic enzymes. Genes coding for the metabolic enzymes are mapped to the corresponding metabolite. This mapping is updated with new versions of HMDB.
Results
The main goal of BioMiner (beyond easily accessible storage of high-throughput cross-omics data) is to provide a set of tools that allow the performing of a number of statistical investigations. To demonstrate the intuitive usability of the application, we present typical workflows used for the identification of genes and pathways associated with GBM. The presented use cases are mainly based on data of the GBM Study by Sun et al. 36 , containing data from 180 microarrays derived from tissues of patients with different brain tumor types and grades, as well as from tissues of nontumor controls. This study has a relatively simple experimental design with a large number of replications. The major analysis steps of BioMiner are shown in Figure 2, including study overview, detection of differentially expressed genes, identification of pathways, visual pathway inspection, comparison of gene expression with protein expression, and correlation of genes with survival times. These steps are demonstrated in more detail.

Data mining with BioMiner. Screenshots of different results from data mining with BioMiner including the following: (
Study Selection and Inspection
In order to access data, an experiment (study) is selected from an overview presenting key properties of all studies in the database (Fig. 2A). To find a study of interest, the table can be filtered using keywords such as “glioma” or biomolecule types such as “genes.” Once a study is selected, different biological and technical properties can be inspected, such as number and grouping of samples, experimental or clinical parameters, or the experimental technologies used.
Differential Analysis
The simplest and most common approach for the detection of tumor-associated biomarkers is a differential analysis based on statistical tests such as the t-test. Differential biomolecule identification can be configured using a drag-and-drop mechanism of the relevant samples. As an example, we compare GBM WHO grade IV samples versus nontumor control samples in the study of Sun et al. 36 The comparison is performed on the fly, and the resulting fold values and P-values are presented in a tabular view and can be displayed in interactive plots (eg, volcano plot: Fig. 2B). The two top upregulated genes between glioma WHO grade IV and nontumor samples are IGFBP2 and CHI3L1, both of which are described as important glioma-related markers in the literature.37–40 The table with the differential results can be filtered for a specific gene name or description. Searching for the ratio of cursive reveals a 2.6–fold upregulation in GBM WHO grade IV (Log2 ratio of 1.4).
Correlation Analysis
Correlation is a general and versatile tool to identify associations and predictive relationships between biomolecules or experimental parameters. For example, if a study is annotated with survival times, the analysis of correlated events allows the identification of markers associated with survival. This association may be positive (high gene expression indicates long survival) or negative (high gene expression indicates short survival). BioMiner implements different types of correlation analyses to search for an association between different biomolecules or between biomolecules and clinical parameters. As an example, Figure 2C shows the results of a correlation analysis between genes and survival time based on the study of Freije et al. 41 A ranked table of highly correlated genes is complemented by a scatter plot of the top gene OSBPL11. We included several GBM- and colorectal cancer (CRC)-related studies with annotated survival times (Table 2).
Working with Gene Groups
The user can define and store a specific group of biomolecules, eg, by selecting a set of genes with significant P-values or high fold changes. Defining a biomolecule group offers the possibility for cross-study analyses, addressing, for instance, the question: How do the top upregulated genes from the data set of Sun et al. 36 behave in other data sets? To this end, a group of biomolecules can be loaded into existing plots. With this approach, the user can easily compare two studies. An example comparing two similar studies is given in Figure 3. This volcano plot visualizes the differential biomolecule comparison for astrocytoma grade III versus GBM grade IV using the data set from Freije et al. 41 Top upregulated genes identified with the data set from Sun et al. 36 are highlighted in red (refer “Differential analysis” section earlier). The majority of the highlighted genes show a very good agreement between both GBM studies. This agreement even increases if the highlighted gene set is created from the comparison of tumor grade III with tumor grade IV in the study by Sun et al. 36 (data not shown). The top upregulated gene in both studies is MIR21 (rightmost red point), which has been identified recently as a useful biomarker for GBM. 42 But there are also some disagreements between both data sets. Especially the gene MALAT1 (leftmost point in Fig. 3) is downregulated in the data based on Freije et al. 41 while showing an upregulation in the data set from Sun et al. 36

Volcano plot for cross-study comparison. Volcano plot visualizing the differential comparison of astrocytoma grade III versus GBM grade IV using the data set from Freije et al. 41 Top upregulated genes identified with the data set from Sun et al. 36 (GBM grade IV vs control) are highlighted to investigate the relation between different studies. The majority of the highlighted genes show a good agreement between both brain tumor experiments.
Beyond comparing closely related studies, this approach can also be used to investigate relations between more heterogeneous studies. By highlighting the top genes from Sun et al. 36 in the differential comparison of adenoma versus normal mucosa, 43 we detect general and more specific cancer markers. IGFBP2 (already reported above) and TGFBI are upregulated in both tumor types, while the gene PLOD2 shows upregulation only in GBM but not in CRC. 44
Functional Characterization and Interactive Pathway Plot
Typically, the result of a differential analysis is not a single gene but rather a set of up- or downregulated genes that may be related in a systemic context (such as a biochemical pathway). The contextual interpretation of a given set of genes can be challenging, especially considering the multitude of different gene functions and involvements in biochemical pathways. BioMiner provides a straightforward way to identify biochemical pathways, Gene Ontology terms, or chromosomal regions significantly related to a given set of genes (Fig. 2E). Pathways from WikiPathways and KEGG can be displayed and interactively inspected based on predefined layouts. Integrating results from differential analyses in the pathway graph allows the investigation of genes and metabolites in their systemic contexts. This is illustrated for the “cell cycle” pathway in Figure 4 using the differential biomolecule identification of GBM tumor grade 4 versus control (refer “Differential analysis” section).

Pathway visualization. Interactive pathway visualization of the cell cycle pathway from WikiPathways repository.
Cross-Omics Analysis
The system internally contains cross-omics mappings between genes and proteins or between genes and metabolites. The complexity of the different cross-omics mappings is hidden from the user. For studies containing cross-omics data, the user can easily correlate different omics data types, eg, by creating a scatter plot comparing differential gene expression with differential protein expression (Fig. 2F).
Discussion
In this article, we demonstrate that the Web-based application BioMiner is well suited to perform statistical analyses in cancer-related high-throughput experiments. The studies selected for illustration are related to GBM. All presented analyses can be reproduced using the publicly available instance of the application.
In order to create a tool useful for a broad spectrum of life science users, our major goal was to keep BioMiner's usage as simple as possible while offering substantial flexibility in answering biological questions. Simplicity is achieved by following several different guiding principles. First, technical details are hidden from the user: ready-to-use normalized data are provided together with information on experimental design and clinical parameters. Second, experimental data are complemented by public knowledge on pathways and gene functions. Third, instead of providing an extensive repertoire of data analysis algorithms, we rather focus on a limited set of proven methods. To perform analyses beyond this set, it may be necessary to download result tables or complete study data and run analyses in more advanced statistical frameworks such as R/BioConductor. 45 Fourth, we model key aspects of the experimental design so that the main questions can be addressed rapidly. For instance, the case-control branches of a study are explicitly represented so that differential analysis can be achieved straightforwardly. More sophisticated analyses deviating from the default design are possible but may result in slower response times.
Of course, easy accessibility comes at a price: performance-optimized queries with response times of a few seconds are available only for predefined groups. All preprocessing steps, notably data normalization, have to be performed before data import and cannot be changed during an analysis. At the current state of development, there is no option for users to import own data sets. The predefined cross-omics mappings cannot be changed or individualized by the user. They have to be updated by the system administrator on a regular basis. Given the benefit of a fluent and straightforward usability, we think these limitations are acceptable.
The true potential of BioMiner is revealed when looking at the huge studies with several hundreds of microarrays. It takes only seconds and a few mouse clicks to compare 165 lung cancer samples with 56 breast cancer samples from the Cancer Cell Line Encyclopedia (CCLE) study comprising >900 microarrays. The interactive result presentation makes it very easy to inspect the results, search for additional information, or identify functional relations.
The system is able to represent personalized data such as high-throughput data (genomics, epigenomics, proteomics, and metabolomics) in combination with clinical parameters. If used in a clinical context, BioMiner is well suited to address the needs of personalized medicine. Interfacing with tumor biobanks or clinical data management systems, the system will enable clinicians to directly evaluate patient-related high-throughput data and draw therapeutic conclusions.
Conclusion and Outlook
BioMiner is a resource that enables rapid identification and assessment of relevant features in complex biological experiments. It provides clinicians and physicians a platform integrating high-throughput data together with clinical parameters. Straight design and ease of use make BioMiner perfectly suited for those who are not experts in bioinformatics and statistics. The application enables experimentalists to directly assess data, validate hypotheses, draw biological conclusions, and plan further experimental procedures. With an increasing number of experiments available for data analysis, the usefulness of BioMiner will still expand.
Given its intuitive usability, BioMiner may also serve as a platform for education, with instructors using the application for hands-on demonstration of high-throughput data analysis.
In the future, additional analytical capabilities of BioMiner will augment the use of this platform in the context of personalized medicine even further. Researchers will be able to submit their patients’ molecular profiles to BioMiner and receive information about the patients’ disease status and optimal course of treatment.
Author Contributions
CB, AG, and JSch developed and implemented the application. CB, KS, AG, KG, CS, MO-G, JS, and JSch drafted the manuscript. All authors read and approved the final manuscript.
supplementary Materials
Supplementary File 1
A tutorial detailing the usage of BioMiner.
Supplementary File 2
BioMiner methods for log-expression values, means and standard deviations, differential analysis with two groups, differential analysis with four groups, multiple testing adjustment and correlation analysis.
Footnotes
Acknowledgments
We thank Sergio Grimbs and Matjaz Hren for helpful discussions.