
Abstract
Background:
Cancer is the second leading cause of death globally. Despite developing countries including Ethiopia continuing to shoulder the greatest burden, insufficient research has been conducted to determine geographical and other characteristic effects. The main objective of this study was to assess the distribution and risk of cancer and determine the effects of some common clinical patient characteristics on current patient status by taking into account the spatial effect.
Methods:
The data for this study were obtained from the oncology ward of Felege Hiwot Referral Hospital, Bahir Dar, Ethiopia. About 415 cancer patients were included in the study. Spatial mixed ordinal logistic regression model was used to explore the geographical patterns of the incidence of cancer and identify the risk factors.
Results:
The findings of this study show that only 1.45% of patients were cured and 46.02% improved, whereas the rest have shown no change and even worse status after treatment. The estimated odds of patients who received chemotherapy was 4.284 times the estimated odds of patients who received palliative care. Prognostic factor (stage of cancer tumor), complication of cancer such as anemia during diagnosis, and treatment of patients given in the hospital had significant effect on the patient status.
Conclusion:
Patients without anemia were more likely to be cured and improved than patients with anemia during diagnosis. Most of the patients had advanced stage (IV) of cancer tumor, which dismantles the capability of the treatment to be less effective. There was negative spatial effect on the incidence of cancer, indicating that districts with higher cancer incidence were usually surrounded by districts with lower incidence.
Background
Cancer is a genetic disease caused by changes to genes that control the way our cells function, especially how they grow and divide, which leads to unregulated growth and division of cells that form malignant tumor and invade the nearby parts of our body. The cause of cancer, genetic changes, can be inherited from parents and also during a person’s life time as a result of errors that occur as cells divide by certain environmental exposures. Cancer tumors are malignant, which can spread and invade nearby tissue, called metastatic cancer, which can start almost anywhere in the human body.1,2 Recently, the National Cancer Institute 2 showed that there are more than 100 types of cancer, usually named after the organs or tissues where the cancers form. Among these, only 20 types of cancers were considered in this study based on the registry of cancer patients in the oncology ward of Felege Hiwot Referral Hospital (FHRH) in the Western Amhara region of Ethiopia.
According to the Global Burden of Disease Cancer result explored in 2015, cancer was the second leading cause of death globally, 8 million deaths, with cardiovascular diseases being the first. 3 Based on the 2018 world cancer statistics (excluding nonmelanoma skin cancer), there were an estimated 18 million cancer cases around the world, of which 9.5 million were in men and 8.5 million in women. Globally, lung cancer is the first most commonly diagnosed cancer that affects most cases (12.3% of the total). Breast (2 088 849 cases, 12.2% of the total), colorectal (10.00%), prostate (9.8%), and stomach (5%) are within the top 5 most commonly diagnosed cancers, ranking second, third, fourth, and fifth, respectively. 4
Cancer is a major public health burden in both developed and developing countries. About 72% of all cancer deaths in 2007 occurred in low- and middle-income countries. 5 The same pattern of cancer deaths occurs in sub-Saharan African countries, particularly in Ethiopia. In Ethiopia, cancer accounts for about 5.8% of the total national mortality. According to the 2015 national cancer report of Ethiopia, among the entire adult population, breast cancer (30.2%), cervical cancer (13.4%), and colorectal cancer (5.7%) were the most prevalent cancers. As Ethiopia has diversified geographical area, in this study the spatial effect of cancer was also accounted for by determining the district where the patient resides. Assigning individuals to their place of residence also poses problems, 6 although this is usually the only location information that is available. Often the goal of a geographic analysis is to identify a common environmental exposure in a population, but exposures that are occupational or recreational may not necessarily reveal themselves in a residential analysis.
A study by Jennifer et al 7 reported that in Africa the number of cancer deaths is rising at an alarming rate, that is, the number of patients with cancer will increase almost 70% based on age demographics alone in 2030. Most cancers are diagnosed at an advanced stage in Africa mainly because of limited cancer treatment. Over 20% of African countries have no access to cancer treatments at all, whereas access is limited and sporadic in other countries. 7 There are only 4 hospitals in Ethiopia that give treatment for a small number of patients with cancer, which is a very small number for a country that has more than 100 million people. The FHRH in Bahir Dar is 1 of the 4 hospitals that provide treatment for patients with cancer in Ethiopia. It was launched at the end of 2016. The growing population coupled with lifestyle changes means an increasing burden of cancer. However, oncology services are wholly inadequate to serve the entire country in the essential time. As a result of this, most of the patients are being treated only at the advanced stage of disease and die within short period or as soon as they arrive at the hospital.
The main objective of this study was to assess the distribution of the risk of cancer by taking into account the spatial effect on district and explore whether there is spatial autocorrelation of incidence of cancer between districts. It was also aimed to determine the effects of some common clinical patient characteristics, complications, and prognostic factors on current patient status.
Methods
Data
The data for this study were obtained from the registry of cancer patients in the oncology ward of FHRH. Felege Hiwot Referral Hospital is located in Bahir Dar, the capital city of Amhara region and a metropolitan city in the North Western region of Ethiopia. The oncology ward of the hospital is designed to register all cancer patients coming from different districts of Western Amhara region (see Figure 1). Nurses working in the oncology ward of the hospital were selected and trained to collect the cancer data of patients from September 2016 to January 2019.

An overview map of the study region (yellow highlighted) in Amhara, Ethiopia, that consists of 6 zones. AW indicates Awi; BN, Benshangul; EG, East Gojjam; SG, South Gondar; SW, South Wollo; WG, West Gojjam.
Registries attempt to consolidate information by patient ID so that each case appears only once. Completeness of the data was checked and confirmed by a supervisor engaged in continuous supervision during data collection. For patients with cancer, a series of interventions, including psychosocial support or palliative care, surgery, and chemotherapy aimed at curing the disease or prolonging life considerably while improving the patient’s quality of life, were carried out. Data were collected from the oncology ward of the hospital by retrospectively reviewing all new cancer patients in the cancer registry center report. A series of questions using oral and medical tools regarding risk factors, main symptoms, complications, comorbidities, treatment options (if they had used any before coming to the hospital), and prevention and early detection measures of cancer were asked to evaluate the cancer identity of each patient. After data collection, information was entered into Excel datasheets and then exported to other statistical software SAS 9.4 and R 3.5.2 for analysis. In this study, data from 415 cancer patients were collected. Of these patients, 285 (68.67%) have undergone chemotherapy and 120 (28.92%) have undergone both chemotherapy and surgery (combined), whereas the rest (10 [2.41%]) of the patients were given palliative care. Palliative care is an urgent humanitarian treatment given to relieve pain rather than cure when patients have advanced stages of cancer and little chance of cure.
Variable description
Before clinical assessment was provided at the oncology ward of FHRH, patients were asked to fill in their life history (for patient characteristics, see Table 1), and unique patient ID was assigned. Patient characteristics/risk factors such as age, gender, residence, and blood type; prognostic factors such as stage; complications such as anemia; and treatment and patient status indicated in Table 1 are variables considered in this study. Variables mentioned under risk factors are factors associated with causing a cancer and determined by looking at things that influence the incidence of new cancer cases, whereas prognostic factors can only be determined by following up people who already have cancer. Risk factors are patient characteristics associated with the risk of contracting cancer disease, which include age, gender, residence, and blood type. On the contrary, details of prognostic factor, complication, and treatment were collected from patients during treatment in the hospital, and finally, the patient status was recorded in their registry card after receiving treatment. The prognostic factor (stage of cancer) and the presence of complication (anemia) were registered at the beginning of the diagnosis, that is, as soon as they are registered at the hospital. Complications of cancer are unanticipated/unforeseen diseases that arise after and as a result of cancer such as anemia in our study. Based on the information of patients in their registry card, the following variables were considered in this study (see Table 1).
Description of variables considered in this study.
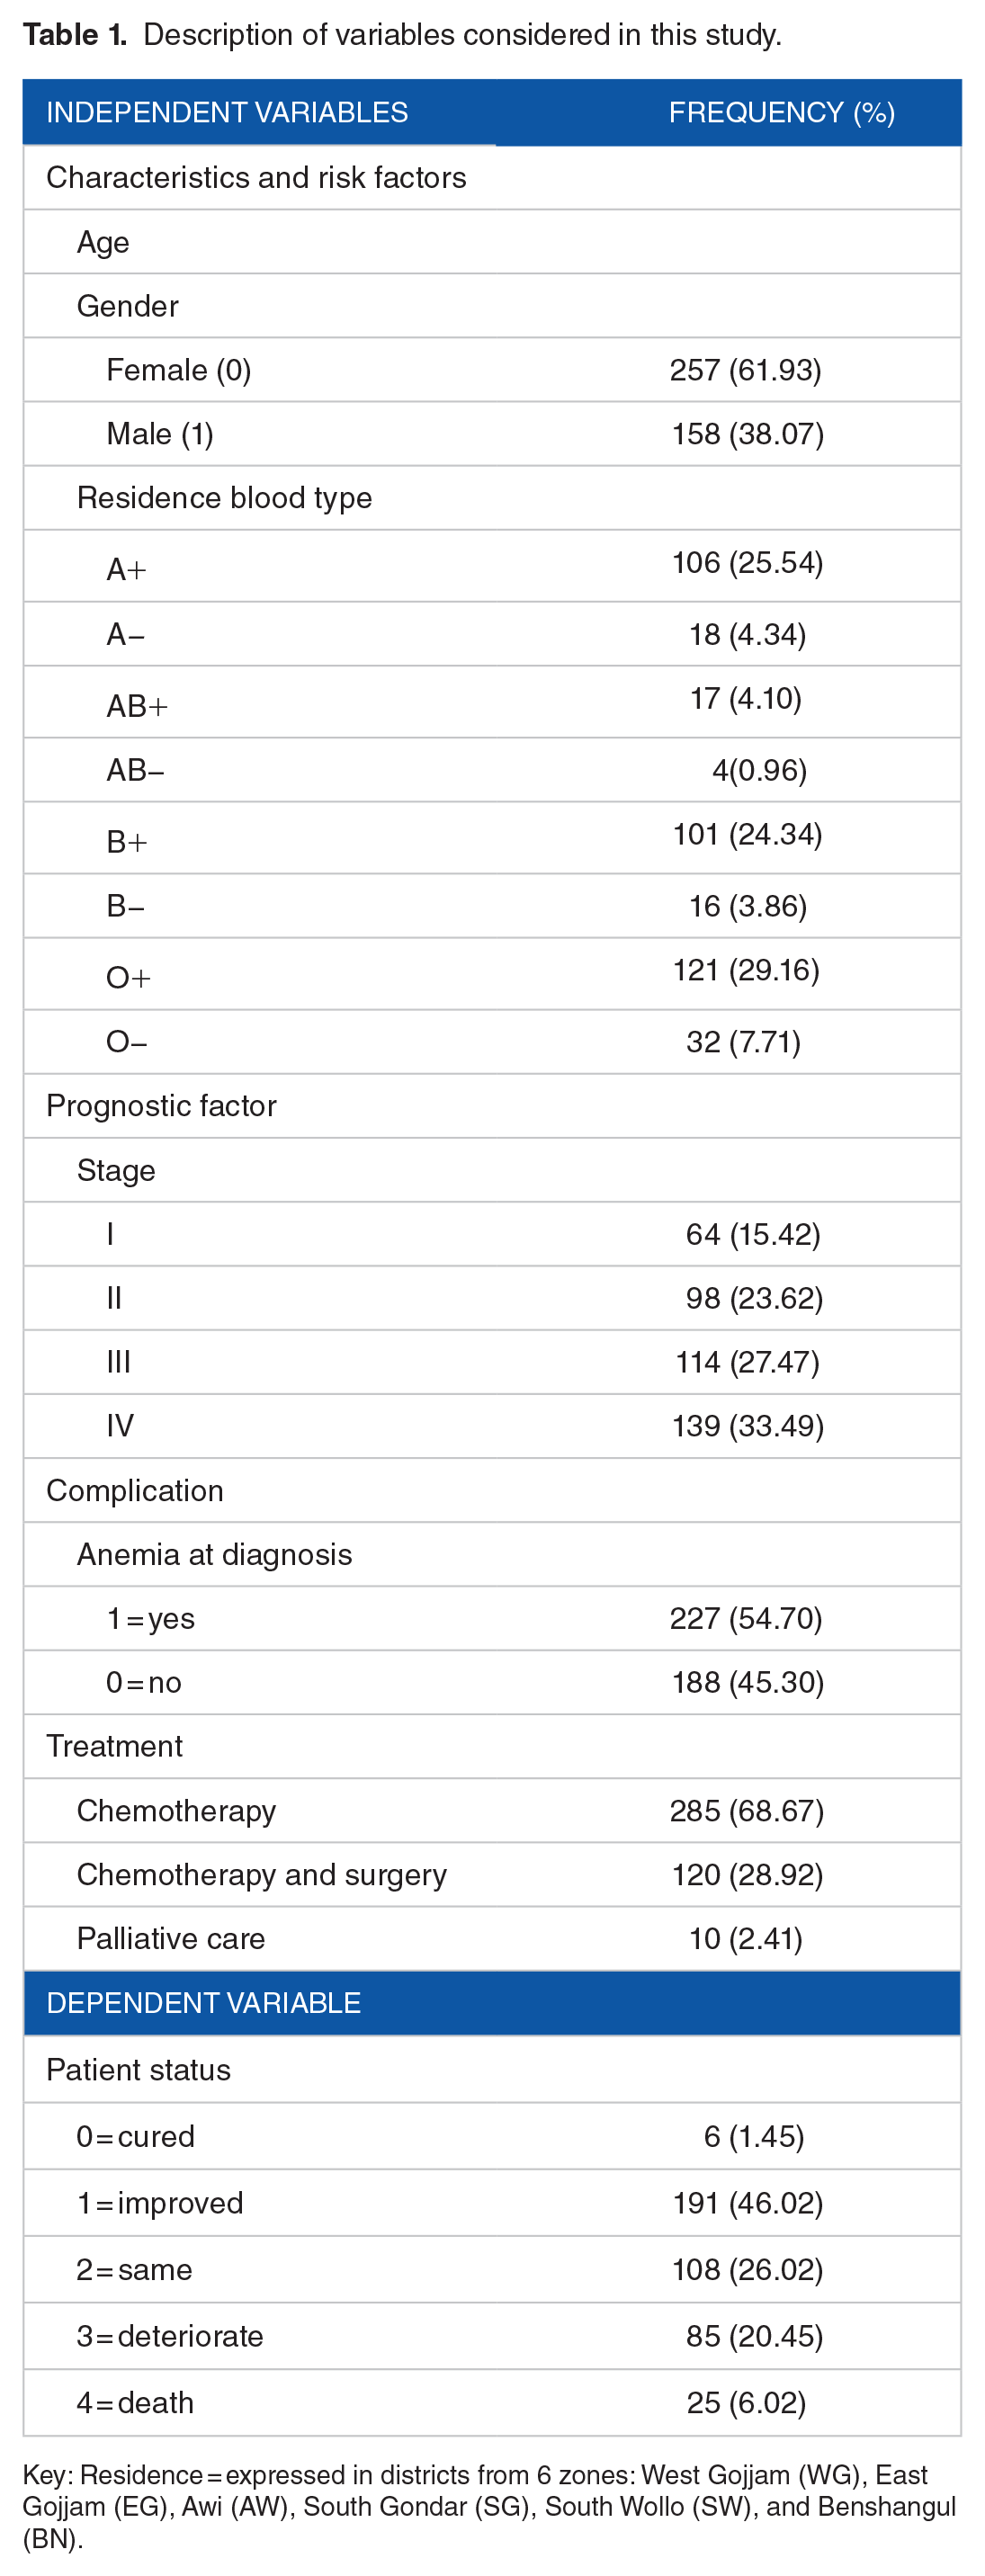
Key: Residence = expressed in districts from 6 zones: West Gojjam (WG), East Gojjam (EG), Awi (AW), South Gondar (SG), South Wollo (SW), and Benshangul (BN).
Statistical Modeling
Spatial analysis
Public health data, such as the cancer data under analysis, often show differences or patterns across different geographical areas. Ignoring such data during analysis may give faulty results and conclusions. Spatial analysis is an analysis which includes the influence of space into the analysis. All statistical methods of spatial data have to take the spatial arrangement, and the resulting correlations, of observations into consideration to provide accurate and meaningful conclusions based on the analysis.8,9
Spatial data are distinguished by observations that are obtained at spatial locations

In this case, the symmetric properties of
Spatial autocorrelation, covariation, or correlation between neighboring observations of variables gives us information on similarity between observations and similarity among locations. Based on the collection of weighted matrix, spatial proximity matrix, there are different measures of similarity that define different index classes. The 2 standard statistics that are used to measure the strength of spatial association among areal units are Moran’s I and Geary’s C. 10 Moran’s I is widely used, 9 and variations of it relate to likelihood ratio tests and best invariant tests for particular models of correlation for normally distributed random variables. Having the spatial proximity matrix constructed, Moran’s I statistics as a measure of global indexes of spatial autocorrelation with spatial proximity and similarity between areas i and j can be written as follows:

where
In testing the presence of spatial autocorrelation, the null hypothesis states that the nearby districts do not affect one another, which implies that there is no dependence and spatial randomness in the data. In contrast, the alternative hypothesis states that there is spatial association or dependence among the districts. The research hypothesis for this study states that the nearby districts in Western Amhara region have an association with or dependence on the risk of cancer. Spatial autocorrelation in the nearby areas is considered to be present when the test statistic such as Moran’s I takes on a larger value, compared with what would be expected under the null hypothesis of no spatial association.9,10 Spatial variable
Ordinal logistic regression model
Ordinal logistic regression analysis deals with the association of a dependent variable with independent variables when the dependent variable has more than 2 categories having natural order or rank.
12
The dependent variable Y is assumed to have an ordinal scale with J categories, and
When response categories are ordered, the logits can use the ordering, which results in greater power and simple interpretation. The cumulative probability for Y is the probability that Y falls at or below a particular outcome category j and is given by

where J is the number of categories for the response variable Y.
The cumulative logit model13,14 is given as follows:

where j = 1, 2, . . ., J−1, and the probability

The cumulative probabilities do not use the final one, P(Y ⩽ J), because it necessarily equals 1. The parameter
Random effects test
The random effects model is commonly used to detect whether the variable intended has random effect or not, beyond the fixed effect that is encompassed in the model.15,16 Random factors are not restricted to linear mixed models. Researchers want to incorporate random factors into nonlinear models to build a model that accommodates correlated data or to consider the levels of a factor as selected from a population of levels to make inference to that population. 15 Common questions in mixed modeling are whether variance components are zero, whether random effects are independent, and whether rows (columns) can be added or removed from the covariance matrix. The effect of cancer type was detected by including in the model as a random effect. The patient status within one cancer type is likely to be correlated with each other. The goal here is to make inference for the population in the study area of cancer types. This could be accommodated by incorporating the cancer type into the model.
The random test can be conducted in 2 ways: (1) by adding the random effect to the model that contains the fixed effects and perceiving whether there is pragmatic change in the estimated parameter or (2) using mixture χ2 statistic.13,15
Spatial mixed ordinal logistic regression model
Spatial mixed ordinal logistic regression (SMOLR) is an analysis which incorporates spatial effects into the mixed ordinal logistic regression model. Scholars in the study by Muhammad and Tuti Purwaningsih14,17 used different methods to account for spatial effect and estimate its effect in their model. The spatial logistic regression model in Muhammad and Tuti Purwaningsih
14
accounted for the spatial effect by including weighting of the ijth location through

where j is the jth category of the dependent variable and
Goodness of fit of the model
Before making any inference, we need to select the best model out of the proposed spatial ordinal logistic regression (SOLR) and SMOLR models. The likelihood and pseudo-likelihood methods were used to estimate the parameters in the SOLR and SMOLR models, respectively. To choose the best model, Bayesian information criterion (BIC) and Akaike information criterion (AIC) were used.13,14
Results
The mean age of patients at diagnosis was 43.5 years with a standard deviation of 15.54, and the median age was 45 years. The minimum age of patients included in the study was 2 years, whereas the maximum was 82 years. Most of the patients (72%) were between 30 and 60 years old, 16% were less than 30 years old, and the rest (12%) were more than 60 years old.
One-fourth of the patients (104 cases, 25.06% of the total) had advanced stages (IV) of cancer during diagnosis. This late detection and treatment of cancer leads to the substantial aggravation of the burden of cancers and bad outcomes of patient status. All patients took appropriate treatment based on physicians’ prescription. Of those patients who have taken treatment, only 1.45% were cured and 46.02% have improved, whereas in the rest of patients there was no change and they became even worse after treatment. This shows that it is less likely that the patient can be cured, but that the effect of diseases can be improved if effective measures are put in place to control risk factors, detect cases early, and offer good care to those with the disease. The response variable, patient status, is constructed by categorizing the severity of cancer into 5 types: cured, improved, same, deteriorate, and death (see Table 1). This type of categorization is used by the hospital to manifest the general status of patients after treatment. Nearly half (47.5%) of the patients have improved or have been cured, and one-fourth remained in the same status after treatment. The distribution of men and women within different cancer types is different. Figure 2 reveals that a large proportion of female patients suffer from breast (93.8%), gastric (88.9%), hepatocellular carcinoma (58.3%), rectal (61.5%), and ovarian cancer (97.2%). On the contrary, colonic (70.0%), Hodgkin lymphoma (100.0%), non-Hodgkin lymphoma (72.9%), pancreatic (75.0%), round blue cell tumor (66.7%), and sarcoma cancer (60.0%) were more predominant in male than female patients.

Distribution of the number of female (blue color) and male (red color) patients within different cancer types. CLL indicates chronic lymphocytic leukemia; HCC, hepatocellular carcinoma; HL, Hodgkin lymphoma; NHL, non-Hodgkin lymphoma; RBCT, round blue cell tumor.
There were 20 cancer types available and considered in this study based on the oncology ward cancer registry at the FHRH (see Table 2). This table revealed all types of cancer in the study and their corresponding number of patients and the percentage share that belongs to each cancer type among a total of 415 patients. Breast cancer was the highest cancer type (19.28% of the total) diagnosed, followed by NHL (16.87%).
Cancer types and respective number of patients.

Abbreviations: CLL, chronic lymphocytic leukemia; HCC, hepatocellular carcinoma; HL, Hodgkin lymphoma; NHL, non-Hodgkin lymphoma; RBCT, round blue cell tumor; SCCA, squamous cell carcinoma antigen.
Forty-one districts from 6 zones were considered in the study (Table 3). There are 13, 8, 7, and 10 districts from West Gojjam, East Gojjam, Awi, and South Gondar zones, respectively, whereas South Wollo and Benshangul are the only zones that consist of only 1 district. Patients belonging only to these districts were available in oncology cancer registry ward of the hospital.
Districts within zones, respective number of patients, and total number inhabitants (population at risk).

Abbreviations: AW, Awi; BN, Benshangul; EG, East Gojjam; SG, South Gondar; SW, South Wollo; WG, West Gojjam.
Address-matching of cancer registry records was obtained from the zone administration office of the districts, which was carried out using a commercial geographical positioning system (GIS) product to assign approximate latitude-longitude coordinates to a patient’s reported district of residence. The geographical coordinates were recorded by collaborating with GIS experts in the zone administration office. There were differential variations in patterns across the 41 districts. The highest incidence of cancer was recorded in Bahir Dar. However, the population at risk is not in the standardized form, in a sense that the highest incidence of cancer in Bahir Dar might be due to the high number of inhabitants in the district/city. This suspected problem was handled by standardizing the population at risk per 100 000 per district. Finote Selam district was then found to have the highest incidence of cancer (19.59 per 100 000 population) relative to other districts in the study (Table 4).
Incidence of cancer disease per 100 000 standardized population at risk of each district.

Figure 3 shows the incidence of cancer within different age groups irrespective of the sex of patients. Even if the population at risk within each age group was not standardized, the incidence of cancer among women and men is different. The incidence in women was high than men between the age group of 21 and 70 years, and vice versa in the age group below 21 and above 70 years. The incidence of cancer increases with increasing rate until it reaches age 50, using the average cubic estimated reference line. After age 50, the incidence of cancer declines with increasing rate.

Incidence of cancer in different age groups for women (black color) and men (red color).
For the sake of simplicity, to explore the incidence of cancer with age, the variable was constructed by categorizing into different age groups in which each group contains 5 years. This type of categorization is consistent with a previous report. 2 In Figure 3, the incidence of cancer in each age group was obtained by summing up the number of patients within the specified age group.
The description of the incidence of cancer described in Table 3 did not account for the population at risk in each district, which leads to biased conclusion. The highest incidence of cancer was recorded in Finote Selam district with an incidence rate of 19.5929, followed by Chagni district with an incidence rate of 14.6985, whereas the lowest incidence of cancer was recorded in Enemay district with an incidence rate of 1.1117, followed by Smada district with an incidence rate of 1.2120. Hence, to determine the incidence of cancer for each district, the population at risk should first be considered to have plausible description of the incidence rate. The latitude and longitude which show where each district is located in the Western Amhara region are illustrated graphically in Figure 4, which shows the incidence of cancer in each district.

Spatial distribution of the incidence of cancer (per 100 000 population) in the respective location specified by longitude and latitude for each districts.
The categorical covariates have different number of categories based on the nature of the covariate. The bivariate analysis using the χ2 statistic, presented in Table 5, shows the relationship between categorical independent variables and the dependent variable (categories of patient status—cured, improved, same, deteriorate, and death). The χ2 statistic was used to compare the actual frequencies in a bivariate table with the frequencies that would have been expected if there was no relationship between the variables. We can see from the table that the only variables not significantly associated with patient status were sex and blood group, meaning that the patterns of responses across both sex and different blood groups were essentially the same for all categories of the independent variable.
Association between patient status and covariates (N = 415).

key: Combined = both chemotherapy and surgery.
Table 5 shows that there is not any cancer patient with anemia who was cured. This might show how a complication like anemia would aggravate the severity of cancer. In parallel, of those patients who died of cancer, the higher proportion of patients (68.0%) had anemia and the remaining (32%) did not. From this, we can highly suspect that the patient status has a significant association with anemia. The corresponding P value of .001 indicates that anemia has significant association with patient status. The patterns of proportion of cancer patients with and without anemia seem to vary by patient status. Patients without anemia were more likely to enter into the lowest scale patient status (100% vs 0.00% for cured and 61.8% vs 38.2% for improved) than patients with anemia and less likely than patients with anemia to enter into the highest scale patient status (44.7% vs 55.3% for deteriorate and 32.0% vs 68.0% for death). The reverse is true for patient with versus without anemia.
There was a significant association (P = 0.001) between treatment given for patients and patient status. Among patients of the same status, 75.9% took chemotherapy, whereas 20.4% have taken both chemotherapy and surgery (combined). The stage of patients had a significant association with patient status. Most of the patients who died of cancer were in stages III and IV (20% and 64%, respectively). This shows that the odds of dying of cancer increases with the stage of patients, meaning the patients in advanced stages are more likely to die.
Spatial autocorrelation, Moran’s I test
The weighted matrix
Indicator of spatial autocorrelation.

To make the incidence of cancer comparable among different districts, the population at risk was standardized into 100 000 population. As a result, the values of incidence of cancer indicate the incidence of cancer out of a total of 100 000 population at risk in the given districts.
The Moran’s I index used to test the spatial autocorrelation can be described graphically (Figure 4) and can determine whether the decision made in the Moran’s I statistic was plausible and persistent. It also verifies whether there is evidence of clustering of incidence of cancer or whether there are districts that have unusual clusters of cancer so that simply we can perceive causal explanations by seeing whether there is spatial patterning of incidence of cancer.
The standardized incidence of cancer for each district is displayed in the form of maps in Figure 4. The color from warmer blue color to warmer red color shows districts with lower to higher incidence of cancer disease, respectively. The high value of incidence of cancer (19.5929) was found in Finote Selam district and the low incidence of cancer (1.1117) was found in Enemay district as described (Table 4). Enemay and Smada districts are found to have the lower incidence of cancer. One possible reason for this may be that both Enemay and Smada are districts that are very far from the treatment center and hence it will be difficult to come for diagnosis. Moreover, it might be because most of the people are living in rural areas and there is lack of awareness about the disease. On the contrary, both districts are highland with relatively cold weather condition compared with the other neighbor districts, which might lead the districts to have lower likelihood of the incidence of cancer.
Model Fitting and Estimating Parameters
Prior to directly fitting the model, some preliminary analysis was done to select the best fit model with appropriate covariates. The spatial variable (
Variables were selected using stepwise method of selection. In fact, it was also done manually using the backward and forward selection method, which results in the same set of variables. During stepwise variable selection, the selection was done by 15% entry and 20% stay significance level, as also mentioned in the study by Hosmer et al. 13 For all selected variables, all possible pairwise interaction effects were examined in the model. However, there was no any interaction effect between all selected covariates with 15% entry and 20% stay significance level. As numerous studies in different areas and eras18–23 reported that cancer is highly interrelated with age, we realized that maintaining the covariate age in our model (Table 7) is advisable. To perceive the effect of independent variables at the beginning, intercept-only ordinal logistic regression (OLR) model without any independent variables was fitted. Then, the OLR model that includes all independent variables including the spatial variable was fitted and model comparison was done using AIC and BIC. The estimated fit statistic of AIC (BIC) was 1056.067 (1072.180) and 924.848 (981.244) for intercept-only OLR and SOLR models, respectively. The dummy variable and the reference (*) variables indicated in Table 7 and the estimated SOLR model can be written by

where
Parameter estimates using intercept-only OLR model, spatial OLR model, and spatial mixed OLR model.
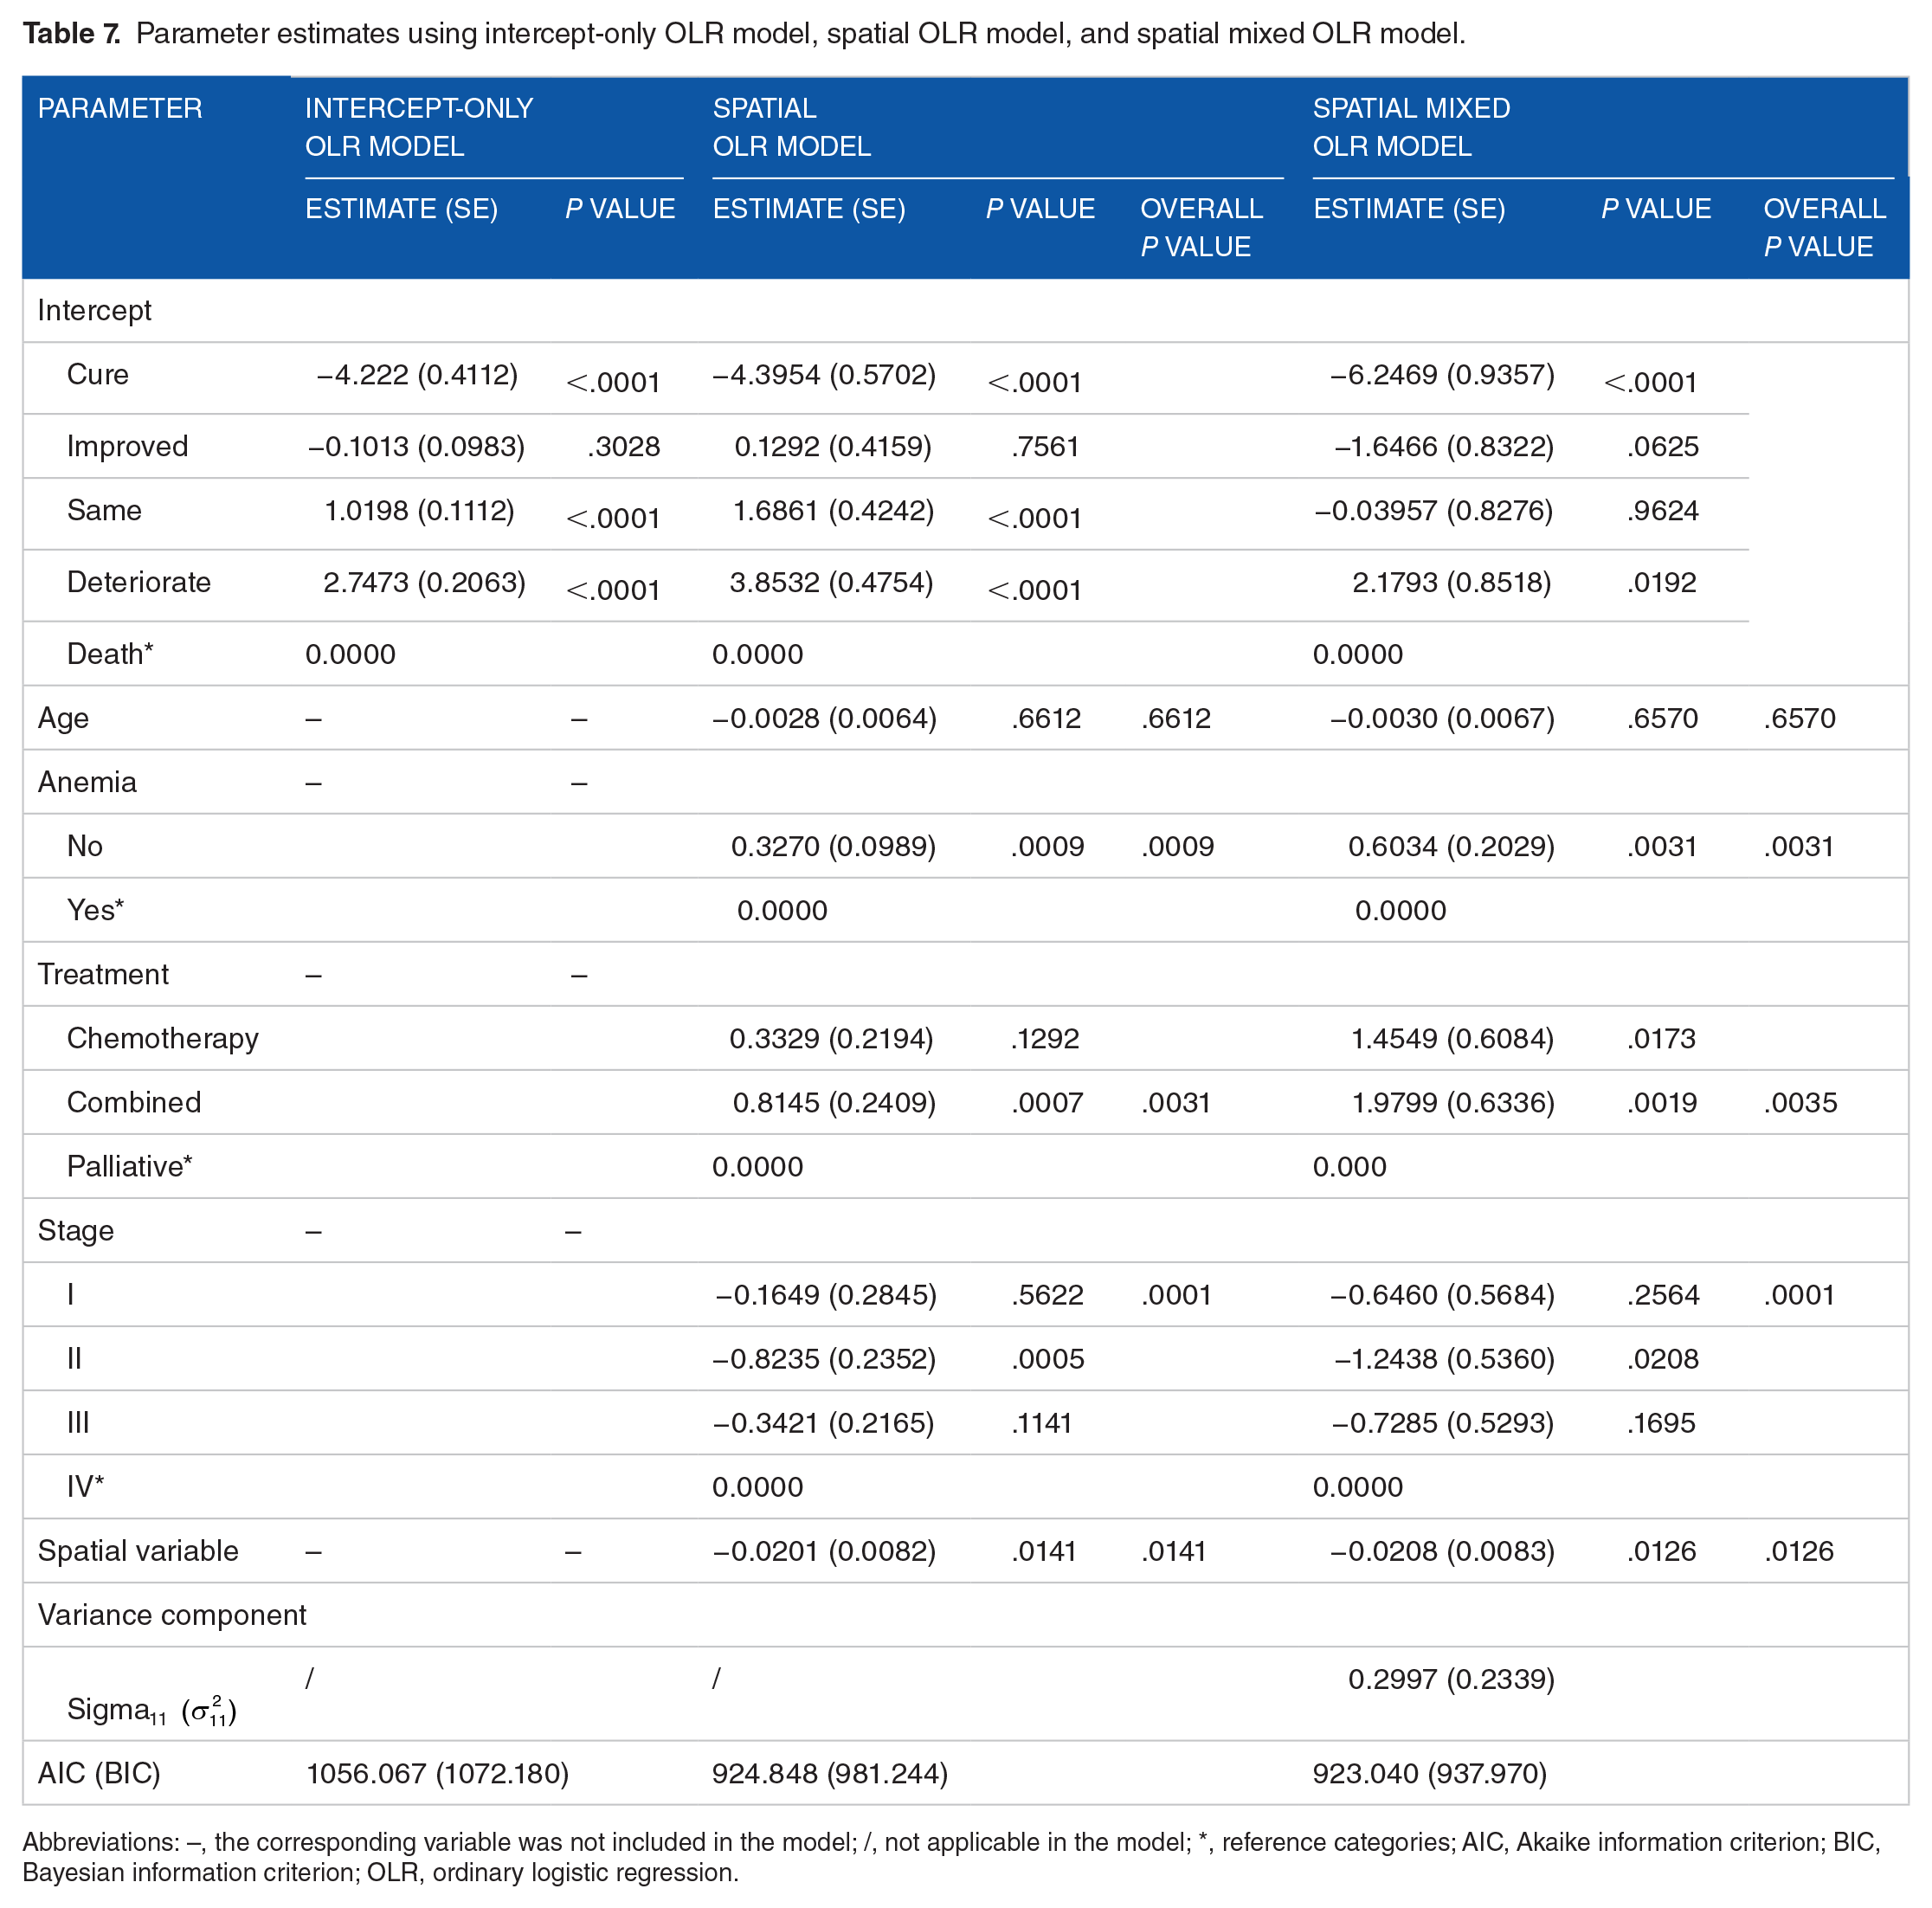
Abbreviations: –, the corresponding variable was not included in the model; /, not applicable in the model; *, reference categories; AIC, Akaike information criterion; BIC, Bayesian information criterion; OLR, ordinary logistic regression.
The requirement of random effects of cancer type in the model was tested using a mixture of χ2 distributions. These tests were done by adding cancer type as the random effect in the SOLR model which becomes the SMOLR model. The need for random effect was significant (
To estimate the parameters of the SMOLR model, estimation methods such as commutative logistic mixed model (clmm) and generalized linear mixed model (glimmix) using R and SAS statistical software, respectively, were used. Nevertheless, at the end, the estimated parameters for the models described in Table 7 were obtained using the glimmix SAS procedure.
Model comparison was done based on AIC and BIC, the model with the smallest AIC and BIC being preferred. The fit statistics AIC (BIC) for intercept-only OLR model, SOLR model, and SMOLR model were 1056.067 (1072.180), 924.848 (981.244), and 923.040 (937.970), respectively (Table 7). The SMOLR model having the smallest AIC (BIC) is therefore the best model for the data.
Therefore, the final estimated model can be written by

As patient status has 5 categories (J = 5), the model has 4 intercepts such as
The SMOLR model (Table 7) shows anemia at diagnosis, treatment, stage at diagnosis, and spatial variables have significant effects (P ⩽ 0.05) on log odds of probability of patient status category at j or below, but not age. The ordered logit (log odds) for patients with no anemia at diagnosis being in a lower patient status category was 0.6034 greater than patients who had anemia at diagnosis. The estimated odds among patients without anemia at diagnosis is 1.828 (
The estimated odds of patients who received chemotherapy treatment and patients who received both chemotherapy and surgery (combined) treatment was 4.284 (
Stage of patients at diagnosis also has significant effect on the log odds of probability of patient status at j or below category. The estimated odds of patients who had stage I cancer tumor at diagnosis to fall in the lower direction of patient status category was 0.524 (
It is noted that there is spatial autocorrelation between districts. In Table 7, P= .0126 also shows that there was spatial correlation of levels of patient status between districts. The spatial variable correlation with patient status was a negative value, −0.0208, which indicates that districts with lower levels of patient status are usually surrounded by districts with higher levels of patient status.
The goodness of fit of the model was assessed using the Hosmer-Lemeshow test.
13
The Hosmer-Lemeshow goodness-of-fit test statistic
Discussion
This article investigated the distribution of incidence of cancer disease across districts in the Western Amhara region, Ethiopia, and identified the factors that affect patient status by considering the limited number of patient characteristics from the patient registry card in FHRH. Twenty types of cancer were considered in the study, and of those cancer type, breast cancer was the highest diagnosed cancer type. A similar study conducted in Addis Ababa, Ethiopia, also found that breast cancer was the most common malignant neoplasm among women. 24 Among patients who were included in the study and received treatment, only 1.45% were cured and 46.02% improved, whereas the rest have no change in status because of treatment and were even worse after getting treatment.
The incidence of cancer within each district was assessed. To make the incidence of cancer comparable between districts, the population at risk was standardized 10 into the same 100 000 population at risk per district. Incidence of cancer showed significant variation across the different districts included in the study (19.59 per 100 000 population in Finote Selam to 1.11 per 100 000 population in Enemay). The spatial autocorrelation, association between the value of incidence of cancer observed in a given district unit and the value of incidence of cancer observed in neighboring district units, was checked using Moran’s I index and showed a negative autocorrelation. This means that a district in the neighborhood of high incidence of cancer is expected to have low incidence.
It was found that one-third of patients visited the hospital with advanced stage (IV) of cancer. This result which is in line with results obtained in Africa 7 and specifically in Ethiopia 25 tells us that as cancer treatment centers and health service delivery are limited in the country and due to the lack of awareness of the people about the disease, most cancer patients were diagnosed at an advanced stage. Treating the disease at advanced stage becomes difficult with the available technology and very limited cancer specialists in poor countries, which ultimately leads to most patients becoming incurable from the disease and needing palliative care.
Numerous studies18,26 have reported that cancer is a disease of aging, in a sense that the occurrence of cancer becomes high when people get older. However, this was not the case in this study as the incidence of cancer was predominantly concentrated in age between 41 and 55 years. It could be due to that the life expectancy in developed country, which the study by Bray et al 4 shows, is quite different from the life expectancy in developing countries like Ethiopia. Mostly in Ethiopia and particularly in our study area, West Amhara people mostly go to religious place while they become old instead of going to hospital to be cured from diseases. In fact, it might be also due to the fact that the population at risk within the age group was not standardized as the population at risk within each age group was not known to make it standardized. On the contrary, age did not have a significant association with patient status, which indicates that the malignancy of cancer tumor is not dependent on the age group to which the patient belongs.
It was found in our study that anemia complication with cancer has a significant effect on patient status. For patients with advanced stage of cancer, complication with anemia was a common manifestation in some other studies such as Danaei et al 26 and Benson et al. 27 The estimated odds of patients who have no anemia at diagnosis to fall in the lower patient status category equals 1.828 times the estimated odds of patients who have anemia at diagnosis. It means that patients with no anemia complication at diagnosis fall in the lower patient status category compared with those patients who have anemia complication during diagnosis. It was also found that the prognostic factor stage during diagnosis has its own effect on the patients’ status after they were given appropriate treatment based on the physician prescription. Different studies such as that by Pakzad 18 repeated that when stage (extent of tumor spread) increased during diagnosis, the patient status will become more likely very bad as curing or improving a patient with advanced stage is difficult. It is advisable to have early detection of the disease so that it becomes simple to decrease the malignancy of the cancer tumor in the given treatment.
ABO blood type is associated with increased risk of lung cancer based on the study by Urun et al. 28 In contrast, the study conducted in China 29 on gastric cancer explained that there is no significant association between blood group and cancer risk, which is consistent with our study. Hence, it can be recognized that the effect of blood group on cancer risk might depend on the cancer type.
The choice of treatment depends on where the cancer tumor is located, stage of the disease, and health status, 27 which was partially consistent with our study that the treatment type has significant effect on the patient status after taking treatment.
This study reveals that the spatial variable has negative significant effect where districts with lower levels of patient status were usually surrounded by districts with higher levels of patient status and that districts with higher incidence of cancer were usually surrounded by districts with lower incidence of cancer, which is in line with studies by Pakzad et al 19 and Shen et al. 20 This demonstrated that spatial epidemiology offers insight into ways that individual characteristics, community attributes, and physical environments interact to produce distinctive risk, illness, and disease management patterns.
Conclusion
Patients who did not have anemia complication during diagnosis were more likely to be cured and improved than those patients who had anemia complication. Most of the patients had advanced stage (IV) of cancer tumor, which dismantles the capability of the treatment to be less effective and increases the resistance of malignancy of the cancer tumor, and hence it was perceived that the stage of patients during diagnosis has its own impact on patient status after treatment. The age of the patient when the presence of cancer was disclosed has not significant relationship with the current status of the patient after taking treatment. If the patients are capable of undergoing surgery, on average giving both chemotherapy and surgery treatment was effective for patients to be in a better status. There was significant spatial correlation of incidence of patients with cancer between districts in which districts with high incidence of cancer were usually surrounded by districts with low incidence of cancer and vice versa.
Footnotes
Acknowledgements
We thank the personnel in the hospital who helped us collect the data and provided expert assistance. We would also like to acknowledge Dr Teshome Alene, staff of Medical Health at College of Medicine and Health Science, for technical and professional assistance.
Funding:
The author(s) received no financial support for the research, authorship, and/or publication of this article.
Declaration of Conflicting Interests:
The author(s) declared no potential conflicts of interest with respect to the research, authorship, and/or publication of this article.
Author Contributions
LMT conceived the idea of the research, conducted data analysis, interpreted the data, and prepared all figures and tables by verifying the analytical method. Both authors discussed the results and wrote the manuscript.
Availability of Data and Material
The data sets of generated analyses during the study were collected from Felege Hiwot Referral Hospital (FHRH), Bahir Dar, Ethiopia, by personnel in the hospital by initiation of Department of Statistics on behalf of Bahir Dar University. Anyone can access the data from the Hospital by proposing reasonable proposal request.
Ethical Consideration
Permission to undertake the study was obtained from Felege Hiwot Referral Hospital (FHRH) by the initiation of Department of Statistics on behalf of Bahir Dar University. The patients/participants were informed that participation was confidential and private information would be protected. Identification of patients/participants was done only through numerical codes, and data collection of the study groups was carried out only when privacy was ensured based on Ministry of Health Legislation in the FHRH.