
Abstract
Selected reaction monitoring (SRM) has become one of the main methods for low-mass-range–targeted proteomics by mass spectrometry (MS). However, in most SRM-MS biomarker validation studies, the sample size is very small, and in particular smaller than the number of proteins measured in the experiment. Moreover, the data can be noisy due to a low number of ions detected per peptide by the instrument. In this article, those issues are addressed by a model-based Bayesian method for classification of SRM-MS data. The methodology is likelihood-free, using approximate Bayesian computation implemented via a Markov chain Monte Carlo procedure and a kernel-based Optimal Bayesian Classifier. Extensive experimental results demonstrate that the proposed method outperforms classical methods such as linear discriminant analysis and 3NN, when sample size is small, dimensionality is large, the data are noisy, or a combination of these.
Keywords
Introduction
Proteomics is the field which deals with the study of cellular behavior and human disease at the protein level. Recently, cancer treatment and prevention have made great strides, thanks to the development of high-throughput technologies in proteomics. Among these, mass spectrometry (MS) analysis has become the preferred choice because of advantages such as high molecular specificity and better detection sensitivity. 1 Hence, MS is widely used in identification and quantification of complex proteome mixtures with the goal of discovering biomarkers, ie, molecular markers for disease.2–4
However, a major challenge in biomarker discovery is the identification of low-abundance proteins in peripheral blood. Selected reaction monitoring (SRM), conducted using a triple-quadrupole (QQQ) instrument, has an extended mass range and has become one of the main methods for low-mass-range–targeted proteomics by MS. 5
Nevertheless, in most SRM-MS biomarker validation studies, the sample size is very small due to the economic cost of the experiments and difficulty in recruiting cases. Typically, the number of features (measured proteins) is vastly larger than the sample size. Moreover, depending on the instrument sensitivity, the data can be noisy due to low peptide efficiency, ie, low number of ions detected per peptide.
All the aforementioned issues create a difficult challenge to classical data-driven classification methods. In this article, this is addressed by a model-based Bayesian method for classification of SRM-MS data. We perform Bayesian inference of the parameters of the SRM model proposed in the work by Atashpaz-Gargari et al 5 and build a kernel classifier, similar to the classifier for liquid chromatography-mass spectrometry (LC-MS) data proposed in the work by Banerjee and Braga-Neto. 6 As in the latter reference, our method uses a likelihood-free approach, called approximate Bayesian computation (ABC),7–9 which is necessary because the SRM model of Atashpaz-Gargari et al 5 is complex and does not have an analytical formulation of the likelihood. After calibration of the parameters, the ABC method is implemented via a Markov chain Monte Carlo (MCMC) procedure10,11 to obtain a sample from the posterior distribution of the protein concentrations. Small MCMC sample sizes are sufficient to obtain a kernel-based implementation of the Optimal Bayesian Classifier (OBC). 12 Extensive experimental results examining the effect of various parameters demonstrate that the proposed method outperforms classical methods such as linear discriminant analysis (LDA) and 3NN, 13 when sample size is very small, dimensionality is large, the data are noisy, or a combination of these.
The organization of the article is as follows. Section “SRM-based MS model” surveys the SRM-MS model. Section “ABC-MCMC classification algorithm” explains in detail the ABC rejection algorithm and the approximate Bayesian computation-Markov chain Monte Carlo (ABC-MCMC) classifier. Section “Numerical experiments and results” presents the numerical results. Section “Conclusions” presents concluding remarks.
SRM-BASED MS MODEL
In this article, we employ the model for the SRM pipeline proposed in the work by Atashpaz-Gargari et al. 5 Next, we review briefly each of the main components of this model.
Protein mixture model
The protein mixture model concerns the true abundance of proteins in the SRM experiment. There are

The variables
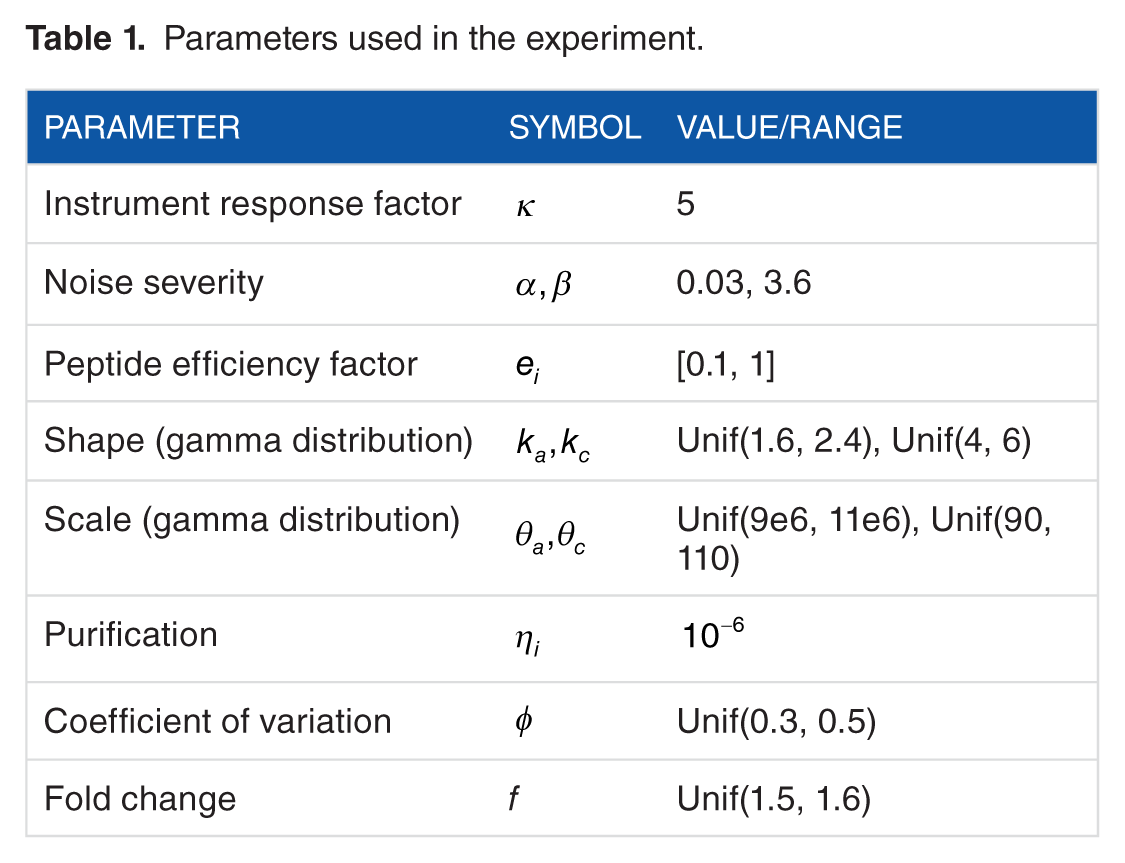
Parameters used in the experiment.
Proteins are divided into biomarker (differentially expressed) and nonbiomarker (not differentially expressed) proteins. We use fold change to quantify the difference:
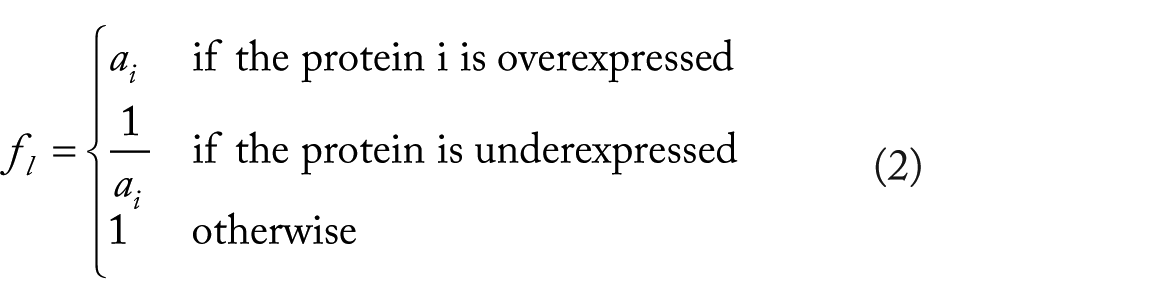
for
While the gamma distribution is chosen for mean protein concentrations, the variation of protein concentration is modeled by a multivariate gaussian vector. Accordingly, the concentration of protein
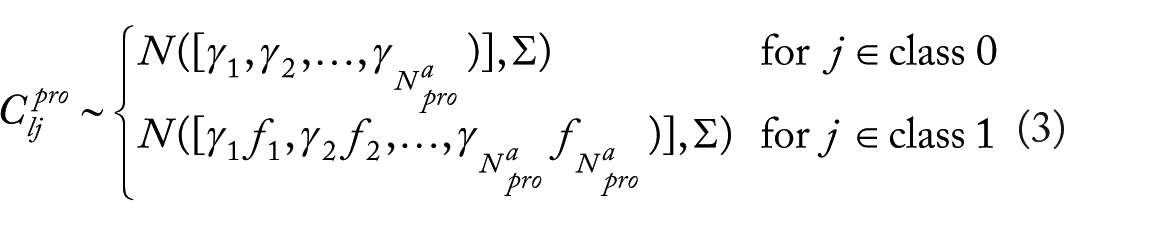
for

where

and

The coefficient of variation
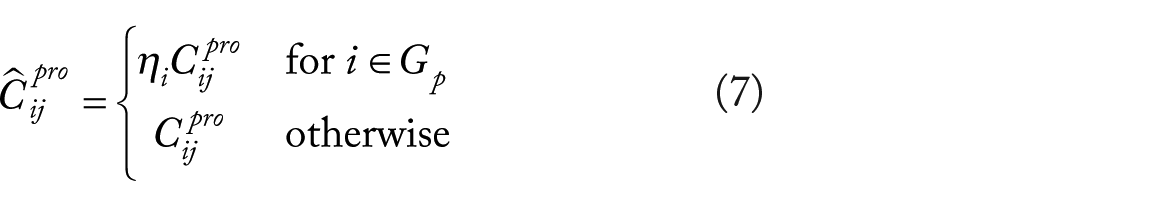
To model the purification process usually performed as part of the SRM-MS protocol, we select a set
The value for
Peptide mixture model
In SRM-MS, tryptic digestion of proteins is performed to generate small-mass peptides. Let

The readout abundance

Here,
However, the true peptide abundance is different from its readout value due to the noise:

where

where

where
The next step is called protein abundance roll-up. This is the process of obtaining the abundances of the parent proteins from the abundances and related characteristisc of their child peptides, detected during the MS1 process. To obtain the identities of the parent proteins, a second round of MS, called MS/MS, is often used and available databases of identities are searched. Here, we assume that the data from the rolled up abundances can be obtained and the readout of protein

where
ABC-MCMC Classification Algorithm
As described in the introduction section, the algorithm mainly has 3 steps: prior calibration via ABC rejection sampling, posterior sampling using an ABC-MCMC algorithm, and classification using a kernel-based method. We describe each of these steps below.
Prior calibration via ABC rejection sampling
Once the protein abundances as described in equation (7) are obtained, the total number of proteins
Baseline parameters
Prior hyperparameters:
Instrument parameters:

Prior calibration via ABC rejection sampling is as described in Algorithm 1. Monte Carlo integrations are performed to obtain a set of parameters and only some of them are kept and rest are rejected via comparing with a threshold. All the approximated triplets are averaged to obtain the optimal parameter.
In this algorithm,
Once the optimal parameters are obtained, the fold change vector is calculated by the following sample mean estimate:
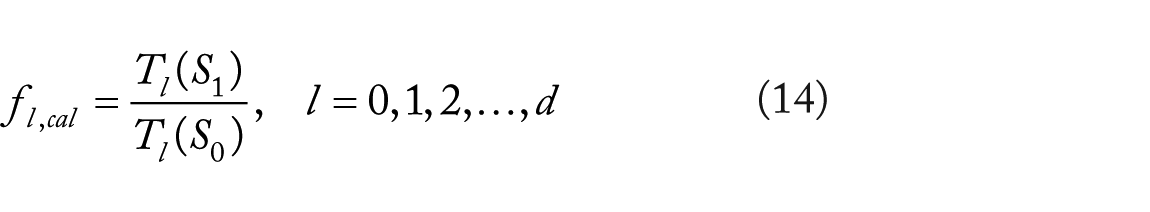
where
ABC-MCMC posterior sampling
ABC-MCMC sampling is as described in Algorithm 2. Vector

Kernel-based classification
We employ the kernel-based scheme proposed in the work by Banerjee and Braga-Neto, 6 which is itself based on the OBC in Dalton and Dougherty. 12 One of the issues with kernel-based classification is choosing the right value of the kernel bandwidth parameter. If the value of the bandwidth parameter chosen is high, then it leads to oversmoothing and thus hiding many details in the data distribution. However, a small value for the bandwidth parameter leads to undersmoothing and thus many spurious noisy elements in the data are not eliminated. To address this, we employ an ensemble method, where different classifiers with different bandwidth parameters are obtained and then majority vote is used for classification. The classification algorithm is described in detail in Algorithm 3.

Numerical Experiments and Results
In this section, we demonstrate the application of the proposed ABC-MCMC classification algorithm for SRM data, using a synthetic data set generated from a subset of the human proteome. We selected a list of proteins from the Drugbank and applied tryptic digestion of proteins using the OpenMS software. 15 Because our interest is in small sample sizes, we chose simple classification rules, which are known to perform well with small samples, for comparison: LDA and k-nearest neighbor (KNN) with k = 3.
Synthetic SRM-MS data were generated by the model described in section “SRM-based mass spectrometry model,” using the parameters in Table 1. Synthetic sample data for prior calibration were generated using the midpoint of the intervals specified in Table 1. For example, as
For the MCMC procedure, we consider 10 000 samples from the posterior distribution of
Effect of sample size
Figure 1 displays the average error rates for the different classification rules. The number of proteins selected is fixed at
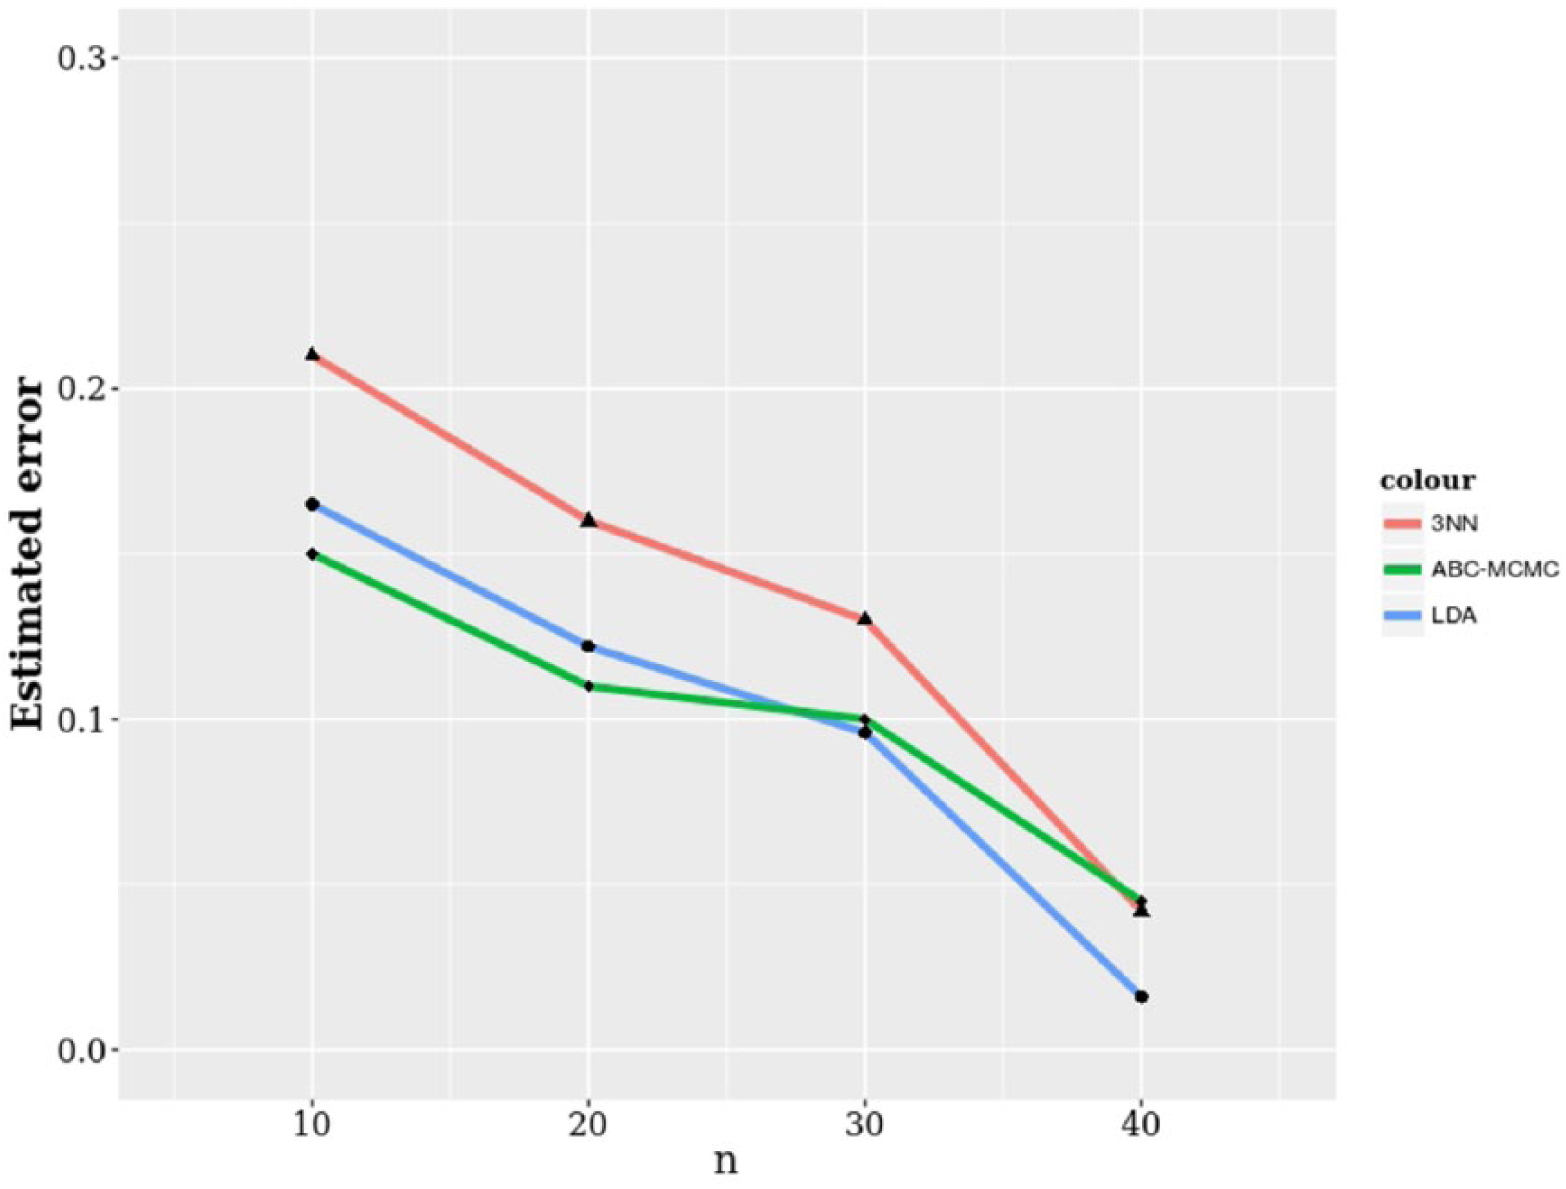
Average classification error rates against sample size for a fixed number of selected proteins
Effect of dimensionality
The average error rates of the various classification rules against dimensionality, ie, number of selected proteins, are displayed in Figure 2, for fixed sample size

Average classification error rates against number of selected proteins for a fixed sample size
Effect of variability
Here, we keep the sample size at

Average classification error rates against the coefficient of variation
Effect of peptide efficiency
Finally, we investigate the impact on the classification accuracy of varying the peptide efficiency. The peptide efficiency factor
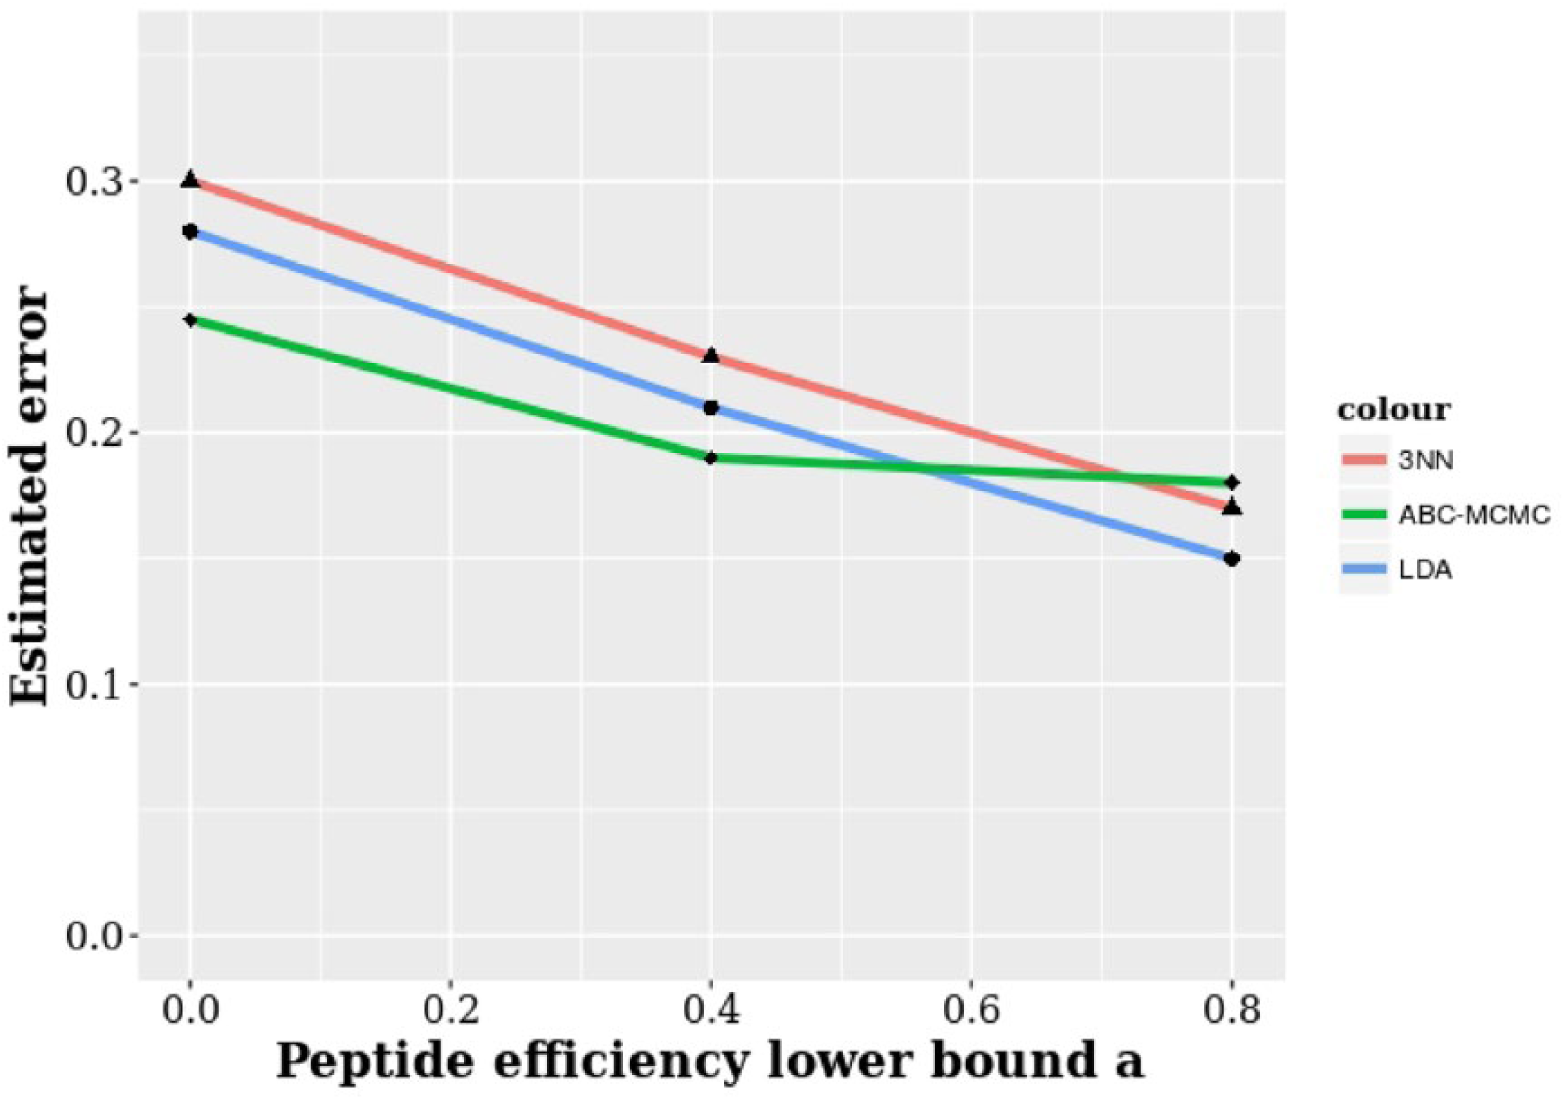
Average classification error rates against the lower bound for the peptide efficiency factor
Conclusions
In this article, we have proposed a Bayesian approach for classifying SRM data with the goal of facilitating biomarker development. This method is a combination of ABC and MCMC. We can see that for small sample sizes, large dimensionality, or noisy data, the performance of the proposed Bayesian classifier is superior to that of other approaches. Our results are based on a subset of the human proteome selected from the Drugbank, which are submitted to tryptic digestion in silico. In addition, the prior hyperparameters are calibrated using the available data. This makes the the approach realistic and broadly applicable. Because we are studying the effects of the various parameters of the SRM pipeline on the classification error, there is a need to use synthetic data from a generative model. The results are, however, expected to be reproducible on clinical SRM data.
Footnotes
Funding:
The author(s) received no financial support for the research, authorship, and/or publication of this article.
Declaration of conflicting interests:
The author(s) declared no potential conflicts of interest with respect to the research, authorship, and/or publication of this article.
Author Contributions
KN and UBN conceived and designed the experiments. KN analyzed the data. KN wrote the first draft of the manuscript. UBN contributed to the writing of the manuscript. Both authors read and approved the final manuscript.