
Abstract
Circulating biomarkers are of significant interest for cancer detection and treatment personalization. However, the biophysical processes that determine how proteins are shed from cancer cells or their microenvironment, diffuse through tissue, enter blood vasculature, and persist in circulation remain poorly understood. Since approaches primarily focused on experimental evaluation are incapable of measuring the shedding and persistence for every possible marker candidate, we propose an interdisciplinary computational/experimental approach that includes computational modeling of tumor tissue heterogeneity. The model implements protein production, transport, and shedding based on tumor vascularization, cell proliferation, hypoxia, and necrosis, thus quantitatively relating the tumor and circulating proteomes. The results highlight the dynamics of shedding as a function of protein diffusivity and production. Linking the simulated tumor parameters to clinical tumor and vascularization measurements could potentially enable this approach to reveal the tumor-specific conditions based on the protein detected in circulation and thus help to more accurately manage cancer diagnosis and treatment.
Introduction
Despite ongoing efforts to improve diagnosis and treatment, cancer continues to claim over eight million deaths per year worldwide. 1 Two dominant approaches have been cited 2 to improve outcomes: (1) earlier detection and (2) improved treatment personalization.3,4 A focus on earlier detection stems from recent studies observing that earlier detection5,6 can improve outcomes >30%. A focus on treatment personalization stems from the recognition that therapeutic approaches, highly effective in some patients, may have little or no benefit to other patients seemingly with the same tumor type. 7 Consequently, tools to correctly assign patients to treatment plans are critical. Ideally, relatively cheap, highly accurate, blood biomarker-based diagnostic tests could help diagnose disease and subsequently manage treatments.
Biomarker discovery approaches attempt to find proteins that are (1) relatively unique to the tumor, (2) indicative of its presence and likely behavior (eg, treatment response), and (3) easily quantifiable in the circulation. The underlying hypothesis of biomarker discovery approaches is that pathophysiological changes in cells or tissues are reflected through genomic alterations that influence protein expression in a disease-specific fashion. Accordingly, biomarker-discovery approaches have asserted that many potential markers are tumor-derived proteins that are shed from the tumor into circulation.
The biophysical processes governing how a protein leaves cancer cells, transits to the blood, and persists in circulation remain incompletely understood. As a purely empirical approach cannot measure shedding and persistence rates for all proteins across all tumor sizes, architectures, cell compositions, and types, we apply an interdisciplinary modeling-experimental approach as a first step toward linking biomarker expression to tumor state of viability. The ultimate goal for such an approach is to uncover fundamental biophysical processes of tumor progression, protein shedding, and protein persistence that underlie biomarker discovery, thereby accelerating biomarker development to help overcome challenges faced in cancer diagnosis and treatment.
Previous studies have advanced computational modeling to address the need for an integrated, quantitative analysis of tumor progression, typically using diffusion reaction equations describing the space and time dynamics of mass and diffusible substances (see reviews 8–18). Models using multiscale approaches (ie, linking events across subcellular, cellular, and tumoral scales),19–32 studying vascularized tumor treatment,33–42 and evaluating nanotherapy37,41–52 have also been developed. Parameters in these models can be coupled with biological and clinical data, including measurements from
Methods
Simulation of Protein Shedding by Vascularized Tumor Lesions
The mathematical model is based on Refs. 22, 37, 48, and 63 and is capable of representing in two spatial dimensions, viable and necrotic tumor tissues with angiogenesis-driven vascularization similar to that of tumor lesions and with shedding and transport of molecules throughout these tissues. The model dynamically couples a continuous tumor growth component with an angiogenesis model and accounts for blood flow, transcapillary fluid flux, interstitial fluid flow, and lymphatic drainage. This approach enables simulation of the complex interactions between tumor cells and their microenvironment and the associated protein shedding and transport. Tumor growth is calculated based on the balance of cell proliferation and death. Proliferation depends on adequate cell nutrients and oxygen. Death is induced by levels of nutrients below a certain threshold. Model parameter values are calibrated to experimental data as in Refs. 30–32, 34, 35, and 48. The model and its parameters are described in the following sections.
Tumor Growth
The tumor model component is based on Ref. 63, Briefly, the tumor tissue is denoted by Ω, and its boundary is denoted by Σ. In general, tumor tissue may have a proliferative region Ω

where μ is a cell mobility representing the net effects of cell–cell and cell–matrix adhesions, 
where λ
Angiogenesis
The vasculature model component is inspired by Ref. 64 and based on Refs. 22 and 63, representing blood flow, vascular leakage, and vascular network remodeling due to wall shear stress and mechanical stresses imposed by the tumor tissue. The vasculature model is described in detail in Refs. 22 and 63. The main model parameters influencing vascular flow include blood vessel pressure, vessel radii, vessel wall hydraulic conductivity, and osmotic pressure difference, with values set from previously reported experimental work. 22 We simulate a simplified lung capillary organization composed of square elements, acknowledging that in reality the capillaries are heterogeneously delineated by the lung alveoli. As the tumor grows within this vascular environment, the tissue may locally experience heterogeneous access to elements diffusing from the vasculature, which may depend on tissue pressure as well as distance from the nearest vascular source.
Transport of Oxygen and Nutrients
The transport of nutrients (

where 
Production and Transport of Protein
Similar to the model for production, diffusion, and uptake of tumor angiogenic factors (TAFs),22,63 which drives the angiogenesis process, the tumor cells are simulated to shed proteins ranging from very small (with size comparable to insulin, 5.7 kDa) to very large (with size comparable to titin, 3,700 kDa) when in a particular state (eg, hypoxic) and when transitioning into or out of this state. We define
Once shed, the proteins diffuse through the interstitial space and either decay or enter circulation into the surrounding vasculature. Assuming steady-state conditions, the overall mass balance for a protein 
where
For all the diffusion equations, as well as the pressure and angiogenic factors, the conditions at the boundaries are
A fivefold range of protein production rates was simulated, and a fivefold range of interstitial diffusivities was simulated for each production rate (Table 1). Since the effect of diffusivity is nonlinear, the values within the defined range were separated by a constant factor (3.76) to span from the lowest to the highest value. For simplicity, very small molecules were assumed to have the highest interstitial diffusivity, similar to that of insulin, while very large molecules had the lowest interstitial diffusivity, on the order of magnitude of that of larger proteins, such as titin. Protein transfer rates into the vasculature as well as decay rates were in this study assumed to be the same for all types of proteins.
Main model parameters and associated values.

Value is rescaled by the square of the simulation system characteristic length (1 cm) and divided by the system characteristic time (one second) multiplied by the oxygen diffusivity80 (1 × 10⁻⁵ cm2/s).
Values are rescaled by the model production rate of VEeGFf-Aa (VEeGFf-165) protein.
Model Parameters
The main parameters of the model are summarized in Table 1. All other parameters are as in Ref. 22.
Experiments in Vivo to Obtain Tumor Protein Data
Protein data were obtained from our previous study. 61 The methods are summarized in the following sections.
Xenografts and Sample Collection
Epidermoid carcinoma A-431 cells (2 x 10⁹) (ATCC) were mixed 1:1 with Matrigel (BD Biosciences) and subcutaneously injected into the flanks of nude athymic BALB/c female mice (Charles River Laboratories). All animal experiments were performed as per the institutional guidelines and were approved by the Institutional Animal Care and Use Committee at Cedars-Sinai Medical Center (IACUC Number 001276). Tumor volumes were measured twice a week with a digital vernier caliper and were calculated as: π/6 x (larger diameter) x (smaller diameter). Tumor tissue and plasma were harvested after 18 days postinjection in order to avoid animal discomfort due to tumor burden. At this time, the average size of tumors was 2,500 mm3. Frozen tumor pieces from five mice were individually ground in liquid nitrogen with the aid of a ceramic mortar, and equal masses of individual tumor homogenate were pooled and suspended in RAF buffer (50 mM Tris-HCl, pH 7.4; 1% NP-40; 0.25% sodium deoxycholate; 150 mM NaCl; 1 mM EDTA, 1mM PMSF; 1 mg/ml each aprotinin, leupeptin, pepstatin; 1mM Na3VO4; 1 mM NaF). The homogenate was centrifuged for five minutes at 200 x
Fractionation of Plasma Samples
Tumor samples were fractionated by reversed-phase chromatography using 1 mg of total protein. All samples were reduced with Dithiothreitol (DTT) (0.6 mg DTT/mg protein) and alkylated with iodo-acetamide (3 mg IA/mg protein) prior to chromatography as in Ref. 66. The separation was performed in a POROS R1/10 column (4.6650 mm, Applied Biosystems) at a flow rate of 2.7 mL/min using a linear gradient of 10–80% of organic solvent over 30 minutes. The aqueous solvent was 5% acetonitrile/95% water/0.1% trifluoroacetic acid, and the organic solvent was 75% acetonitrile/15% isopropanol/10% water/0.095% trifluoroacetic acid. Fractions were collected at a rate of three fractions per minute, and 72 fractions were collected. Each fraction was individually digested in solution with trypsin (400 ng/fraction). 67 Adjacent fractions were combined based on protein chromatography features, resulting in a total of 25 fractions for mass spectrometry analysis. Plasma samples were subjected to two-dimensional fractionation based on the previously described intact protein analysis system approach.67–70 Briefly, the sample was diluted to 10 mL with 20 mM Tris (pH 8.5) in 6% isopropanol and 4 M urea and immediately injected on an anion exchanger, Mono-Q 10/100 column (Amersham Biosciences Corp.), for the first dimension of the protein fractionation. The buffer system consisted of solvent A (20 mM Tris, pH 8.5, in 6% isopropanol and 4 M urea, pH 8.5) and solvent B (20 mM Tris in 6% isopropanol, 4 M urea, and 1 M NaCl). The separation was performed at a flow rate of 4.0 mL/min in a gradient of 0–35% solvent B for 44 minutes, 35–50% solvent B for three minutes, 50–100% solvent B for five minutes, and 100% solvent B for an additional five minutes. A total of 12 pools were collected. Each pool was then subjected to a second dimension of separation by reversed-phase chromatography. The reversed-phase fractionation was carried out on a POROS R2 column (4.6650 mm; Applied Biosystems) using trifluoroacetic acid/acetonitrile as a buffer system (solvent A: 95% H2O, 5% acetonitrile, and 0.1% trifluoroacetic acid and solvent B: 90% acetonitrile, 10% H2O, and 0.1% trifluoroacetic acid) at a flow rate of 2.7 mL/min. The gradient was 5% solvent A until the absorbance reached baseline (desalting step) and then 5–50% solvent B for 18 minutes, 50–80% solvent B for seven minutes, and 80–95% solvent B for two minutes. During the run, 72 900–mL fractions were collected. Each fraction was individually digested in solution with trypsin (400 ng/fraction), and the fractions were grouped into eight pools based on chromatographic features, corresponding to a total of 96 fractions for analysis from each experiment.
Protein Identification and Quantification
Liquid chromatography-tandem mass spectrometry (LC-MS/MS) was performed as described previously.
67
Briefly, pools of fractions were individually analyzed by LC–MS/MS in a LTQ-FTICR or LTQ-Orbitrap Mass Spectrometer (Thermo-Finnigan LLC) coupled to a nanoflow chromatography system (Eksigent) using a 25–cm column (PicoFrit 75 mm ID, New Objective) packed in-house with Magic C18 resin (Michrom BioResources) over a 90–minute linear gradient. Acquired data were automatically processed using default parameters, except where noted using the Computational Proteomics Analysis System, version 8.2.
71
The tandem mass spectra were searched against version 3.44 of the human International Protein Index (IPI) (71,884 protein entries) and mouse IPI (version 3.44 with 55,078 protein entries) databases. The searches were performed with X! Tandem (version 2008.02.01). The mass tolerance for precursor ions was set to 5 ppm. The mass tolerance for fragment ions was set to 0.5 Da. A fixed modification of 71.0371 mass units was added to cysteine residues for database searching to account for the acrylamide modification, and 3.01 Da were used as variable modification to account for the heavy cysteine isotope. All identifications with a PeptideProphet
72
probability >0.95 were submitted to ProteinProphet,
73
and each of the subsequent protein identifications was required to have at least two unique peptides with tryptic fragments (one missed cleavage) with allowance for variable modifications on
Comparison of Human and Mouse Database Entries
Protein sequences in human database (human IPI version 3.44) and mouse database (mouse IPI version 3.44) were computationally digested with trypsin, and a minimum of seven residues was used to match the X! Tandem default search parameter of the minimum parent fragment.
Data Processing and Integration
To facilitate comparisons of protein groups among samples, data were aligned by tracking all proteins that were members of a single ProteinProphet group as described by Ref. 75. This provided an analytic data set with one row for each protein group and specifically a column with values indicating the spectral count for proteins in each sample consistent with that group. The cellular location for each protein sequence was determined using the March 2008 generic GO slim from the Gene Ontology (GO) consortium (http://www.geneontology.org/GO.slims.shtml). GO slim files are reduced ontologies with significantly fewer categories than the complete GO ontology. The script
Results
Evolution of Tumor Growth in Time
The simulated tumor begins within normal host tissue as a small avascular nodule (<100 μm) surrounded by normal (capillary) vasculature (Fig. 1A). Even though the nascent lesion is minuscule, the viable tissue is already shedding proteins produced by proliferative cells as well as a small number of hypoxic cells. Necrosis, however, is absent. As the cells proliferate and exceed the supply of oxygen in the surrounding microenvironment, hypoxia develops and triggers the release of TAFs that diffuse out of the tumor. 63 The surrounding capillaries uptake the TAF and start proliferating into small irregular capillaries that grow toward and into the tumor tissue. With increased access to nutrients, the lesion is able to grow larger, which in time leads to the development of hypoxia and necrosis, as the tissue geometry is distorted and the metabolic demand from the proliferative tissue exceeds the vascular supply. By Day 18, the lesion has grown to 750 μm in diameter (Fig. 1B), surrounded by numerous angiogenesis-induced capillaries. By this time, there are substantial levels of proliferative tissue-, hypoxic tissue-, and necrotic tissue-related proteins shedding into the vasculature.22,63

Visualization of protein shedding by tumor lesion at (
Figure 2A quantifies the fractions of proliferative, hypoxic, and necrotic tumor tissues from inception (Day 0) through Day 18, at which time 49% of the tissue is proliferative, 18% of the tissue is hypoxic, and 33% of the tissue is necrotic. After Day 6, the angiogenesis-induced supply of nutrients stabilizes the change in the tumor cell fractions, as noted by the smoother curves in Figure 2A, which is consistent with previous experimental observations showing the stabilization of tumor-induced vasculature by Day 6 after inception. 76 The ratio of neo- and pre-existing vasculature to tumor tissue during the course of growth is shown in Figure 2B. The neovascular development, in response to the tumor hypoxia, follows an oscillatory pattern with an increasing trend in time, reaching 0.5 by Day 17, whereas the pre-existing vasculature-to-tumor ratio remains fairly constant at ~0.1 after Day 6 as the growing tumor begins to co-opt the surrounding vessels. This simulates a highly vascularized lesion, with results consistent with previous modeling work. 46
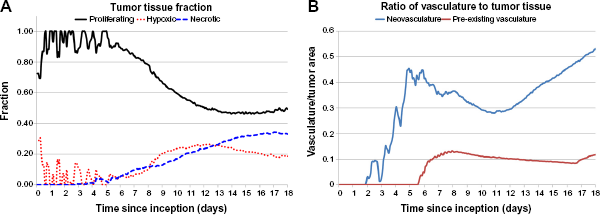
Analysis of tumor evolution. (
Evaluation of Proliferative Tissue-Related Protein-Shedding Dynamics
During the growth of the tumor, viable proliferative cells are simulated to secrete proteins (as defined in the Methods section), and in previous work, we have observed the extracellular domains of such proteins for viable cells. 77 In contrast, necrosing cells release their internal content into the surroundings, which includes the intracellular proteins. Figure 3 shows the amount of protein per tumor unit area released into the vasculature over the course of 18 days as a function of protein diffusivity and for a medium production rate. Following lesion inception, the initial amount entering vasculature by Day 4 is large, with the higher diffusing proteins approaching 2,200 per tumor unit area and the lower diffusing proteins being 45% less (~1,200). By Day 5, the overall amount of shedding into the vasculature reaches a maximum of ~2,500 for the higher diffusing category and ~1,600 for the lower diffusing category. As cell viability is restrained by insufficient tumor cell access to oxygen and nutrients, the amount of proteins entering the vasculature is correspondingly lowered beyond Day 5.

Proliferative tissue-related protein shedding into vasculature from tumor lesion inception to Day 18 for a medium production rate._
The hypoxic conditions developed within the first five days lead to vessel creation through angiogenesis, which stabilizes the proliferation process and enables the lesion to grow in a more measured manner, as has been observed experimentally. 76 Once the vasculature is functional, the model assumes that proteins shed by the tumor can enter the circulation. The amount of proteins released into the vasculature reflects this condition by the smoother curve in Figure 3 starting on Day 6. Interestingly, a 45% decrease in protein shedding is observed during Days 5–12, reflecting a transient deterioration to vascular access by the tumor tissue. In time, this phenomenon is expected to reflect oscillations in tumor-to-vessel ratio, which have been observed in previous modeling 21 and experimental 78 work. Simulation of proliferative tissue-related proteins with low and high production rates (not shown) evince smaller and larger amounts of protein released into the vasculature, respectively, but maintaining overall a similar profile in time as in Figure 3.
Evaluation of Hypoxic Tissue- and Necrotic Tissue-Related Protein-Shedding Dynamics
Figure 4 illustrates the release of hypoxic tissue-related proteins into vasculature as a function of their diffusivity and for a medium production rate. There is a spike of mostly high and medium-high diffusivity proteins at lesion inception on the first day, as tumor cells struggle to gain access to oxygen and nutrients from the surrounding (pre-existing) vasculature. For the next seven days, mostly high and medium-high diffusivity proteins make it to the vasculature and evince a rapidly fluctuating pattern reflecting sporadic angiogenesis. As the vasculature stabilizes after Day 7 to reach more regions of the growing tumor, 76 hypoxic tissue-related proteins of all diffusivities are shed more steadily into the vasculature, although still favoring the higher diffusing proteins by a 50% higher amount compared to the lower diffusing category.

Hypoxic tissue-related protein shedding into vasculature from tumor lesion inception to Day 18 for a medium production rate.
The release of nonviable cell (necrotic tissue-related) proteins for a medium production rate is shown in Figure 5. As expected, initially (Days 0–5) the overall amount is negligible since most of the cells are viable in the lesion. Within the next four days, the amount of protein shed increases by 300% as necrosis develops due to inadequate vascular access. The extent of necrosis stabilizes beyond Day 14, as the lesion becomes vascularized and the process of angiogenesis better balances with the oxygen and nutrient demand of the proliferating tumor cells, as has been observed to occur experimentally between Days 8 and 20 postlesion inception.76,79 The exact timepoint depends on cell type and tumor conditions, and thus, Day 14 in the simulations reflects an average time. Interestingly, there is a steep disparity between the amounts of necrotic tissue-related proteins entering the vasculature based on their diffusivity (spanning a range of ~550 to ~130 proteins per tumor unit area from high to low diffusivity, respectively), in contrast to the proliferative tissue- (range of ~1,700 to ~1,300) and hypoxic (range of ~700 to ~400) tissue-related proteins.

Necrotic tissue-related protein shedding into vasculature from tumor lesion inception to Day 18 for a medium production rate.
Similar to the proliferative tissue-related proteins, simulation of hypoxic tissue- and necrotic tissue-related proteins with low and high production rates (not shown) evince smaller and larger amounts of protein released into the vasculature, respectively, but maintaining overall a similar profile in time as with the medium production rate.
Assessment of Stage of Tumor Growth Based on Protein Shedding
The ratio of high-to-low diffusivity proteins associated with a specific cellular state may provide an indication of the stage of tumor growth as well as the extent of its vascularization. Figure 6 shows these ratios calculated for the proteins released by proliferative, hypoxic, and necrotic tissues for a medium production rate. In general, a larger ratio would indicate that the tumor tissue releasing these proteins is poorly vascularized, as the lower diffusing proteins have difficult shedding into the circulation. This hypothesis is supported by the ratio of 4.0% obtained for the necrotic tissue-related proteins compared to 1.7% for the hypoxic tissue-related proteins and 1.2% for the proliferative tissue-related proteins. The poor vascularization during the initial days after lesion inception is also reflected in the higher ratios obtained for all the cellular states, while the associated fluctuations reflect the transient instability of the incipient angiogenesis process.

Ratio of high-to-low diffusivity proteins provides an indication of the stage of tumor growth and the extent of tumor vascularization.
Figure 7 plots the cumulative amount of proliferative tissue-related protein shedding into vasculature from inception through Day 18, based on variation in protein diffusivity and rate of protein production. As expected, the proteins with the highest amount of release into vasculature (~100,000) have high diffusivity and a high production rate, while those with low diffusivity and a low production rate represent the smallest amount (~19,500). More interestingly, the plot highlights the three-dimensional interaction landscape among protein diffusivity (which relates to size), protein production (which relates to cellular activity), and the total amount that is released into the vasculature (which relates to the extent of tumor vascularization). Plots for the hypoxic tissue- and necrotic tissue-related proteins shedding have similar shapes (not shown).
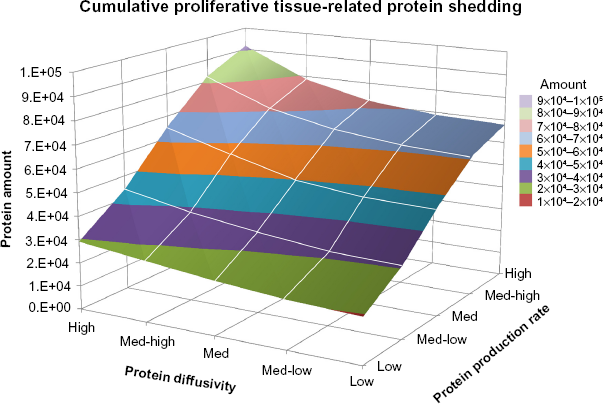
Cumulative proliferative tissue-related protein shedding from tumor lesion inception through Day 18. The graph highlights the three-dimensional interaction landscape between protein diffusivity (which relates to size), protein production (which relates to cellular activity), and the total amount that is released into the vasculature (which relates to extent of tumor vascularization).
Evaluation of Protein Counts from in Vivo Xenografts
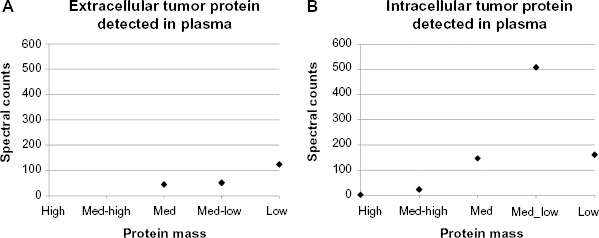
Spectral counts of human tumor derived extra- and intracellular proteins measured from plasma in circulation were obtained on Day 18 (Tables 2 and 3). As defined in the Methods section, proteins secreted to the exterior of tumor cells are labeled
Human tumor-derived extracellular (secreted) proteins measured from plasma in circulation obtained on Day 18.

Human tumor-derived intracellular proteins measured from plasma in circulation obtained on Day 18.

Spectral counts of human tumor-derived (
Discussion
Biomarker discovery approaches assume that genomic alterations that influence disease-associated protein expression are driven by pathophysiological cell or tissue changes. However, the way these changes can influence the protein excretion from cells, diffusivity in the interstitium, and persistence in blood circulation is not well understood. In particular for cancer, the effects of tumor size, architecture, cell composition, and cell states in this regard are unclear. To complement the experimental effort and streamline the corresponding avenues of inquiry, we propose an interdisciplinary modeling-experimental approach. As a first step in this direction, we simulate the shedding into vasculature of proteins related to cell viability in a growing tumor lesion. Unlike typical observation-based biomarker studies, we employ a mechanistic tumor model that explicitly considers the biophysical processes governing the shedding and the persistence kinetics of tumor-derived circulating proteins. The spatial two-dimensionality of the simulations enables incorporation of realistic tumor-induced vasculature with corresponding gradients of diffusible substances affecting the tumor tissue. The model couples the tumor growth with the vasculature development,22,37,48,63 including the proliferative, hypoxic, and necrotic activities of the tissue, thus providing insight into the interaction of these processes with the protein production, diffusion through the tumor interstitial space, and shedding into vasculature.
Ultimately, the goal of this interdisciplinary approach is to uncover fundamental biophysical processes of tumor progression, protein shedding, and protein persistence that characterize discovery of biomarkers, thus helping biomarker development for cancer treatment and diagnostics. We recognize that identifying biomarkers is a difficult problem that depends on many factors unrelated to shedding dynamics (eg, tissue of origin). Advancing the understanding of these dynamics, however, would help to relate the amount and fluctuations of biomarkers detected in circulation to the disease condition.
The results in this study highlight the link between protein shedding and the stage of tumor growth as well as the extent of vascularization. The proliferative tissue-, hypoxic tissue-, and necrotic tissue-related activities in time by the growing tumor are illustrated by the proteins releasing into vasculature (Figs. 3—5, respectively). These activities could potentially be correlated with different ratios of tumor tissue fractions (Fig. 2A) and vascularization (Fig. 2B) to derive tumor-specific estimation of viable, hypoxic, and necrotic tissues based on the protein detected in circulation. The ratio of high-to-low diffusivity proteins provides a further glimpse into the tumor growth stage and its vascularization. A high ratio may indicate that a particular tissue fraction is undergoing rapid increase and, further, that the vascularization may be severely impaired, since in this case, low-diffusing proteins would be expected to reach the vasculature in much smaller amounts than high-diffusing proteins. This situation seems to be the case for the necrotic tissue during Days 4–14 postinception in the simulation in this study (Fig. 6).
Although the correlation between spectral counts and protein mass for both extra- and intracellular proteins in the animal experiments on Day 18 (Fig. 8) were similar to the trends obtained from the computational model simulations (Figs. 3 and 5, respectively), the shedding of low-mass intracellular proteins did not seem to follow this trend. This could be due to a combination of factors, including an overall lower number of small intracellular proteins shed by the tumor, faster small protein degradation before the vasculature is reached, impaired diffusion, and inaccessibility to the vasculature perhaps caused by vascular deterioration. Since intracellular proteins are released upon cellular disintegration as occurs during necrosis, the surrounding microenvironment including the microvasculature would be affected by toxicity induced by the cellular debris. We further note that future experimental and computational studies should explore the relation between tumor size and viable/necrotic tumor fractions and how these parameters relate to protein production and shedding as a function of the dynamic microenvironment.
In Figures 3—5, the protein diffusivities were varied from high to low in five arbitrary increments (Table 1), while Figure 7 additionally shows variation in protein production rates varied from low to high. Future work could parcel the values for these variables in different ways than what has been illustrated here to more specifically reflect particular tumor biological data. Furthermore, for simplicity, this study initialized protein decay rates and transfer rates into vasculature to be the same for all proteins (Table 1), regardless of their diffusivities and production rates, which may not be realistic. Decay and transfer rates would depend on protein size as well as other tumor microenvironment-related variables, such as ECM density. The model could be expanded to include additional types of proteins that are secreted during tumor progression, and the parameters could be calibrated to cancer-specific values obtained from live subjects, with the ultimate goal to achieve clinically useful biomarker analysis.
Author Contributions
Conceived and designed the experiments and simulations: PM, HBF. Performed the experiments: KK, PM. Performed the simulations: LTC, MW. Analyzed the data: KK, PM, LTC, HBF. Wrote the first draft of the article: HBF. Contributed to the writing of the article: LTC, MW, PM, HBF. Agree with the article results and conclusions: PM, KK, MW, LTC, HBF. Jointly developed the structure and arguments for the article: HBF, PM. Made critical revisions and approved the final version: PM, HBF. All authors reviewed and approved the final article.