
Abstract
To address the complexity of the X-chromosome inactivation (XCI) process, we previously developed a unified approach for the association test for X-chromosomal single-nucleotide polymorphisms (SNPs) and the disease of interest, accounting for different biological possibilities of XCI: random, skewed, and escaping XCI. In the original study, we focused on the SNP-disease association test but did not provide knowledge regarding the underlying XCI models. One can use the highest likelihood ratio (LLR) to select XCI models (max-LLR approach). However, that approach does not formally compare the LLRs corresponding to different XCI models to assess whether the models are distinguishable. Therefore, we propose an LLR comparison procedure (comp-LLR approach), inspired by the Cox test, to formally compare the LLRs of different XCI models to select the most likely XCI model that describes the underlying XCI process. We conduct simulation studies to investigate the max-LLR and comp-LLR approaches. The simulation results show that compared with the max-LLR, the comp-LLR approach has higher probability of identifying the correct underlying XCI model for the scenarios when the underlying XCI process is random XCI, escaping XCI, or skewed XCI to the deleterious allele. We applied both approaches to a head and neck cancer genetic study to investigate the underlying XCI processes for the X-chromosomal genetic variants.
Keywords
Introduction
Analyzing X-chromosomal genetic variants is challenging because of the complexity of the X-chromosome inactivation (XCI) process for female X-chromosome loci, for which one of the 2 copies of the X chromosome is randomly inactivated to achieve the dosage compensation of X-linked genes in men and women.1–10 The XCI process is in general random, that is, on average, 50% of cells have one of the 2 alleles active. However, an additional model of XCI was found to be skewed XCI,6,8,9,11–16 which is defined as inactivation of one of the alleles in >75% or 90% of cells.6,8,9,15,17–26 Previous studies for different complex diseases (eg, mental retardation disorders, rheumatoid arthritis) have shown that the skewed XCI pattern can be more common in affected women compared with unaffected women.13,20,27–29 For example, Chabchoub et al 20 showed that the significantly skewed XCI pattern was observed in a larger proportion of female patients with rheumatoid arthritis (34%) and patients with autoimmune thyroid disease (26%) than among controls (11%). Therefore, it is important to account for XCI skewness when analyzing X-chromosomal genetic markers. 10 Another complexity of the XCI process is escaping XCI, in which both alleles are active (ie, no dosage compensation), such as the genes on the pseudo-autosomal regions on the X chromosome.8,30–33 To analyze X-chromosomal genetic variants, one of the most popular software programs for studying genetic associations, PLINK, uses the process of escaping XCI as the only model, for which the effect of the male deleterious allele is assumed to be the same as the effect of the female heterozygote genotype. In this case, the 3 genotypes of women are coded as 0, 1, or 2, and the 2 allele types of men are coded as 0 or 1. Such a coding strategy accounts for the escaping XCI but ignores other biological models such as random and skewed XCI. 34 In another approach, Clayton35,36 proposed χ2 tests to analyze data by accounting for only the random XCI model but ignoring the other XCI models. Neither approach accounts for XCI skewness. To account for these different biological models of XCI, we had developed a novel association test to analyze X-chromosomal single-nucleotide polymorphisms (SNPs) that maximizes the likelihood ratio (LLR) over all such biological possibilities of XCI. 10 In that paper, we showed that the LLR association test had higher power than the existing approaches, including the χ2 test proposed by Clayton and the PLINK regression approach, in the scenarios where XCI was skewed, whereas the LLR association test lost a little power in scenarios where XCI was random or escaping XCI occurred.
Even though the originally proposed test allows us to evaluate the association between X-chromosomal SNPs and a disease of interest, it does not provide knowledge regarding the underlying XCI models, which is useful information for understanding the contribution of SNPs to the disease, as well as the inheritance patterns of diseases. 37 In particular, the inheritance pattern describes how a disease is transmitted 38 and helps to predict the recurrence risk of a disease for subsequent generations.39,40 Also, knowing the mode of disease inheritance helps us calculate the risk ratio that is attributed to the SNP 41 for a relative of an affected individual. Such information enables clinicians to provide genetic counseling to family members regarding the likelihood of developing the disease or passing it on to their children. 42 To identify the XCI model given a SNP, one approach is to select the XCI model that has the highest LLR (denoted as the max-LLR approach). However, such an approach does not formally compare the LLRs that correspond to different XCI models to assess whether these models are statistically equivalent. This is especially relevant when an alternate form of XCI may have an LLR that is very close to that of the form of XCI with the highest LLR and so may be statistically equivalent. Moreover, when the study sample size is small, the highest LLR might not correspond to the true underlying XCI model, and therefore, the max-LLR approach would identify the wrong XCI model in the analysis.
Therefore, in the spirit of the Cox test, which is used for comparing 2 nonnested models,43–45 herein we propose an LLR comparison procedure (denoted comp-LLR) to formally compare the LLRs of different XCI models using statistical tests to select the most likely XCI model that describes the underlying XCI process. We conduct simulation studies to investigate the performance of the comp-LLR approach and compare it with that of the max-LLR approach. The results show that given an X-chromosomal variant significantly associated with the disease of interest, the comp-LLR approach has higher probability of selecting the correct XCI model for scenarios in which the underlying XCI process is random XCI, escaping XCI, or skewed XCI to the deleterious allele. In our simulations, when the maximum LLR corresponded with the true underlying XCI model, the comp-LLR approach performed similar to the max-LLR approach. However, when the maximum LLR did not correspond to the true simulation XCI model, the comp-LLR more often identified the true model as one of the plausible XCI process models, which implies that this approach has higher probability of selecting the correct XCI model. We applied both approaches, max-LLR and comp-LLR, to data from a genetic association study of head and neck cancers to investigate the underlying XCI processes for the X-chromosomal genetic variants.
Methods
LLR and the association test
In this study, we considered a di-allelic SNP on the X chromosome and denoted the 2 alleles as A and a, where A is the deleterious allele. As described in the original study,
10
we used different coding values for different XCI processes. Specifically, for random and skewed XCI, we, respectively, denoted alleles a and A for men using a random variable X = {0, 2} and, respectively, denoted genotypes aa, Aa, and AA for women as X = {0, γ, 2}, where
Denoting the disease of interest as a binary random variable Y = {0, 1}, where 0 represents individuals without the disease and 1 represents individuals with the disease, the association between an X-chromosomal SNP X and the disease of interest Y can be written as follows:

where β0, β1, and βs are regression coefficients and Xsex is the variable for the sex. As described above, the value of
Given a sample data set with N individuals, the likelihood is written as

For the SNP-disease association, for each X coded according to a specific XCI model, we first estimate the regression coefficients β0, β1, and βs, as well as the corresponding LLR. By enumerating all different models,
Procedure for comparisons of LLRs (comp-LLR)
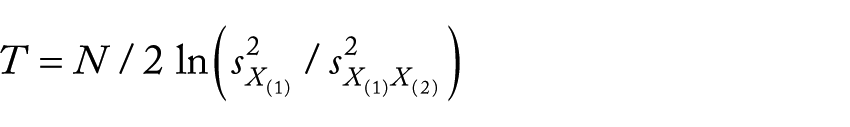
To compare 2 LLRs, we use a test statistic that is inspired by the Cox test43–45 for comparing 2 nonnested models. Two models are considered as nonnested if one model cannot be derived from the other model by parametric restriction or a limiting process, such as imposing constraints on the parameters of one of the models.46,47 This is the case in our study where the LLRs for different XCI processes use different coding values for the X-chromosomal SNPs. When comparing 2 nonnested models, M1 and M2, the basic idea of the Cox test is that if M1 represents the correct model, then a fit of the regressors from M2 to the fitted values from M1 should not have further explanatory value; if it has, it can be concluded that M1 does not represent the correct model.43–45,48 We use the R function “coxtest” in the “lmtest” package to conduct the test.49,50 To compare the 4 LLRs based on 4 different XCI processes, including skewed XCI to the normal allele, random XCI, skewed XCI to the deleterious allele, and escaping XCI, we started with the XCI model with the highest LLR as the most likely model that describes the data and compared it with the other XCI models. The formal comparison procedure is described below:
Rank the LLRs as
Compare the XCI model corresponding to the second highest LLR (ie,
where

where
If the null hypothesis is rejected, that means model
Compare the XCI model corresponding to the third highest LLR (ie,
Finally, we compare the XCI models
Simulation approach
We conducted simulation studies to investigate the performance of the comp-LLR and max-LLR approaches for selecting the XCI models that best describe the XCI process. We investigated 2 di-allele X-chromosomal SNPs that were in high linkage disequilibrium (LD) with the causal variant for the disease of interest, which we denoted as SNP1 and SNP2. To generate the genotypes for SNPs in LD, we employed the R package “HapSim,” which is a simulation tool for generating haplotype data based on minor allele frequency (MAF) and LD coefficients.51,52 Specifically, HapSim generates haplotypes for each of the 2 strands of the chromosome based on the LD pattern and then combines the base pairs at each locus to generate the genotypes.51,52 For the purpose of simulation, the MAF for the causal SNP was assumed to be 40%, whereas the MAF for both SNP1 and SNP2 was assumed to be either 30% or 40% for different scenarios. We considered different LD values among the SNPs, with the LD coefficient r2 set to be either 0.85 or 0.95 for different scenarios. The sex of each individual was generated on the basis of the prevalence of men in the general population (ie, 50%). Because men are hemizygous, the genotypes of the causal SNP generated from HapSim were recoded conditional on sex according to the different XCI processes as discussed above.
Finally, given the data of the causal SNP, the disease of interest, denoted as a random variable Y, was simulated using the logistic regression model: Logit(P(Y = 1|X, Xsex)) = β0 + β1X + βsXsex. In the logistic model, X represents coding associated with the XCI process for the causal SNP and Xsex represents the covariate for sex, where we assumed that sex was also associated with the disease. We fixed the regression coefficients at
Proportions of simulated replicates for which the true underlying XCI model was identified by the max-LLR and comp-LLR approaches for SNP1 and SNP2.

Abbreviations: LD: linkage disequilibrium (r2); LLR, likelihood ratio; MAF, minor allele frequency for the associated SNPs; SNP, single-nucleotide polymorphism; XCI, X-chromosome inactivation.
The proportions were calculated based on 500 replicates, each with 2000 cases and 2000 controls.
If the maximum LLR corresponds to the true XCI model, we consider that the true model is identified using the max-LLR approach.
If the true underlying XCI model is included in the resulting one or multiple equivalent possible XCI models, we consider that the true model is identified by the comp-LLR approach.
Application to head and neck cancer data
We applied the max-LLR and comp-LLR approaches for identifying the underlying XCI process to the X-chromosomal data from a head and neck cancer genome-wide association (GWA) study. The details of the data, including demographical, genotyping, and quality control information, were described in our original study. 10 In particular, this GWA study involved 2 independent phases. In the phase 1 study, 14 169 SNPs were genotyped on the X chromosome for 2718 individuals, where 1161 were patients with head and neck cancer and 1557 were controls. In the phase 2 study, 14 371 SNPs were genotyped on the X chromosome for 3996 individuals, where 1031 were patients and 2965 were controls. For both phases, the patients with head and neck cancer were accrued at The University of Texas MD Anderson Cancer Center (MD Anderson). For the controls in the phase 1 study, 531 individuals were recruited by MD Anderson for the study of head and neck cancers, and 1026 individuals had been previously recruited at MD Anderson for the study of cutaneous melanoma. 55 For the controls in the phase 2 study, 643 individuals were recruited by MD Anderson and data for 2322 individuals were obtained from the Study of Addiction: Genetics and Environment, provided by the National Center for Biotechnology Information, which were downloaded from dbGaP. 56 The study was approved by the institutional review board at MD Anderson, and written informed consent was obtained from all participants.
Results
Simulation results
As described in the “Methods” section, using the proposed comp-LLR approach, we may not be able to identify one single model to represent the underlying XCI model as the max-LLR approach does. Instead, the comp-LLR approach may result in multiple possible XCI models. If the true underlying XCI model is included in the resulting multiple equivalent possible XCI models, we consider that the true model is identified by the comp-LLR approach. For the max-LLR, we consider that the true model is identified if the highest LLR corresponds to the true XCI model. Table 1 lists the proportions of the 500 replicates for which the true underlying XCI model was identified for the associated SNP1 and SNP2 under 16 scenarios, using the 2 approaches.
From the results, we observe that compared with the max-LLR approach, the comp-LLR approach has higher or comparable probability of identifying the true underlying XCI model for both SNPs through all the scenarios.
When the true underlying XCI model is skewed toward the deleterious allele (scenarios 2, 6, 10, and 14), the comp-LLR approach has higher probability of identifying the true model. For example, in scenario 2 (MAF = 0.3 and r2 = 0.95), the proportions of replicates for which the true XCI model was identified are, respectively, 0.830 and 0.832 for the 2 SNPs when using the max-LLR approach, whereas when using the comp-LLR approach, the proportions are, respectively, 0.910 and 0.918 for the 2 SNPs.
Similarly, when the true underlying XCI model is random (scenarios 3, 7, 11, and 15), we observe a pattern similar to that for the scenarios with XCI skewed toward the deleterious allele. For example, in scenario 11 (MAF = 0.3 and r2 = 0.85), the proportions are, respectively, 0.926 and 0.940 for the 2 SNPs when using the max-LLR approach, whereas when using the comp-LLR approach, the proportions are, respectively, 0.982 and 0.982 for the 2 SNPs.
When the true underlying XCI model is escaping XCI (scenarios 4, 8, 12, and 16), the proposed comp-LLR approach provides substantial gains in identifying the true XCI model compared with that of the max-LLR approach. For example, in scenario 16 (MAF = 0.4 and r2 = 0.85), the proportions are, respectively, 0.500 and 0.496 for the 2 SNPs when using the max-LLR approach, whereas when using the comp-LLR approach, the proportions are, respectively, 0.926 and 0.934 for the 2 SNPs.
When the true underlying XCI model for the simulations is skewed toward the normal allele (scenarios 1, 5, 9, and 13), the 2 approaches perform similarly, with almost identical proportions for all the scenarios.
Effect of sample size
Through simulations, we also investigated the effects of sample sizes on selecting the true underlying XCI model. In particular, we considered scenario 8, in which the true underlying model was escaping XCI. We simulated a data set with 2000 cases and 2000 controls. The highest LLR corresponded with the random XCI model, so the max-LLR approach led to incorrect model selection for the XCI process. In contrast, the comp-LLR approach concluded that the random XCI and the true escaping XCI models were equivalent and indistinguishable. To further assess the sample size issue, we increased the sample size to 10 000 cases and 10 000 controls. The highest LLR corresponded with the escaping XCI model, so the max-LLR approach led to correct model selection for the XCI process. Similarly, the comp-LLR approach concluded that the true escaping XCI model was the most likely XCI model.
XCI models for X-chromosomal genetic variants using head and neck cancer data
The purpose of the analysis of real data is to identify the potential underlying XCI models for the X-chromosomal SNPs reported in our original study, using both approaches, max-LLR and comp-LLR, based on the phase 1 data, phase 2 data, and the combined data merged from both phases of the head and neck cancer GWA study. In our original study, 10 we analyzed the top 33 X-chromosomal SNPs using phase 1 and phase 2 data separately and then performed the meta-analysis based on the results from both phases using the fixed and random effects models, as well as the Fisher method, in which the natural logarithm of P values from 2 phases were summed and then multiplied by −2 to create a test statistic, which has a χ2 distribution when the null hypotheses are true and the P values are independent.57,58 We focused on the 4 top SNPs ranked by the P values obtained using the Fisher method. The results for the XCI models identified for the 4 top SNPs are reported in Table S1 of the Supplementary Material. In particular, we were interested in the SNP rs12388803 (meta-analysis P = 2.04 × 10⁻⁶ using Fisher method), which is the only SNP that reached the chromosome-wide significance threshold in our original study. When using the max-LLR approach, the SNP rs12388803 was found to have an XCI model that skewed toward the deleterious allele based on phase 1, phase 2, and the combined data. When using the comp-LLR approach, rs12388803 was found to have an XCI model that skewed toward the deleterious allele based on phase 1 data and the combined data but to have equivalent models of random XCI and XCI skewed toward the deleterious allele based on phase 2 data. Of note, the other 3 SNPs were statistically not significant at the chromosome-wide significance level and had LLRs for different XCI models that were very close; consequently, the comp-LLR approach was not able to distinguish different XCI models and resulted in multiple equivalent models.
Discussion
In this article, we extended the approach we developed in the original study, 10 which was a novel approach to analyze X-chromosomal SNPs, and proposed a comp-LLR approach to select the most likely XCI model that describes the underlying XCI biological process. We performed simulation studies to investigate the performance of the proposed comp-LLR. Our results show that if the SNP is significantly associated with the disease of interest, the comp-LLR approach has higher probability of identifying the true XCI model for scenarios where the random XCI, skewed XCI to the deleterious allele, and escaping XCI were used as the underlying models for the simulations. When the underlying XCI model is skewed toward the normal allele, both approaches lead to similar conclusions. Note that when the SNP is not associated with the disease of interest, there is no associated mode of inheritance or XCI model; therefore, there is no need to conduct model comparisons for such a SNP. In practice, for each SNP, we first check the SNP-disease association using the association test proposed in our original study, and the comparison procedures proposed in this article are only needed when the SNP-disease association is statistically significant. Note that the proposed comp-LLR focuses on identifying the XCI models; thus, it will not lead to an inflated type 1 error rate for the SNP-disease association test as the significance of the X-chromosomal SNP has already been checked. Although logistic regression was used to formulate the problem and demonstrate the proposed approach, the comp-LLR approach is applicable to other types of data (eg, continuous) or different sampling schemes (eg, case-control study based on frequency matching for covariates such as sex). Note that the unconditional logistic regression, used in this article, is commonly used for frequency-matched case-control studies. In some situations, the likelihood function may need to be modified accordingly (eg, linear regression for continuous phenotype, conditional logistic regression for a pairwise matched sampling design). In genetic association studies, one may observe different MAFs and effect sizes for men and women, as well as different proportions of male:female among the cases and controls.3,4 To account for such differences between men and women, we recommend always including sex as a covariate in the study of X-chromosomal genetic variants using the proposed approach. Our method does not assume Hardy-Weinberg proportions in women.
The approach proposed here has some assumptions. For example, we assumed that the XCI model corresponding to the highest LLR,
The sample size has a significant impact on the performance of the 2 approaches. When the sample size is large, both approaches can identify the correct underlying model. However, when the sample size is relatively small, as is commonly observed in many real data sets, the max-LLR approach is more likely to identify the wrong model, whereas the comp-LLR approach still provides a solution with multiple equivalent possible XCI models, including the true underlying model.
Alternative approaches are available to compare 2 nonnested models (eg, M(1) and M(2)), such as the encompassing approach and the J test proposed by Davidson and MacKinnon.45,48 The encompassing approach creates a “supermodel,” which contains all regressors from both models, M(1) and M(2), for comparison. In this case, both models are nested within the “supermodel,” and each model is compared with the “supermodel.” However, this approach does not specifically distinguish between M(1) and M(2), rather it distinguishes between the “supermodel” and M(1) or M(2) 48 ; therefore, we did not consider this approach in our study. However, the basic idea of the J test is that if M(2) contains the correct regressors, then inclusion of the fitted values of M(1) into M(2) as a regressor will not significantly improve the fitted values as compared with fitted values based on M(2).45,48 The J test is also available in the R “lmtest” package.49,50 We applied the J test to the simulated data and obtained results similar to those obtained from the Cox test. For example, for scenario 4 (MAF = 0.3 and r2 = 0.95), using the J test for comparing LLRs, the proportions of replicates for which the true underlying XCI model was identified were 0.966 and 0.954, respectively, for the associated SNP1 and SNP2. Comparatively, these proportions using the Cox test were 0.960 and 0.948, respectively.
This study has 2-fold improvement over the original study. First, the proposed comp-LLR approach, which compares different XCI models, will help us better understand the underlying XCI models and provide useful information about the contribution of SNPs to diseases and the inheritance model of disease. Second, in this study, we observed that the SNPs in high LD (r2 > 0.8) tend to have the same XCI models. This finding potentially improves the power of the original association test by reducing the number of multiple comparisons. For each X-chromosomal SNP, the original association test needs to conduct 4 tests, each corresponding to one of the 4 XCI biological processes. In this case, the power of the test might be impaired due to the multiple comparison issue. For example, given that SNP1 and SNP2 are in high LD (r2 > 0.8), if the comp-LLR shows that both the random XCI model and the skewed XCI to the normal allele model can describe SNP1, then for SNP2, we do not need to check all 4 XCI models, but instead can investigate only 2 models when testing the association. Thus, when testing tens of thousands of X-chromosomal variants, such a strategy potentially reduces the number of multiple comparisons.
In summary, we have proposed a comp-LLR approach to select the most likely XCI model that describes the underlying XCI biological process, which has higher probability of identifying the true XCI model compared with the naïve approach that uses the highest LLR.
Footnotes
Appendix 1
When comparing 2 XCI models, we follow the Cox test presented by Greene.
48
The details of the test are described in the 5 steps shown below
48
using the comparison of
Author Contributions
Conceived and designed the experiments: JW, SS. Conducted simulation and analyzed the data: JW, RT, SS. Wrote the first draft of the manuscript: JW, SS. Contributed to the writing of the manuscript: JW, SS. Agree with manuscript results and conclusions: JW, RT, SS. Jointly developed the structure and arguments for the paper: JW, SS. Made critical revisions and approved final version: JW, SS. All authors reviewed and approved of the final manuscript.
Funding:
The author(s) disclosed receipt of the following financial support for the research, authorship, and/or publication of this article: Genetics and Environment (SAGE) was provided through the NIH Genes, Environment and Health Initiative [GEI] (U01 HG004422). SAGE is one of the genome-wide association studies funded as part of the Gene Environment Association Studies (GENEVA) under GEI. Assistance with phenotype harmonization and genotype cleaning, as well as with general study coordination, was provided by the GENEVA Coordinating Center (U01 HG004446). Assistance with data cleaning was provided by the National Center for Biotechnology Information. Support for collection of data sets and samples was provided by the Collaborative Study on the Genetics of Alcoholism (COGA; U10 AA008401), the Collaborative Genetic Study of Nicotine Dependence (COGEND; P01 CA089392), and the Family Study of Cocaine Dependence (FSCD; R01 DA013423). Funding support for genotyping, which was performed at the Johns Hopkins University Center for Inherited Disease Research, was provided by the NIH GEI (U01HG004438), the National Institute on Alcohol Abuse and Alcoholism, the National Institute on Drug Abuse, and the NIH contract “High throughput genotyping for studying the genetic contributions to human disease” (HHSN268200782096C). The data sets used for the analyses described in this manuscript were obtained from dbGaP at ![]() through dbGaP accession number phs000092.v1.p. J.W. was supported in part by the National Institutes of Health (NIH) through grants R03CA192197 and the Cancer Center Support Grant P30CA016672. S.S. was supported in part by NIH grants R25 DA026120, R01 DE022891, and the Cancer Center Support Grant P30CA016672; CPRIT grants RP170259 and RP130123; and the Barnhart Family Distinguished Professorship in Targeted Therapy.
through dbGaP accession number phs000092.v1.p. J.W. was supported in part by the National Institutes of Health (NIH) through grants R03CA192197 and the Cancer Center Support Grant P30CA016672. S.S. was supported in part by NIH grants R25 DA026120, R01 DE022891, and the Cancer Center Support Grant P30CA016672; CPRIT grants RP170259 and RP130123; and the Barnhart Family Distinguished Professorship in Targeted Therapy.
Declaration of Conflicting Interests:
The author(s) declared no potential conflicts of interest with respect to the research, authorship, and/or publication of this article.
References
Supplementary Material
Please find the following supplemental material available below.
For Open Access articles published under a Creative Commons License, all supplemental material carries the same license as the article it is associated with.
For non-Open Access articles published, all supplemental material carries a non-exclusive license, and permission requests for re-use of supplemental material or any part of supplemental material shall be sent directly to the copyright owner as specified in the copyright notice associated with the article.