
Abstract
Aiming to find key genes and events, we analyze a large data set on diffuse large B-cell lymphoma (DLBCL) gene-expression (248 patients, 12196 spots). Applying the loess normalization method on these raw data yields improved survival predictions, in particular for the clinical important group of patients with medium survival time. Furthermore, we identify a simplified prognosis predictor, which stratifies different risk groups similarly well as complex signatures.
We identify specific, activated B cell-like (ABC) and germinal center B cell-like (GCB) distinguishing genes. These include early (e.g. CDKN3) and late (e.g. CDKN2C) cell cycle genes.
Independently from previous classification by marker genes we confirm a clear binary class distinction between the ABC and GCB subgroups. An earlier suggested third entity is not supported. A key regulatory network, distinguishing marked over-expression in
Introduction
Diffuse large B-cell lymphomas (DLBCL) are the most frequent B cell Non-Hodgkin's lymphomas. Diagnosis relies at present on morphological, immune-phenotypic and laboratory parameters. Clinically, the International Prognostic Index (IPI; age, tumor stage, serum lactate dehydrogenase concentration, performance status, and the number of extranodal disease sites) (The International NHL Prognostic Factors Project, 1993) is often used to predict outcome in DLBCL. On the molecular level, gene expression signatures have been defined that predict outcome in DLBCL independent of the IPI (Rosenwald et al. 2002).
Alizadeh et al. (2000) investigated the gene expression patterns of “diffuse large DLBCL, follicular lymphoma and chronic lymphatic leukemia. They identified two novel distinct types of the DLBCL by gene expression profiling. The “activated B cell-like DLBCL”(ABC) group has a lower overall survival rate than the “germinal centre B cell-like DLBCL” (GCB) group. Von Heydebreck et al. (2001) applied their class discovery method ISIS on a subset of 62 samples and 4026 clones of the data by Alizadeh et al. (2000) and confirmed for these data the two entities ABC and GCB. The survival analysis of Rosenwald et al. (2002), assigned several genes to gene expression signatures and based on this an outcome predictor of survival. The constituents are the “Germinal-center B-cell signature”, “MHC class II signature”, “Lymph-node signature”, “Proliferation signature” and the gene “BMP6”. The predictor has a greater prognostic power in classifying patients into risk groups than the IPI (The International Non-Hodgkin's Lymphoma Prognostic Factors Project 1993). Starting with 36 well known DLBCL prognosis genes from the literature, Lossos et al. (2004) found a six gene based outcome predictor and applied it to the data sets of Alizadeh et al. (2000) and Rosenwald et al. (2002). The latter one is an ongoing study and thus an extension and revision of the old data from Rosenwald et al. (2002) was possible for us (see Material and Methods).
In this study we investigate first the robustness of the data (Rosenwald et al. 2002) with respect to advanced and more appropriate normalization methods. For that, “loess” and “scale” are performed on the data set, as we are aware, for the first time and the results are discussed. Next, unbiased statistical classification analysis confirms for this enlarged data set the classical subgroups ABC DLBCL and GCB DLBCL independent from hierarchical clustering. Furthermore it supports those subgroups being homogeneous entities in the data.
Our analysis includes the expression values for the above 36 DLBCL prognosis genes and we apply more adequate tools from the Bioconductor library (Gentleman et al. 2004) to derive better predictors than e.g. the six-spot predictor found by (Lossos et al. 2004). Moreover, we identify and demonstrate that expression of early and late cell cycle genes distinguishes well the pathological entities ABC and GCB DLBCL.
Finally, we show that the most significant gene expression differences found including cell cycle genes, classical marker genes and all best separating genes are integrated into a compact key regulatory network with clear expression differences between both diffuse large B-cell-lymphoma subgroups. This finding is confirmed comparing the average distribution of genes on the Lymphochip and the connection distances between them in the human interactome as well as by confirming key gene expression differences found in our main data set from new analysis of further gene expression data by Shipp et al. 2002. A picture emerges where a central regulatory circuit tunes immune signatures, apoptotic and proliferation pathways in different ways between ABC and GCB DLBCL. The introduced methods can also be applied to other studies of gene expression analysis in cancer to establish improved prognosis predictors, identify regulatory circuits and for proper group classification.
Materials and Methods
Gene expression data and materials
Patient samples were obtained after informed consent and were treated anonymously during microarray analysis. DLBCL lymph-node biopsies were either snap frozen, frozen in OCT or disaggregated and frozen as a viable cell suspension. DLBCL gene expression was measured with cDNA arrays containing genes preferentially expressed in lymphoid cells or genes known or presumed to be part of cancer development or immune function (“Lymphochip” microarrays (Alizadeh et al. 1999)). Our array includes spots to measure individual exons of the same gene which may be expressed differently in both lymphoma subgroups.
Microarray Procedures
Fluorescent images of hybridized microarrays were obtained using a GenePix 4000 microarray scanner (Axon Instruments). Images were analysed with ScanAlyze (M. Eisen; http://www.microarrays.org/software), and fluorescence ratios (along with numerous quality control parameters; see ScanAlyze manual) were stored in a custom database. Single spots or areas of the array with obvious blemishes were flagged and excluded from subsequent analyses. Messenger RNA was extracted according to standard procedures (Sambrook and Russel, 2001) from tumor biopsy specimens of DLBCL patients. All cDNA microarray analyses were performed using poly-(A)+ mRNA (Fast Track, Invitrogen). For each hybridization, fluorescent cDNA probes were prepared from an experimental mRNA sample (Cy5–labelled) and a reference mRNA sample (Cy3-labelled) consisting of a pool of nine lymphoma cell lines (Raji, Jurkat, L428, OCI-Ly3, OCI-Ly8, OCI-Ly1, SUDHL5, SUDHL6 and WSU1). The use of a common reference cDNA probe allows the relative expression of each gene to be compared across all samples.
The original data generated by Rosenwald et al. (2002), in which the subgroups were defined by hierarchical clustering was provided to us by the authors. In our study we analyse an enlarged data set as follows: more patients (a total of 248 patients, each patient array included 12196 gene spots corresponding to 3717 genes), including a more recent classification. The outcome of this are 12.3% more ABC and 5.2% less GCB patients. 19 patients have been removed from the ABC and GCB groups. In detail, five ABC patients were removed from the earlier ABC classification, however, 14 other ones are now associated with it. From the earlier GCB group, 14 patients were assigned to other entities and 11 other patients were newly classified as GCB. Altogether, 25 patients were thus newly recruited into these two groups. Moreover, each spot is now analyzed in the new study individually. There was no pooling of data on datapoints (spots) as done in older analyses (Rosenwald et al. 2002). We further fully account for the changes in patients analysed (described above) by such an individual spot analysis. In summary this yielded about 3.3 times more data points per patient.
Smaller gene sets typically show larger error rates. However, if almost equally good performing classifiers existed, we parsimoniously chose the one containing the smallest number of genes. The proposed best gene set used for our analysis had 31 spots (labelled by an ‘x’ character in Fig. 2).
Results
Improving prognosis prediction and separation of DLBCL subtypes
Statistical validation of the DLBCL subgroups ABC DLBCL and GCB DLBCL
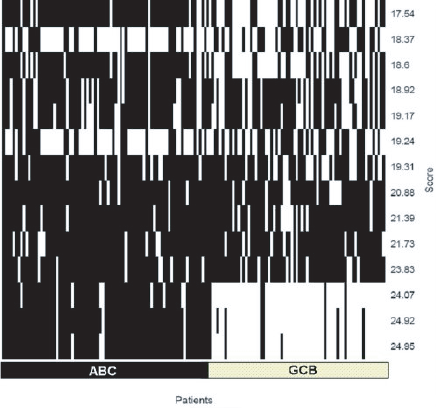
Both subgroups were originally introduced on the basis of gene expression profiling. There has been some suggestion that certain diffuse large B-cell lymphomas form a third group (Hans et al. 2004). Furthermore, it was interesting to see whether this classification is also valid for this data set by an unsupervised classification method. To decide independently of any pre-clustering of specific marker genes whether there are two, three or even more lymphoma subgroups and whether they overlap with groups according to other group definitions (e.g. pathology). ISIS (see Materials and Methods) systematically investigates unsupervised all possible bipartitions of the gene expression data (excluding mediastinal lymphomas; see Materials and Methods) without prior knowledge of marker genes or signature pre-classification (Fig. 1). Nevertheless the bipartitions with the three highest separation scores support and identify the two pathological entities ABC and GCB. Distinct subgroups (splits) within the ABC or GCB entities are not validated by ISIS. In particular, no appropriate bipartition could be observed using previously putatively classified Type 3 patients and the ABC or GCB samples (data not shown). The precise separation into exactly these two subgroups is thus well supported even by an unbiased statistical method independent of predefined expression signatures.

Optimal molecular survival predictor applying six genes.

The gene symbol (left side) is followed by the gene description. Three of these genes are HLA major histocompatibility complex genes (HLA).
Survival prognosis detection on the updated data and after advanced normalization
The signatures by Rosenwald et al. (2002) are independent from the clinical IPI score (see Introduction) and useful predictors within the low, medium and high IPI risk groups on their data set (Rosenwald et al. 2002). We now tested the performance of advanced normalization methods, namely the methods “loess” (Yang et al. 2001; Yang et al. 2002) and “scale” (Smyth and Speed, 2003; Yang et al. 2001; Yang et al. 2002) on our data set. The IPI score is considered here only as an independent and established clinical prognosis marker. On a normalized data set of 240 patients and considering all individual spots we utilised Kaplan Meier plots (Fig. S1) and reveal the good performance of the gene expression profiles (Rosenwald et al. 2002) also for this data set using the improved normalization procedure. The low risk IPI group in the renormalized data is not as well separated between the best and worst quartile as in Rosenwald et al. (2002). The separation of the high risk group is virtually unchanged. However, in the medium risk group a better separation was achieved by the renormalization and single spot analysis of the enlarged patient data. For the medium risk patients a better separation into high and low risk is particularly important for prognosis prediction. This method including the advanced normalization can also be applied to any other microarray data set.
An improved six-spot predictor for survival prognosis comparing multi- and univariate analysis
The immune signature requires the measurement of gene expression for many genes. We investigated whether a combination of array spots achieves similar good classification. Multivariate analysis (4 spots results in Table S1 and Table S2, they include immune genes) was computationally prohibitive for more than 4 spots. However, by univariate analysis we could systematically test the capability of gene expression values from individual spots to separate patients with good or bad prognosis in Kaplan-Meier plots. We considered for all three IPI classes the separation of best patient quartile with good prognosis from the worst patient quartile with poor prognosis. Using all genes and the 160 patients from the training-set we identified the spots predicting outcome best. Together, in a multivariate model, they form a predictor separating best and worst quartiles for all three IPI categories including the 80 patients from the validation-set. The five-spot-predictor considers different splicing forms in HLA-DRB5. Five spots (HLA-DPa, Brca, HLA-DQa, and two clones of HLA-DRB5; details in Suppl. Material) are about equal to the six gene predictor of Lossos et al. (2004). However, six genes and spots (HLA-DPa, HLA-DQa, HLA-DRb5, SEPT1, EIF2S2 and IDH3A genes, Fig. 2) show even an improvement for this classification task. The separation of the best and worst quartiles in the three IPI classes is comparable (Fig. 3) to the prediction success of the complete signature of Rosenwald et al. (2002) and classifies different patient quartiles better than the set proposed by Lossos et al. (2004; using LMO2, BCL6, FN1, CCND2, SCYA3 and BCL2 for overall survival in DLBCL). Our predictor is delivered by bioinformatical analysis of gene expression measurements, whereas Lossos et al. used real time PCR. However, our method can also be applied to real time PCR data.

Moreover, we tested the influence of the high correlation between the genes HLA-DPa, HLA-DQa and HLA-DRB5 on the quality of the predictor. The survival prediction with predictors of non correlated genes from the univariate analysis yields no improvement in the results (data not shown).
Genes best distinguishing DLBCL subgroups
Nearest shrunken centroid analysis using the R-package PAM (“Prediction Analysis of Microarrays”) identifies best separating genes for the two subgroups (ABC and GCB DLBCL) with smallest cross-validation error (Fig. S2). Gene numbers of classifiers are plotted versus the resulting error rates. The optimal classifier (Table S3) requires only 18 genes (31 spots) with an overall cross validation error of 6.2% (5 out of 82 ABC DLBCL samples were falsely predicted as GCB (6.1%); 7 out of 112 GCB DLBCL as ABC (6.25%)). Larger gene sets show similar error rates (see Materials and Methods), smaller gene sets result in inferior classification (Fig. S2). GCB DLBCL is correctly predicted even with fewer genes, however, the error for ABC DLBCL samples increases strongly (Fig. S2 lower plot). For clinical application both entities have to be well separated.
Functional relationship of the genes differently expressed in ABC and GCB
Classical lymphoma gene-markers compared to the identified best separating genes
We tested whether 35 classical lymphoma genes (listed in Table S4; as described in Monti et al. 2005; Lee et al. 2003; Willis et al. 1999; Polo et al. 2004; Rosenwald et al. 2002) separate well the two major subtypes of DLBCL. Three metabolic enzyme genes for LDH (IPI score prognosis marker), IDH and PDH were added. Altogether these 38 genes correspond to 180 spots. PAM analysis identified a set of 9 well classfying genes (21 spots) (Table S5 and S6), with an overall error rate of 14% (10% training set; 15% for the validation group). However, the classical genes require more spots and their separation is not as good as the optimal prediction set above (Fig. S2). After this we merged these classical lymphoma marker genes with the best separating gene set found above for classification. We found, however, that here the best separating genes achieve all top ranks in this task (Table S7). Only mitogen-activated protein kinase 10 (MAPK10), the best classical lymphoma marker, reaches top ranks. BCL6 as the next best classical marker reaches only rank 31. Below we show that classical lymphoma genes are close to but not identical to the central regulatory network and genes best separating GCB and ABC DLBCL.
Cell cycle genes are differently expressed in ABC and GCB
Cell cycle is critical for cancer cell proliferation and we next investigated by PAM analysis (see Material and Methods) whether the functional group of cell cycle genes alone could separate the two B-cell lymphoma groups. We identified 473 spots, which correspond and are homologous to the cell cycle genes found by de Lichtenberg et al. (de Lichtenberg et al. 2005). These genes are annotated according to expression in the cell cycle state (100 steps between 0 and 99 for a full cell cycle).
The separation between the lymphoma subgroups improves as more genes are used. 77 cell cycle genes (Table S8, Table S9; error rate of 15.4%) yield low error rates using a medium sized gene set (classification optimum, see materials and methods). These include genes such as Butyrophilin-like protein 9 (BTNL9), early B-cell factor (EBF), TSC22 domain family member 1, Cyclin-G2 (CCNG2), Interleukin-6 (IL6), immediate early response protein 5 (IER5) and further homologues of typical cell cycle stage-specific genes (de Lichtenberg et al. 2005) such as TIMP metallopeptidase inhibitor 1(TIMP1) and v-maf musculoaponeurotic fibrosarcoma oncogene homolog (MAF), which mainly reflect the late cell cycle states. Figure 3 compares the complete cell cycle genes in our data set with the subset of 77 genes in a density plot. The black line indicates all cell cycle states of the whole chip and the blue line the subset of 77 genes. The densities of these gene sets clearly differ in the early (steps 0–18) and in the late steps (75–85) of cell cycle (p = 6.65·10–10; Wilcoxon one sided test).
Cell cycle spots, which show the biggest difference in gene expression values between ABC and GCB DLBCL, are in the late steps 72, 80, 84 and 85 (Fig. S3; M/A plot, ie, middle intensity of the genes against difference in expression of both lymphoma subgroups). Moreover, these cell cycle states form a compact cluster in the plot. This data indicate a clear difference in cell cycle states regarding the two DLBCL subgroups.
Cell cycle genes, classical lymphoma genes and best separating genes form a compact network important for DLBCL subtype distinction between ABC and GCB
Are the genes differentially expressed in ABC and GCB DLBCL specially connected, and in particular, if so, how do their respective gene products interact with each other? To analyze this systematically, different large scale protein interaction databases were investigated such as the hand curated HPRD database (Peri et al. 2003). The large protein-protein interaction database STRING (von Mering et al. 2005) allowed us to establish an interaction network (Fig. S4, Fig. S5). Note that this analysis focuses on the clearly differentially expressed genes in ABC and GCB (Table S7). Classical lymphoma gene markers (dark grey boxes) as listed in Table S5 combine and interact with the compact cluster of the most powerful differentiating genes (white boxes) for the whole data set (Table S3) as delivered by PAM. The connections are mainly found by text-mining; however, the two interactions between BCL6—IRF4 and between SH3BP5—MAPK10 are available from the HPRD data set (experimental/biochemical data) as a direct physical interaction (blue). The different article sources re-examine the interaction predictions for different cancer entities: “DLBCL”, “no cancer disease” and “other cancer”. Note that these categories support the interactions from three different view points (Fig. S5). We find that 11 of the 18 best separating genes and 8 of the 9 separating classical lymphoma genes are members of this dense interaction network. This is supported by the interaction data, the HPRD database and various specific interaction evidence types collated by the STRING database.
The remaining 8 genes, 7 from the first mentioned set and 1 from the latter one, are not part of the databases. Cyclin D2 (CCND2) occurs in both subsets and we obtain a protein association network of 18 nodes. Regarding network regulation the underlined genes are higher expressed in ABC, all others are higher expressed in GCB subtype: ASB13,
Regulatory network of genes best distinguishing ABC and GCB.

The genes of the network in Figure 4 (suppl.) are associated to the functional categories “Proliferation”, “Block of proliferation”, “Apoptosis”, “Differentiation” and “Immune cell specific”, by their annotation. Most of them are part of the antagonists “Proliferation” and “Block of proliferation”. This indicates the complex regulation and importance of proliferation in the determination of ABC and GCB lymphomas. Classical lymphoma genes (see Table S4) known previously are given in italics.
Moreover, 5 of the 8 cell cycle genes, identified in Figure S3 above, to be regulated differently are directly interacting with this regulatory network (Fig. S5). The genes with a significantly higher expression in the ABC group are marked by a red rectangle, whereas green ellipses mark higher expression in GCB. These differences are an interesting pointer for a more specific anti-cancer treatment.
Gene functions for well separating genes
The shorter survival of patients with ABC DLBCL is connected to pathways expressed differently from GCB DLBCL; thus the well known BCL2, as a central apoptosis blocker is higher expressed and allows cancer cell survival in ABC DLBCL. BCL6, a transcriptional repressor important for B-cell differentiation, is down-regulated in ABC DLBCL. Altogether, apoptosis genes are lower expressed in the ABC DLBCL subtype.
Furthermore, the low gene expression values of the gene MME, a proliferation blocker, CCND2 and BCL7A, both genes which promote proliferation, and high values of SH3BP5 in the ABC DLBCL patients stimulate proliferation.
Both the immune cell specific genes IGHM and IRF4 are higher expressed in ABC DLBCL; however, all genes which are associated with differentiation are down-regulated.
In conclusion, this network indicates down-regulation of apoptosis and differentiation for the ABC DLBCL patients whereas the proliferation and immune cell stimulating genes are up-regulated.
From the cell cycle genes which are connected to the network, IL6 and IER5 show higher values in the ABC group whereas BTNL9 and CCNG2 show an up-regulation in the GCB group. For the latter it is known that CCNG2 and IL6 block the proliferation.
In order to further validate the found gene expression differences, we show that several of these are found again after analyzing further data from Shipp et al. (Shipp et al. 2002; Wright et al. 2003; Table S12).
Do the clear gene expression differences between both subgroups reflect only differences in B-cell specific regulation? In order to gain a first impression regarding T-cell regulatory pathways from our data we tested whether notch genes, trans-membrane receptors important in T cell differentiation and repressed in many cancers (Reizis and Leder, 2002), regulate differently the target genes in the two groups. Target genes are regulated by GY-box-, Brd-box-, and K-box-class microRNAs in the 3‘-UTRs e.g. in Drosophila (Lai et al. 2005). We mapped all genes of the Lymphochip to the transcripts annotated in ensembl. We screened these and found candidate notch target genes, whose transcripts bear the mentioned target sequences. All three boxes were found in the genes given in supplementary Table S11. From these transcripts the “Deoxycytidine kinase” gene (ENSG00000156136, DCK) and the “Translocation associated membrane protein 2” (ENSG00000065308, TRAM2) show clear gene expression differences between the ABC and GCB subgroups.
Discussion
Marker genes for DLBCL subtypes
This study improves marker gene detection for prognosis and subtype diagnosis of diffuse large B-cell lymphomas (DLBCL) applying a wide range of methods useful also for other gene expression measurements in cancer. A special patient group are primary mediastinal B-cell lymphomas. Patients recognized with this disease (6 cases) were excluded from the data set and hence are neither visible nor contained in the further analysis. This is in accordance with previous studies (Rosenwald et al. 2002) and other data sets (Alizadeh et al. 2000; Shipp et al. 2002; Wright et al. 2003).
The classification of all other diffuse large B-cell lymphoma into two pathological entities has been established by marker genes and their expression (Alizadeh et al. 2000). A third entity has been discussed (Hans et al. 2004) but was disputed again in the light of recent data. Our statistical analysis by ISIS method (von Heydebreck et al. 2001) provides an independent method and validates and supports only these two subgroups. In addition to previous work (Rosenwald et al. 2002), ISIS analysis here clearly indicates for a large data set the bipartition of all patient data into the two subgroups ABC and GCB through an unbiased and independent statistical method. An adequate normalization of the gene expression intensities applying the loess method (Yang et al. 2001; Yang et al. 2002) allowed a better separation for best and worse outcome quartiles of survival, in particular for patients with medium IPI score where a better separation is important for accurate prognosis. We found a simplified (6 instead of 17 gene spots) survival predictor useful for clinical monitoring e.g. applying RT-PCR (Lossos et al. 2003). Multivariate analysis showed that a four-spot predictor does not perform well. However, univariate analysis found a six spot prognosis predictor which is superior to a previous six-spot predictor (Lossos et al. 2004) and to an alternative five spot predictor, in particular regarding high risk patients.
Integrated picture of all gene regulation differences
Following this, the statistical analysis identified all genes which well distinguish the ABC and GCB DLBCL subgroups including differences in early and late cell cycle which could be exploited for a differential cytostatic therapy in the two subgroups.
We considered all the identified gene expression differences in order to obtain a detailed description of the differences between both DLBCL subgroups regarding regulation of the cellular network. We show that immune signatures, apoptotic and proliferation pathways are tuned in different ways between ABC and GCB DLBCL. A central circuit of genes is formed by genes that distinguish both lymphoma subgroups and are regulated differently. We also verified this for other data after completion of the first analysis. For the data in Shipp et al. (2002) and Wright et al. (2003) once again key genes from the central network shown in Figure S4 are confirmed as having a significant different regulation in this totally different data and patient set (Table S12). Classical lymphoma genes are either directly or indirectly interacting with it. Besides this central network other pathways are also implicated, we showed that two Notch pathway targets are specifically up-regulated. PAM has been shown previously to be a powerful method for gene selection (Tibshirani et al. 2002).
The different predictors shown in this study were the best predictors according to PAM curves and statistical analysis and gave clear improvements for prognosis prediction compared to previous studies (Rosenwald et al. 2002; Lossos et al. 2004) including a six spot predictor for clinical application. Furthermore, our results are based on experimental gene expression data on 248 patients and individual analysis of 12196 array spots whereas pooled data and fewer patients were used in older studies (Rosenwald et al. 2002; Lossos et al. 2004). Interesting marker genes were found in this study by different statistical methods (PAM, ISIS, LIMMA). Clearly, using other methods (e.g. support vector machines) different gene sets can be obtained. In our study, the ISIS method is applied for explorative analysis and unbiased classification without prior knowledge or gene signatures. It supports independently the two distinct B-cell lymphoma subgroups. The different gene sets were further validated against each other by including classical marker genes. Moreover, we validate in our study key marker genes we found by analysis of additional and further data (Shipp et al. 2002; Wright et al. 2003). A new perspective from this study is that genes found differently expressed in the two B-cell lymphoma types form a compact interaction network including cell cycle genes. This is obtained by another independent analysis method (protein-protein interaction database STRING). Furthermore, the delineated regulatory network adds biological data and data from large-scale interaction databases to show that the identified marker genes are in fact members of a closely interacting regulatory network, with molecular functions that mirror the differences in pathology of the two subgroups GCB and ABC DLBCL.
The identification of cell cycle genes expressed differently indicates here new possible targets for therapy. Differences between the ABC and GCB DLBCL subgroups are at the beginning and the end of the M-phase and the early part of the G1 phase. Inhibiting early cell cycle genes, overexpressed in ABC and adding known cytostatic drugs such as mitosis inhibitors and early G1 blocker may be particularly useful for ABC DLBCL patients. A more detailed therapy profile would take the further differences in regulation into account.
Conclusion
The present analysis reveals through the use of an array of methods a detailed picture of molecular markers differentiating cancer subtypes. We apply it to GCB and ABC DLBCL for clinical use in determining prognosis and diagnosis. This included efficient six spot predictors for prognosis and clinical application. The entities ABC and GCB DLBCL have been confirmed by statistical analysis independent of gene expression signatures, a third entity could not be supported. The resulting genes with altered expression were found to form a tightly connected regulatory network including cell cycle genes, apoptosis and immune differentiation implicated in the aggressive behaviour of ABC DLBCL compared to the GCB DLBCL subtype.
Footnotes
Supplemental Methods
To systematically identify spots which describe the outcome and cooperate well with each other in the Cox regression hazard model a multivariate analysis is desirable. However, this requires a huge search space of combinations to be tested. To reduce this we considered only four spot combinations of (i) the gene spots suggest by Rosenwald et al. (Rosenwald et al. 2002), (ii) the 36 important genes for diffuse large B-cell lymphoma chosen by Lossos et al. (Lossos et al. 2004) or (iii) the LDH-, IDH-, and PDH gene spots (the latter to better reflect IPI-scores). Cox Regression Hazard analysis was performed on all possible four tuples of these 153 indicator spots testing 160 patients (several days of calculation time on a LINUX cluster with 20 nodes of Pentium IV CPUs). Table S1 shows the gene content of the ten best multivariate four-spot-predictors (the next best combinations after removing these spots is found in Table S2). The best multivariate four-spot combination is compact and small, but neither as good as the five spot predictor in results nor as the signatures from Rosenwald et al. (Rosenwald et al 2002). The analysis further shows that there is a correlation with survival prediction for the clinical parameter LDH (Table S2), but the prediction based on this well known parameter (part of the IPI score) is even worse then the results shown in Table S2.
In contrast (see below), the new five-spot and six-spot predictors identified by univariate analysis will be useful heuristics for diagnosis and clinic, e.g. to identify risk quartiles and subgroups (Fig. S1).
Acknowledgments
We thank the State of Bavaria for support (IZKF B-36; ENB Lead Structures of Cell Function; SFB688 TP A2).