
Abstract
Background
Cell cycle is an important clue to unravel the mechanism of cancer cells. Recently, expression profiles of cDNA microarray data of Cancer cell cycle are available for the information of dynamic interactions among Cancer cell cycle related genes. Therefore, it is more appealing to construct a dynamic model for gene regulatory network of Cancer cell cycle to gain more insight into the infrastructure of gene regulatory mechanism of cancer cell via microarray data.
Results
Based on the gene regulatory dynamic model and microarray data, we construct the whole dynamic gene regulatory network of Cancer cell cycle. In this study, we trace back upstream regulatory genes of a target gene to infer the regulatory pathways of the gene network by maximum likelihood estimation method. Finally, based on the dynamic regulatory network, we analyze the regulatory abilities and sensitivities of regulatory genes to clarify their roles in the mechanism of Cancer cell cycle.
Conclusions
Our study presents a systematically iterative approach to discern and characterize the transcriptional regulatory network in Hela cell cycle from the raw expression profiles. The transcription regulatory network in Hela cell cycle can also be confirmed by some experimental reviews. Based on our study and some literature reviews, we can predict and clarify the E2F target genes in G1/S phase, which are crucial for regulating cell cycle progression and tumorigenesis. From the results of the network construction and literature confirmation, we infer that MCM4, MCM5, CDC6, CDC25A, UNG and E2F2 are E2F target genes in Hela cell cycle.
Introduction
The losses of cellular regulation give rise to most case of cancer. In cells, intricate genetic control systems regulate the balance between cell survival and death in response to growth signals, growth-inhibiting signals, and death signals. When some errors occur in the control systems causing cells to proliferate continuously, tumor just comes into being (Badawi et al. 2005).
The proliferation of cancer cell into two individual cells must go through cell cycle process (Whitfield et al. 2002; Valsesia-Wittmann et al. 2004). Cell cycle entails an ordered series of macromolecular events that lead to cell division and the production of two daughter cells. So that cell cycle is meaningful to the proliferation of cancer cell.
Expression levels of thousands of genes fluctuate throughout the cancer cell cycle (Cho et al. 2001; Ishida et al. 2001; Whitfield et al. 2002). Functional genes show periodic transcription to reflect cell growth, DNA synthesis, spindle pole body duplication and migration through the cell cycle (Cho et al. 1998). These processes and their regulation have been extensively investigated at the molecular level (Stillman, 1996; Nurse, 2000; Shah and Cleveland, 2000; Hinchcliffe and Sluder, 2001; Chen et al. 2004). Systems biology can be described as “integrative biology” with the ultimate goal of being able to predict de novo biological outcomes given the list of the components involved (Liu, 2005). Hence it is the coordinated study by (1) investigating the components of cellular networks and their interactions, (2) applying experimental high-throughput and whole-genome techniques, and (3) integrating computational methods with experimental effort (Klipp et al. 2005). In this situation, characterization of the genome-wide transcriptional program of the cell division cycle in mammalian cells is a critical step toward understanding the basic cell cycle processes and their roles in cancer. Therefore, it is worth investigating how these periodic patterns are regulated in the gene regulatory network of the cancer cell cycle from the systems biology perspective.
Gene expression data of Hela cell cycle have been collected (Whitfield et al. 2002) and analyzed with many clustering methods to organize which gene is associated with the cell cycle (Whitfield et al. 2002;Cho et al. 2001). Theoretically, it is possible to engineer the cell cycle network reversely, if we take cDNA expression levels as the output of gene expression networks, and collect cDNA expression levels of transcription factors as input. In order to realize how genes are regulated by transcription factors, we must also understand the interactions between target genes and their transcription factors (which transcription factor binds to which promoters). With all these information and interactive dynamic model, we get some clues to piece up the gene expression regulatory network in Hela cell cycle.
In this study, we attempt to devise an interactive dynamic model to characterize transcriptional regulatory network of the Hela cell cycle from the cDNA expression data of the human cell cycle in tumour (Whitfield et al. 2002). Based on our dynamic regulatory network, we not only predict the upstream regulators but also characterize the significance of the regulators depending on quantifying their regulatory abilities based on the corresponding biochemical kinetic parameters. At first, we construct a discrete-time dynamic model system and calculate the system kinetic parameters as the regulatory ability by using the expression data (Whitfield et al. 2002) and the system identification method (Johansson, 1993). Second, based on the interactive dynamic model, we detect the transcriptional regulatory function of target genes by the maximum likelihood parameter estimation method. Third, we trace back a group of upstream genes that play a role of transcriptional regulators of target genes in the Hela cell cycle of Homo sapiens via deducing the interactive relationship between the expression profiles of regulators and the detected transcription regulation of specific target genes. The pathway kinetic parameters of transcriptional regulatory network of Hela cell cycle are also estimated by the cDNA expression profiles of target genes and their upstream regulatory genes. Finally, these upstream regulatory genes are considered as the target genes. By a similar method, we construct their upstream regulatory genes one by one. Iteratively, we can construct the whole gene regulatory network of Hela cell cycle.
We applied our method to a publicly available data set of HeLa cell with microarray experiment on cell cycle (Whitfield et al. 2002) to identify the transcriptional regulators of cell cycle and to characterize their regulatory abilities on specific target genes. By means of the quantitative system analysis of the transcriptional regulatory network from Hela cell cycle genes, several transcription factors were identified and their regulatory abilities were determined. Further, some genes that may be suspected of regulators of Hela cell cycle are predicted here to be synergistic in harmonizing gene expression. Our proposed algorithm provides a novel approach to gain insight into the gene regulatory network of Hela cell by its gene expression data using system identification technique and discrete-time dynamic model. Furthermore, we combine the constructed Hela cell cycle dynamic network, some experimental reviews and E2F binding site's research (Ren et al. 2002), we not only confirm the reliability of the dynamic network but also find the E2F target genes in Hela cell cycle progression. Finally, from the results of this study, we infer that E2F directly regulate MCM4, MCM5, CDC6, CDC25A, UNG and E2F2 in Hela cell cycle progression.
Our approach is so different from the statistical clustering method that it not only provides a suitable interactive dynamic model to decipher the complex signal transduction pathway that regulates gene expressions in Hela cell cycle but also predicts some potential regulators that have not been found. We can also quantify the regulatory abilities of the transcription factors by the corresponding kinetic activities to their target genes in the Hela cell cycle regulatory network. We could construct the cell cycle regulatory network in Hela cells quantitatively and discuss the sensitivity of regulatory genes to the gene regulatory network from the system analysis perspective.
System Model and Network Identification
The construction of the transcriptional regulatory network of Hela cell cycle can be divided into two steps. First, the transcriptional regulation should be extracted from the gene expression data by the dynamic discrete-time model. Second, the upstream regulators will be traced back by correlating the transcriptional regulation of target genes with the expression profiles of possible regulators of Hela cell cycle. In this study, 64 transcription regulators, as shown in Table 1, are used as candidates of upstream regulators to each target gene. Finally, the kinetic parameters of gene transcriptional regulatory network of Hela cell are estimated by the cDNA expression profiles of target genes and their upstream regulatory genes.
ClonelDs (Whitfield et al. 2002) of 64 transcription factors in human cell cycle are selected as candidates to regulate downstream target genes.

Dynamic signaling regulatory model
The second-order difference equation is used in the description of dynamic system evolved from the causality of gene regulatory function. Let Xi(k) denote the expression profile of the i-th gene at time point k. The following second-order difference equation is proposed to model the cDNA expression level of the i-th gene,

where Gi(k) is the upstream transcriptional regulatory function from regulatory genes to influence the expression profile Xi(k) of the i-th gene while ai and bi are the parameters that characterize the dynamic inherent property of the gene like degradation and oscillation, and ∈i (k) is the random noise of current microarray data or the residue of the model. In general, the second-order difference equation has been widely used to model dynamic discrete-time systems to efficiently characterize the dynamic properties of damping and resonance of systems in physics and engineering. The reason is that the roots of the characteristic equation of second-order dynamic equation may be a real double root, two real roots or conjugate roots, which could easily describe a system with undamping, overdamping, critical damping, under-damping or oscillation, dependent on the specification of their coefficients (Kreszig, 1993). These characteristics can not be easily described by the first-order dynamic equation. Therefore the second order stochastic equation is employed to characterize the biochemical processing of the gene expression.
Evidently, the transcriptional regulatory function Gi(k) controls the synthetic rate of cDNA and the clue of upstream regulatory pathway is involved in Gi(k). Therefore we emphasize on how to detect the upstream regulatory function Gi(k) from expression data Xi(k) and our dynamic model equation in Equation 1). In general, it is not easy to extract transcriptional regulatory function Gi(k). In order to extract the input regulatory function Gi(k), we apply Fourier decomposition method to decompose Gi(k) to generate some harmonic sinusoid functions. When the extraction problem is reduced to a simple parameter estimation problem, Gi(k) can be decomposed by the following Fourier series.
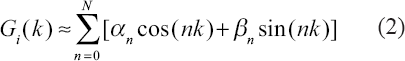
Then we need to estimate the parameters of Fourier series, αn and βn, that are the magnitudes of different harmonics of sinusoid functions (cos(nt) and sin(nt)) for n = 0, …, N. Fourier series is a good tool to synthesize functions with finite energy by harmonic functions in respect of engineering.
Extraction of the transcriptional regulatory function Gi(k)
Since Gi(k) has been decomposed, we combine equations (1) and (2) to get the following dynamic model equation for the expression profile of the i-th gene,

In the above dynamic model equation, the parameters ai, bi, αn, and βn should be estimated by the time profile of expression data of the i-th gene in linear scale, i.e. these parameters should be specified so that the simulating output Xi(k) of the dynamic model in Equation 3) should match the expression profile of the i-th gene. The maximum likelihood estimation method is employed to estimate these parameters ai, bi, αn, and βn in Equation 3) from the expression profile Xi(k) in the section Methods.
After the parameters αn and βn of the regulatory function Gi(k) have been estimated in the section Methods, we can present the regulation detection Ĝi(k)as follows,
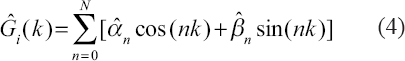
where
We know that the input transcriptional regulatory function Gi(k) of the target gene of Hela cell cycle is often relative to the bindings of transcription factors or some interactions from the upstream regulators. In the next step, we will trace back the corresponding regulatory genes from the input regulatory function Ĝi(k) of the target gene.
Iterative algorithm for constructing gene regulatory network
In biology, the specific biochemical reactions are usually relative to the concentration of specific products. For this purpose, we describe the regulatory function as the following sigmoid function to describe the binding and nonbinding of transcription factors to motif binding sites (Chen et al. 2004; Klipp et al. 2005)

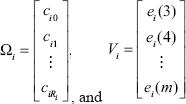
We determined, regulatory genes whose regulatory signals Xi(k)j = 1, …, R are the most correlative to the target gene profile Xi(k) of the i-th target gene. Then, we could reconstruct the gene regulatory network by tracing back the upstream regulators from the extracted regulatory function Ĝi (k), which are contributed by Ri regulatory genes, via the following biochemical kinetic relationship,

Using the maximum likelihood algorithm in Method to estimate the parameters ci0 and c
ij
from Ĝi(k) and Xi(k), the regulation from the upstream regulators is identified as


where i = 1,2,… for all profile target genes in Hela cell cycle.
In fact, Equation 8) contains much information for exploring the regulatory network of each specific target gene of the Hela cell cycle. The regulatory genes, which belong to a specific set, Ri, represent the potential upstream regulators for target gene i. The estimated chemical kinetic parameter, ĉij, characterizes the type and intensity of the influence of they jth regulatory gene on the ith target gene, in which positive sign indicates activation and a negative sign indicates repression, and the magnitude is defined as the regulatory ability. After the regulatory pathways of the ith target gene is constructed by tracing back their upstream regulatory genes, these Ri upstream regulators are considered as target genes again to trace back their upstream regulatory genes. Iteratively, we can construct the whole gene regulatory network of the Hela cell cycle globally. The goal of reverse engineering gene regulatory network is to deduce the possible set of regulators and to identify their associated regulation abilities by the available data set from the dynamic system perspective. For this purpose, we devise a novel algorithm based on the dynamic gene expression model for searching possible upstream regulators and then identifying the relevant regulatory abilities ĉij according to Equation 8).
Results
Data processing and analysis
Data were extracted by superimposing a grid over each array using GenePix 3.0 software (Axon Instruments). Spots of poor quality, determined by visual inspection, were removed from further analysis. Data of HeLa cell collected for each array were stored in the Stanford Microarray Database (SMD) and are available from SMD at http://genome-www5.stanford.edu/ (Sherlock et al. 2001; Whitfield et al. 2002).
We combine 775 cell cycle-related genes from the Human expression of Hela cell cycle-regulated genes according to the classification by Whitfield et al. (2002) with Human expression of cell cycle-regulated genes according to the traditional classification as the target genes. After that, we select 64 transcription factors (Table 1) from the 775 cell cycle genes (Whitfield et al. 2002).
The raw data were transformed into a linear scale from the original log ratio and applied to our approach. Following the dynamic model in Equation 8), the parameters which characterize the dynamic regulatory mechanism are estimated successfully for each target gene in the pathway. Fig. 1 compares the simulation results of the dynamic expression model in Equation 8) with the experimental expression profiles for some important cell cycle-related genes regulated by E2F family (Bracken et al. 2004), such as CDC25A (Stanelle et al. 2002; Muller and Helin, 2000; Ren et al. 2002), MCM6 (Ren et al. 2002; Polager et al. 2002; Ishida et al. 2001), E2F1 (Bracken, 2004), CDC6 (Stanelle et al. 2002; Ren et al. 2002), E2F2 (Ren et al. 2002; Muller et al. 2001), MCM5 (Ren et al. 2002; Ishida et al. 2001), MCM4 (Ren et al. 2002; Ishida et al. 2001), PCNA (Muller and Helin, 2000; Ren et al. 2002; Polager et al. 2002; Ishida et al. 2001), RFC4 (Ren et al. 2002; Polager et al. 2002), and DHFR (Ishida et al. 2001). The extracted regulatory functions, Ĝi(k) of these genes which are estimated by the maximum likelihood algorithm in Methods from their expression profiles are shown in Fig. 2. The extracted regulatory function Ĝi(k) in Fig. 2 are employed to estimate the kinetic parameters of gene regulatory network in Equation 8) by the parameter estimation scheme in Methods. Our iterative algorithm can find the most likely regulatory genes that may participate in the expression program of Hela cell cycle genes.

The second-order dynamic model fitting of E2F target genes.

The extracted upstream regulatory functions from expression profiles (Whitfield et al. 2002) and their fitting by upstream regulatory genes.
Inference of the regulatory pathway
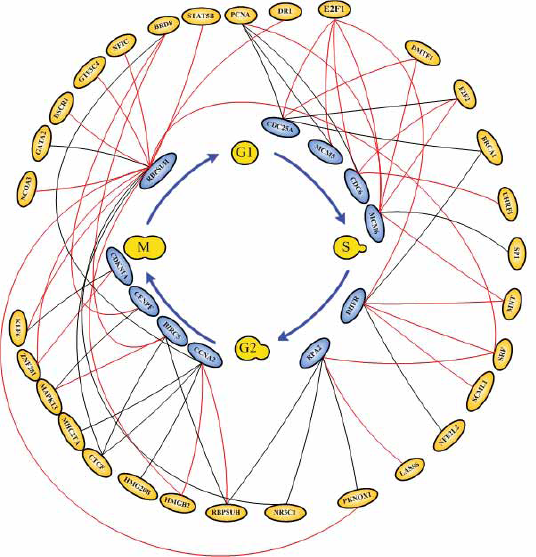
For illustrations, the inferring strategy is applied to the E2F target genes (Bracken et al. 2004) in Hela cell cycle pathways to recognize their upstream regulatory genes. E2F transcription factors are well studied owing to their importance in both cell cycle (Muller and Helin, 2000; Nevins, 2001). Their regulatory abilities are shown in the upstream regulatory functions Ĝi(k) of dynamic equation in Table 2. Parameters of regulatory functions Ĝi (k) in Table 2 represent the regulatory abilities and sensitivities of the relative transcription factors. It is very exciting that E2F1 and E2F2 are found to be active regulators in most E2F target genes listed in Table 2, which agree very well with the previous results (Cam and Dynlacht, 2003; Ivey-Hoyle et al. 1993; Lang et al. 2001). The regulatory abilities of the related regulators implying different degrees of influence are converted to the red-colored lines as positive regulations (activations) and the black-colored lines as negative regulations (inhibitions) for each target gene. Then, based on the dynamic regulatory equations in Table 2 (see detail in Supplementary Table S1), the pathways of E2F target gene in Hela cell cycle regulatory system are described in Fig. 3. The coefficients of these dynamic regulatory equations represent the kinetic activities of regulatory genes. If a regulatory gene is with a large kinetic parameter in the dynamic regulatory equation, it will play an important role in Hela cell cycle and is more sensitive to the gene expression of target gene.
Upstream regulatory TFs and their regulatory function Ĝi (k) on E2F target genes in cancer cell cycle. The positive sign implies activations while the negative sign implies inhibitions for each target gene. The magnitudes indicate their regulatory abilities to the downstream target genes.

A miniature dynamic model network with the identified upstream regultors and their downstream target genes in the pathway of E2F target genes in cancer cell cycle. The coefficients characterize the corresponding regulatory abilities and sensitivities of the transcription regulations. The positive sign implies activations while the negative sign implies inhibitions for each target gene.

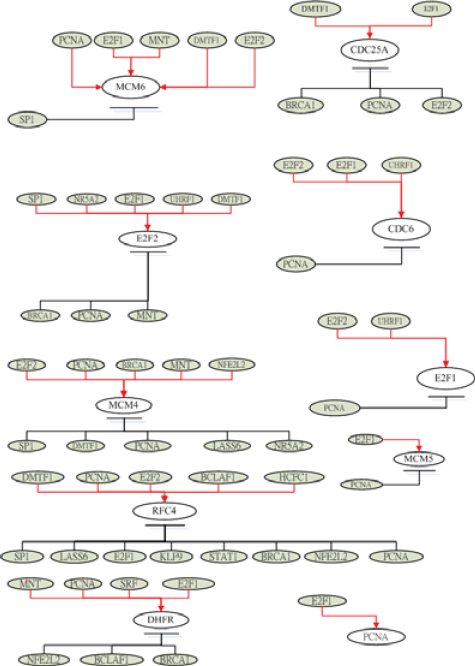
The regulatory pathways of E2F target genes in cancer cell cycle based on the dynamic regulatory modeling in Table 1.
Based on the dynamic regulatory modeling, the 152 E2F target genes are found and shown in Table 3. In these 152 E2F target genes, 6 genes match the E2F target genes found by Elkon et al. (2003) from 124 E2F target genes edited by Ren et al. (2002) and 17 genes match the E2F target genes found by Elkon et al. (2003) from 872 periodic genes edited by Whitfield et al. (2002). Ren et al. (2002) has found 124 E2F target genes with E2F binding promoter. The comparisons of these results are shown in Fig. 9.
The 152 E2F target genes in the gene regulatory network based on the dynamic regulatory modeling.
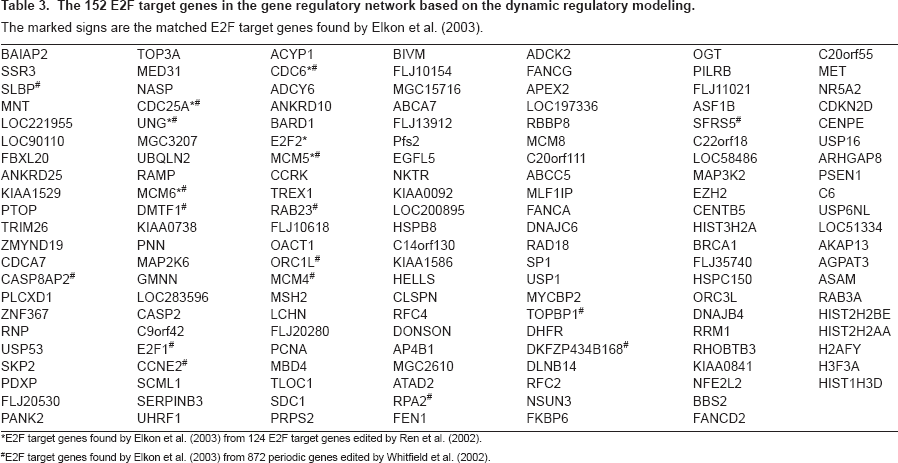
E2F target genes found by Elkon et al. (2003) from 124 E2F target genes edited by Ren et al. (2002).
E2F target genes found by Elkon et al. (2003) from 872 periodic genes edited by Whitfield et al. (2002).
After finishing the construction of the first layer network of E2F target genes (Bracken et al. 2004), we take these upstream regulators as target genes. By using similar method, we construct the upstream regulatory genes of these target genes. In the second layer network, the regulatory abilities implying different degrees of influence are converted into pink-colored lines as positive regulations (activations) and blue-colored lines as negative regulations (inhibitions). Then, we combine the first layer network and the second layer network together to form a more complete network to E2F target genes in HeLa cell cycle as described in Fig. 4. Iteratively, we can construct the higher layer network to complete the gene regulatory network of Hela cell cycle.

The network of E2F target genes in cancer cell cycle based on the dynamic regulatory modeling.
Discussion
The losses of cellular regulation give rise to most cases of cancer. The transcription factors are crucial for regulating cell cycle progression and may be related to the development of a cancer. Therefore, to understand these gene regulatory processes, we need to unravel the regulatory mechanisms of these transcription factors in cell cycle. Our study presents a systematically iterative approach to discern and characterize the transcriptional regulatory network of 775 cell cycle-related genes from the raw expression profiles of Hela cell (Whitfield et al. 2002). Because the transcriptional regulatory network of 775 cell cycle-related genes is very complicated, two miniature gene regulatory networks of E2F family during G1/S phase in Fig. 4 and the other family during G2/M in Fig. 8 are given to illustrate the regulatory mechanism of Hela cell.
Our approach also offers the following advantages. First, based on the dynamic regulatory model, a gene regulatory network of cancer cell could be constructed by the extracted upstream regulatory function through microarray data. Then, the identified regulatory ability for each specific regulator could evaluate the contribution of this regulator; the positive sign stands for activation and the negative sign stands for repression, and the magnitude represents the significance. These advantages of the proposed approach will improve the analysis to cope with rapidly growing microarray data of human. BRCA1 is one of the important cell cycle-related genes to play as a transcriptional repressor in cell cycle progress (Kennedy et al. 2005). This finding matches the gene regulatory network constructed by dynamic regulatory model (shown in Fig. 4 and Fig. 5). It is clear that E2F regulates the expression of a host of factors that function during G1/S transition and S phase even the whole cell cycle (Bracken et al. 2004). E2F is best known for its role in regulating the transcription of genes that positively affect cell cycle progression (Ortega et al. 2002; Sherr and Roberts, 1999; Di et al. 2003; Stott et al. 1998; Trimarchi and Lees, 2002; Hayashi et al. 2006). Our results almost match this finding (shown in Fig. 4 and Fig. 5). Hayashi with his collaborator found that E2F1 activates human MCM8. In our study, we found that E2F1 activates human MCM5 and MCM6 (shown in Fig. 4 and Fig. 5). Elkon et al. (2003) and Ren et al. (2002) have found that human MCM5 and MCM6 are two E2F target genes (shown in Table 3). As a result of these studies, we infer that human MCM5 and MCM6 may be positively regulated directly by E2F1 in Hela cell cycle. Accumulating evidence indicates that cdc25A possesses oncogenic properties. Recently, overexpression of cdc25A was found in many breast, head and neck cancers (Wu et al. 1998). CDC6 plays a critical role in the regulation of the onset of DNA replication in eukaryotic cells and Cdc6 expression is down-regulated in prostate cancer (Robles et al. 2002). From the results of Table 3, we could infer that E2F directly regulates MCM4, MCM5, CDC6, CDC25A, UNG and E2F2 in Hela cell cycle progression. In Fig. 5, we represent some E2F target genes and show the importance of E2F transcription factor in Hela cell cycle progression. In Fig. 7, we also predict the probable transcription regulations in some target genes, which express in G2/M phase of human cell cycle as shown in the regulatory network of Fig. 8. Further, we can construct not only E2F related regulatory network but also the whole Hela cell cycle network if we have genome-wide microarray data and CHIP data. However, at present, we still need to get enough evidence and CHIP experiments in the same cellular system to confirm our gene regulatory network of Hela cell cycle (Bracken et al. 2004).
The miniature cancer cell cycle network.
Based on the dynamic regulatory modeling, the 152 E2F target genes are found and shown in Table 3. These target genes may be regulated by E2F directly or indirectly. In these 152 E2F target genes, 6 genes match the E2F target genes found by Elkon et al. (2003) from 124 E2F target genes with E2F promoter edited by Ren et al. (2002) and 17 genes match the E2F target genes found by Elkon et al. (2003) from 872 periodic genes in Hela cell cycle edited by Whitfield et al. (2002).
Finally, in order to validate the proposed approach, an independent validation is also given by randomly reshuffling the time order of microarray experiment but with the same choices of target gene and regulatory genes, to confirm the reliability of the proposed method as shown in Fig. 6. As previous statement, BRCA1 plays as a transcriptional repressor in cell cycle progress (Kennedy et al. 2005) (shown in Fig. 5). From the shuffling results shown in Fig. 6, BRCA1 becomes a transcriptional activator. It is clearly seen that the proposed Hela cell cycle regulatory pathway in Fig. 5 is destroyed by reshuffling the experimental data.

The miniature cancer cell cycle network in Fig. 5 is repeated as independent validation by randomly reshuffling the time order of microarray experiment but with the same choices of target and regulatory genes.

The regulatory pathways of target genes, which expressed in G2/M phase of human cell cycle, are based on the dynamic regulatory modeling.

The gene regulatory network of in G2/M phase of cancer cell cycle based on the dynamic regulatory modeling and the interactions of regulatory pathways in Fig. 7.
Methods
Maximum likelihood Estimation of ai, bi, αn and βn
The dynamic Equation 3) must match the expression profile at all time points and then is arranged in a vector difference form. Consequently, the vector dynamic form of this equation is applied to m time points of expression profile in order to make the dynamic model work.

where


where Φ i = [ai bi α0 β0 … αNβN]T and Ei = ∈ im are in vector forms, and Ai = [-Xim-1-Xim-2 cos(0) sin(0) … cos (N) sin (N)]Tis a matrix.
Then we use the maximum likelihood estimation to derive the optimal parameters estimation of
We assume that each element in the error vectors, ∈
i
(k), k = (3, …, m), is an independent random variable with a normal distribution with zero mean and variance σ
2
, and we will estimate the parameter

The log-likelihood function for given m data points is then described by–

Here we expect the log-likelihood function to have the maximum at

The estimated parameters 

Theoretically, Ei is just the noise of the gene expression profile of the microarray chips, but some modeling errors and approximation errors in Equation 2) are also involved in Ei. So that taking the modeling error and approximation error in our consideration makes our dynamic model equation more approach the actual situation. The number of Fourier series N is determined by tradeoff between the computational complexity of parameter estimation in equation (M.6) and the accuracy of approximation in Equation 2). According to our expression data, we choose N = 16 to make the synthesis of these harmonics be the best approximation to the expression data.
Parameter Estimation of ci0 and Cij
To estimate the pathway kinetic parameters cij in Equation 6) by Ĝi (k) and 
We assume that each element in the error vectors, ei(k), k = {3,…, m}, is an independent random variable with a normal distribution with zero mean and variance 

Footnotes
Acknowledgements
We thank the National Science Council, Taiwan for grants NSC 95-2627-B-007-011.