
Abstract
Objective:
To explore different mRNA transcriptome patterns and RNA N6-methyladenosine (m6A) alteration in yunaconitine (YA)-treated HT22 mouse hippocampal neuron, and uncover the role of abnormal mRNA expression and RNA m6A modification in YA-induced neurotoxicity.
Methods:
HT22 cells were treated with 0, 5, 10, and 50 μM of YA for 72 h to evaluate their viability and GSH content. Subsequently, mRNA-seq and MeRIP-seq analyses were performed on HT22 cells treated with 0 and 10 μM YA for 72 h, and molecular docking was used to simulate interactions between YA and differentially expressed m6A regulators. The mitochondrial membrane potential was examined using the JC-10 probe, and RT-qPCR was conducted to verify the expression levels of differentially expressed m6A regulatory factors, as well as to assess alterations in the mRNA expression levels of antioxidant genes.
Results:
YA treatment significantly reduced the viability of HT22 cells and decreased GSH content. The mRNA-seq analysis obtained 1018 differentially expressed genes, KEGG and GO enrichment results of differentially expressed genes mainly comprise the nervous system development, cholinergic synapse, response to oxidative stress, and mitochondrial inner membrane. A total of 7 differentially expressed m6A regulators were identified by MeRIP-seq. Notably, molecular docking results suggested a stable interaction between YA and most of the differentially expressed m6A regulators.
Conclusion:
This study showed that YA-induced HT22 cell damage was associated with the increased methylation modification level of target gene m6A and abnormal expression of m6A regulators.
Introduction
Yunaconitine (YA), a primary component of Aconitum species, exhibits anti-inflammatory and analgesic effects.1,2 Apart from its potent pharmacological activities, YA is also a toxic Aconitum alkaloid, mainly acting on the circulatory and nervous system. After poisoning, the major clinical manifestations included vomiting, arrhythmia, hypotension, and dizziness. 3 In recent years, clinical poisoning incidents related to YA have occurred frequently. For example, 7 adults after drinking the medicinal liquor containing aconitum traditional Chinese medicine, exhibited varying degrees of neurological symptoms such as dizziness and vomiting, and were later diagnosed with YA poisoning. 4 Acute toxicity studies indicate that the median lethal dose in mice after subcutaneous injection is 0.26 mg/kg. 5 In addition, it has been reported that after H9C2 cells were treated with 100 μM YA for 24 h, cell viability significantly decreased, while the levels of LDH and MDA increased, and SOD activity decreased, indicating clear oxidative stress damage. 6 Currently, YA is viewed in clinical as a threat to human life due to its neurotoxin properties. However, the research on YA neurotoxicity and its underlying mechanism is rather limited, which significantly constrains the clinical application of aconitum herbs.
Toxic responses commonly involve alterations in gene expression patterns.7,8 Toxicogenomics and epigenomics offer a broader platform for assessing drug safety in comparison to traditional toxicology research. By analyzing large-scale gene expression data, significant genetic changes can be identified and used as biomarkers for risk assessment. For instance, alterations in the expression of genes related to DNA damage repair can indicate genotoxicity. 9 Epigenetic modification refers to heritable changes in gene expression caused by external factors without changing the DNA sequence. Epigenomics involves a thorough investigation of these epigenetic changes across the genome to reveal genetic information that may affect gene function. 10 Within the transmission of genetic data, RNA serves as a vital link between DNA and proteins. However, the levels of protein synthesis may not necessarily correlate positively with mRNA levels, underscoring the importance of post-transcriptional RNA modifications. Over 100 post-transcriptional RNA modifications have been identified,11,12 with methylation being a common flexible genomic factor that can modify genome function in response to external influences. 13 The most prevalent type of mRNA methylation is N6-methyladenosine (m6A), which is essential for regulating various aspects of RNA metabolism.14,15 Predominantly located near the stop codon, m6A features a common RRACH motif (R = G or A; H = A, C, or U). 16 In contrast to DNA methylation, m6A modification is reversible and is catalyzed by “writers” such as METTL3 and WTAP, while it can be eliminated by “erasers” including ALKBH5 and FTO. m6A can influence multiple stages of mRNA metabolism, including translation, splicing, and degradation, by recruiting different “readers.” 17 Recent studies have shown that m6A RNA methylation plays a significant role in regulating cell proliferation, differentiation, and oxidative stress.18 -20 Further elucidation of the underlying mechanisms is illuminating the emerging biological function of this m6A modification.
Therefore, this study utilized mouse hippocampal neurons HT22 cells to clarify the adverse biological effects of YA in oxidative stress. Additionally, we used mRNA-seq and MeRIP-seq to elucidate the potential toxicity mechanism of YA-induced neurotoxicity. Thorough understanding of the neurotoxicity mechanism of aconitum can provide theoretical support for the safer and more rational use of aconitum-containing traditional Chinese medicine in clinical practice.
Methods and Materials
Chemical reagent
YA was obtained from Chengdu Must Bio-Technology Co., Ltd. Nuclear magnetic resonance (NMR) spectra analysis (Figure 1B and C) was conducted to confirm the YA chemical structure (Figure 1A). High-performance liquid chromatography (HPLC) (Thermo Fisher, Waltham, MA, USA) indicated that the YA purity was 98.96% (Figure 1D).

PharmMapper
The YA 2D molecular structure was retrieved from PubChem. Subsequently, small molecules with minimized energy were submitted to the PharmMapper server in mol2 format. The reverse pharmacophore localization database PharmMapper was used to predict the potential targets of YA. The PharmMapper server sorts the resulting target protein outcomes based on their fit score, enabling selection of top-ranked proteins as potential targets for YA. Gene ontology (GO) enrichment and Kyoto Encyclopedia of Genes and Genomes (KEGG) pathway analysis of the target protein were performed using the DAVID database (https://david.ncifcrf.gov/).
Cell culture and treatment
The immortalized mouse hippocampal cell line HT22 was cultured in DMEM medium containing 10% fetal bovine serum (Gibco, New York, NY, USA) and 1% penicillin-streptomycin. The cells were incubated in a humidified atmosphere at 37°C with 5% CO2. YA was dissolved in dimethyl sulfoxide (DMSO) to concentrations of 0, 5, 10, and 50 μM, and then used to treat HT22 cells for 72 h.
Cytotoxicity assay
The HT22 cells in the logarithmic growth phase were seeded in a 96-well plate for 12 h and then cultured with 0, 5, 10, and 50 μM YA for 72 h. Cell viability was determined by using the 3-(4,5-dimethylthiazol-2-yl)-2,5-diphenyltetrazolium bromide (MTT; Macklin, Shanghai, China) colorimetric assay. In brief, after treatment of YA for 72 h, 20 μL 5 mg/mL MTT solution was added to each well and incubated at 37°C for 3 h. The absorbance was measured at 490 nm using a microplate reader (BioTek, Santa Clara, CA, USA).
Intracellular glutathione (GSH) measurement
HT22 cells were seeded on 6-well plates and treated with 0, 5, 10, and 50 μM YA for 72 h. The relative GSH levels were determined using a micro reduced GSH sssay kit (KTB1600, Abbkine, Wuhan, China). Briefly, cell precipitates were collected and 3 times the volume of cells the extraction buffer was added. The suspended cells underwent 3 cycles of freezing and thawing, followed by centrifugation at 8000 ×g for 10 min at 4°C. The absorbance was measured at 412 nm in the supernatant.
RNA extraction
HT22 cells were treated with 0, 5, 10, and 50 μM YA in 6 cm dishes, and total RNA was extracted after 72 h using TRIzol reagent (Invitrogen, Carlsbad, CA, USA). RNA concentration was determined with Qubit3.0 (Thermo Fisher), and the quality evaluation involved analyzing the A260/A280 ratio with the Nanodrop OneC spectrophotometer (Thermo Fisher).
MeRIP-seq and mRNA-seq
Based on the results from the cell viability experiments, we selected the 10 μM YA treatment group with HT22 cell viability at approximately 70% for mRNA-seq and MeRIP-seq. Qualified RNA was used to isolate poly(A) mRNA with VAHTS mRNA capture beads (Vazyme, Nanjing, China). Following purification, the poly(A) mRNA fractions were fragmented into oligonucleotides of 100 to 200 nt using ZnCl2 under 95°C for 10 min. A 10% fraction of mRNA fragments was designated as the “Input” sample, while the remaining portion was utilized for m6A immunoprecipitation (IP). Input and m6A-IP samples were utilized to prepare libraries with KC-Digital Stranded mRNA Library Prep Kit for Illumina (Seqhealth, Wuhan, China). The library products, ranging from 200 to 500 bps, were amplified, quantified, and ultimately sequenced using the PE150 model on the Novaseq 6000 sequencer (Illumina).
Sequencing data analysis
Hisat2 was utilized to align the raw MeRIP-seq data to the mm10 genome reference sequences. 21 The m6A peak calling was performed using exomePeak2 (Suzhou, China), 22 and subsequently, STREME was employed to identify the m6A motif sequences. 23 StringTie (Baltimore, MD, USA) and DESeq2 were applied to analyze the mRNA expression levels between YA and control group.24,25 The differentially expressed genes were subjected to enrichment analysis using DAVID with the GO and KEGG pathways. 26 STRING was used for protein - protein interaction (PPI) analysis, and the results were presented through Cytoscape software. ConsRM and RMDisease were utilized to analyze the conservation of m6A and its association with diseases.27,28 The substrates of m6A regulators determined through RM2Target datasets. 29
Molecular docking
Molecular docking is a structure-based computational simulation method that aims to predict the interaction between small molecular compounds and target proteins. In this study, SYBYL-X 2.0 software (Tripos, St. Louis, MO, USA) was employed to perform molecular docking analysis to examine the interaction of YA with differentially expressed m6A regulators. The protein structures were obtained from the AlphaFold and PDB databases, followed by protein preprocessing using SYBYL-X 2.0, which includes tasks such as adding hydrogen atoms, removing heteroatoms, and water molecules.
The YA 2D molecular structure was sourced from PubChem and its 3D structure was generated following the principle of energy minimization. In the Surflex-Dock Geom mode, the protein was docked with YA using the semi-flexible docking method. Based on the principle of energy minimization, the conformation with the lowest binding energy was selected as the final docking result. The total docking score was a composite evaluation of solvation, entropy, hydrophobic complementarity, and polar complementarity. A score exceeding 5 indicated that the interaction between the protein and molecule was stabilized.
Assessment of mitochondrial membrane potential (MMP)
In order to measure the MMP, the JC-10 probe (Solarbio, Beijing, China) was employed. The MMP is typically maintained at a high level, and the JC-10 probe forms aggregates in the mitochondria matrix, resulting in red fluorescence. However, when there is damage to the mitochondria, the MMP decreases, preventing the aggregation of the JC-10 probe and causing it to exist as monomers that emit green fluorescence instead. The transition of the JC-10 probe from red to green fluorescence indicates a decrease in MMP. 0.03% H2O2 is commonly utilized as a positive control in experiments due to its ability to induce a reduction in mitochondrial membrane potential.
HT22 cells were treated with 0, 5, 10, and 50 μM YA for 72 h. Then JC-10 probe was added and incubated at 37°C in the dark for 20 min. Subsequently, fluorescence images were captured with a fluorescence microscope (Zeiss, Oberko-chen, Germany).
Reverse transcription quantitative PCR (RT-qPCR) analysis
About 1 μg of RNA was utilized with the reverse transcription premixed kit (Accurate Biology, Changsha, China) to generate cDNAs. RT-qPCR was performed in a final volume of 20 μL using 2 × Pro Taq HS Probe Premix II (Accurate Biology, Changsha, China) on PCR system (Agilent Technologies, California, USA). Using the 2−ΔΔCt method to calculate the relative abundance of mRNA for each gene. 30 The primer sequences can be found in Table 1. Gapdh was selected as the housekeeping gene for normalization.
Primers sequences used for RT-qPCR analyses.

Statistical analysis
SPSS 26.0 software (IBM, New York, NY, USA) was used to analyze the data, which was presented as the mean ± SD. Differences in the experiments were assessed using one-way ANOVA, and P < 0.05 was regarded as significant.
Result
Target prediction by PharmMapper
The target prediction was conducted using PharmMapper, generating a total of 369 target proteins. Subsequently, GO (Figure 1E) and KEGG (Figure 1F) enrichment analyses were performed. The analyses revealed significant enrichment in various biological processes, including the glutathione metabolic process, response to oxidative stress, oxidoreductase activity, and chemical carcinogenesis-reactive oxygen species.
Effects of YA on cell viability and GSH content of HT22 cells
As shown in Figure 2A, after exposure for 72 h, relative cell viability group were 82% ± 11%, 75% ± 5%, and 50% ± 6% in the 5, 10, and 50 μM YA groups, respectively. These results indicated that treatment with YA significantly decreased the viability of HT22 cells (P < 0.05), suggesting that YA exhibits neurotoxicity.

Cytotoxic effects of HT22 cells treated with YA. (A) The cell viability and (B) GSH content of HT22 cells following treatment with 0, 5, 10 and 50 μM YA for 72 h.
The GSH content (Figure 2B) were 50.54 ± 5.53, 46.03 ± 2.04, 43.62 ± 1.59, and 42.61 ± 0.98 in 0, 5, 10, and 50 μM YA groups respectively, indicating a concentration-dependent decrease. The exposure to YA led to a reduction in the levels of the antioxidant enzyme GSH within HT22 cells, consequently resulting in diminished free radical scavenging capacity and increased oxidative stress. In light of these results, we treated HT22 cells with 10 μM YA for 72 h and then performed mRNA-seq and MeRIP-seq to investigate the toxic mechanisms.
Differential gene expression in HT22 cells treated with YA
To elucidate the neurotoxicity mechanism associated with YA, we conducted mRNA-seq analysis on HT22 cells after treatment with 10 μM YA for 72 h. Principal component analysis (PCA) showed that YA-treated cells were in different groups from control cells, indicating notable alterations in transcriptomic expression post-treatment (Figure 3A). The screening criteria were established as fold change >1.2 or <0.83 and P < 0.05, which identified a total of 1018 differentially expressed genes (DEGs), comprising 481 upregulated genes and 537 downregulated genes (Figure 3B).

The mRNA-seq bioinformatics analysis of HT22 cells following 72 h treatment with 0 and 10 μM YA. (A) PCA for the mRNA expression in Con and YA groups. (B) The volcano plot shows the DEGs after YA treatment. (C) The GO and (D) KEGG representative enrichment results of 1018 DEGs.
By making use of the DAVID bioinformatics database, KEGG pathway and GO analyses were performed to predict the signaling pathways and biological functions linked to the DEGs. GO enrichment results mainly included DNA repair, response to oxidative stress, nervous system development, mitochondrial inner membrane, and ion channel binding (Figure 3C). Meanwhile, KEGG enrichment results mainly included cholinergic synapse, autophagy-animal, pathways in cancer, and gap junction (Figure 3D).
A heatmap representation further revealed alterations in the expression of genes linked to the cellular response to oxidative stress in HT22 cells following YA treatment, corroborating the conclusion that YA induced oxidative damage (Figure 4A). Further defining the YA treatment-related signaling pathway, we next conducted gene set enrichment analysis (GSEA). Compared with the control group, the GSEA of mitochondrial depolarization, mitochondrial electron transport cytochrome c to oxygen, mitochondrial fission, and neuron death in response to oxidative stress were activated (Figure 4B–E).
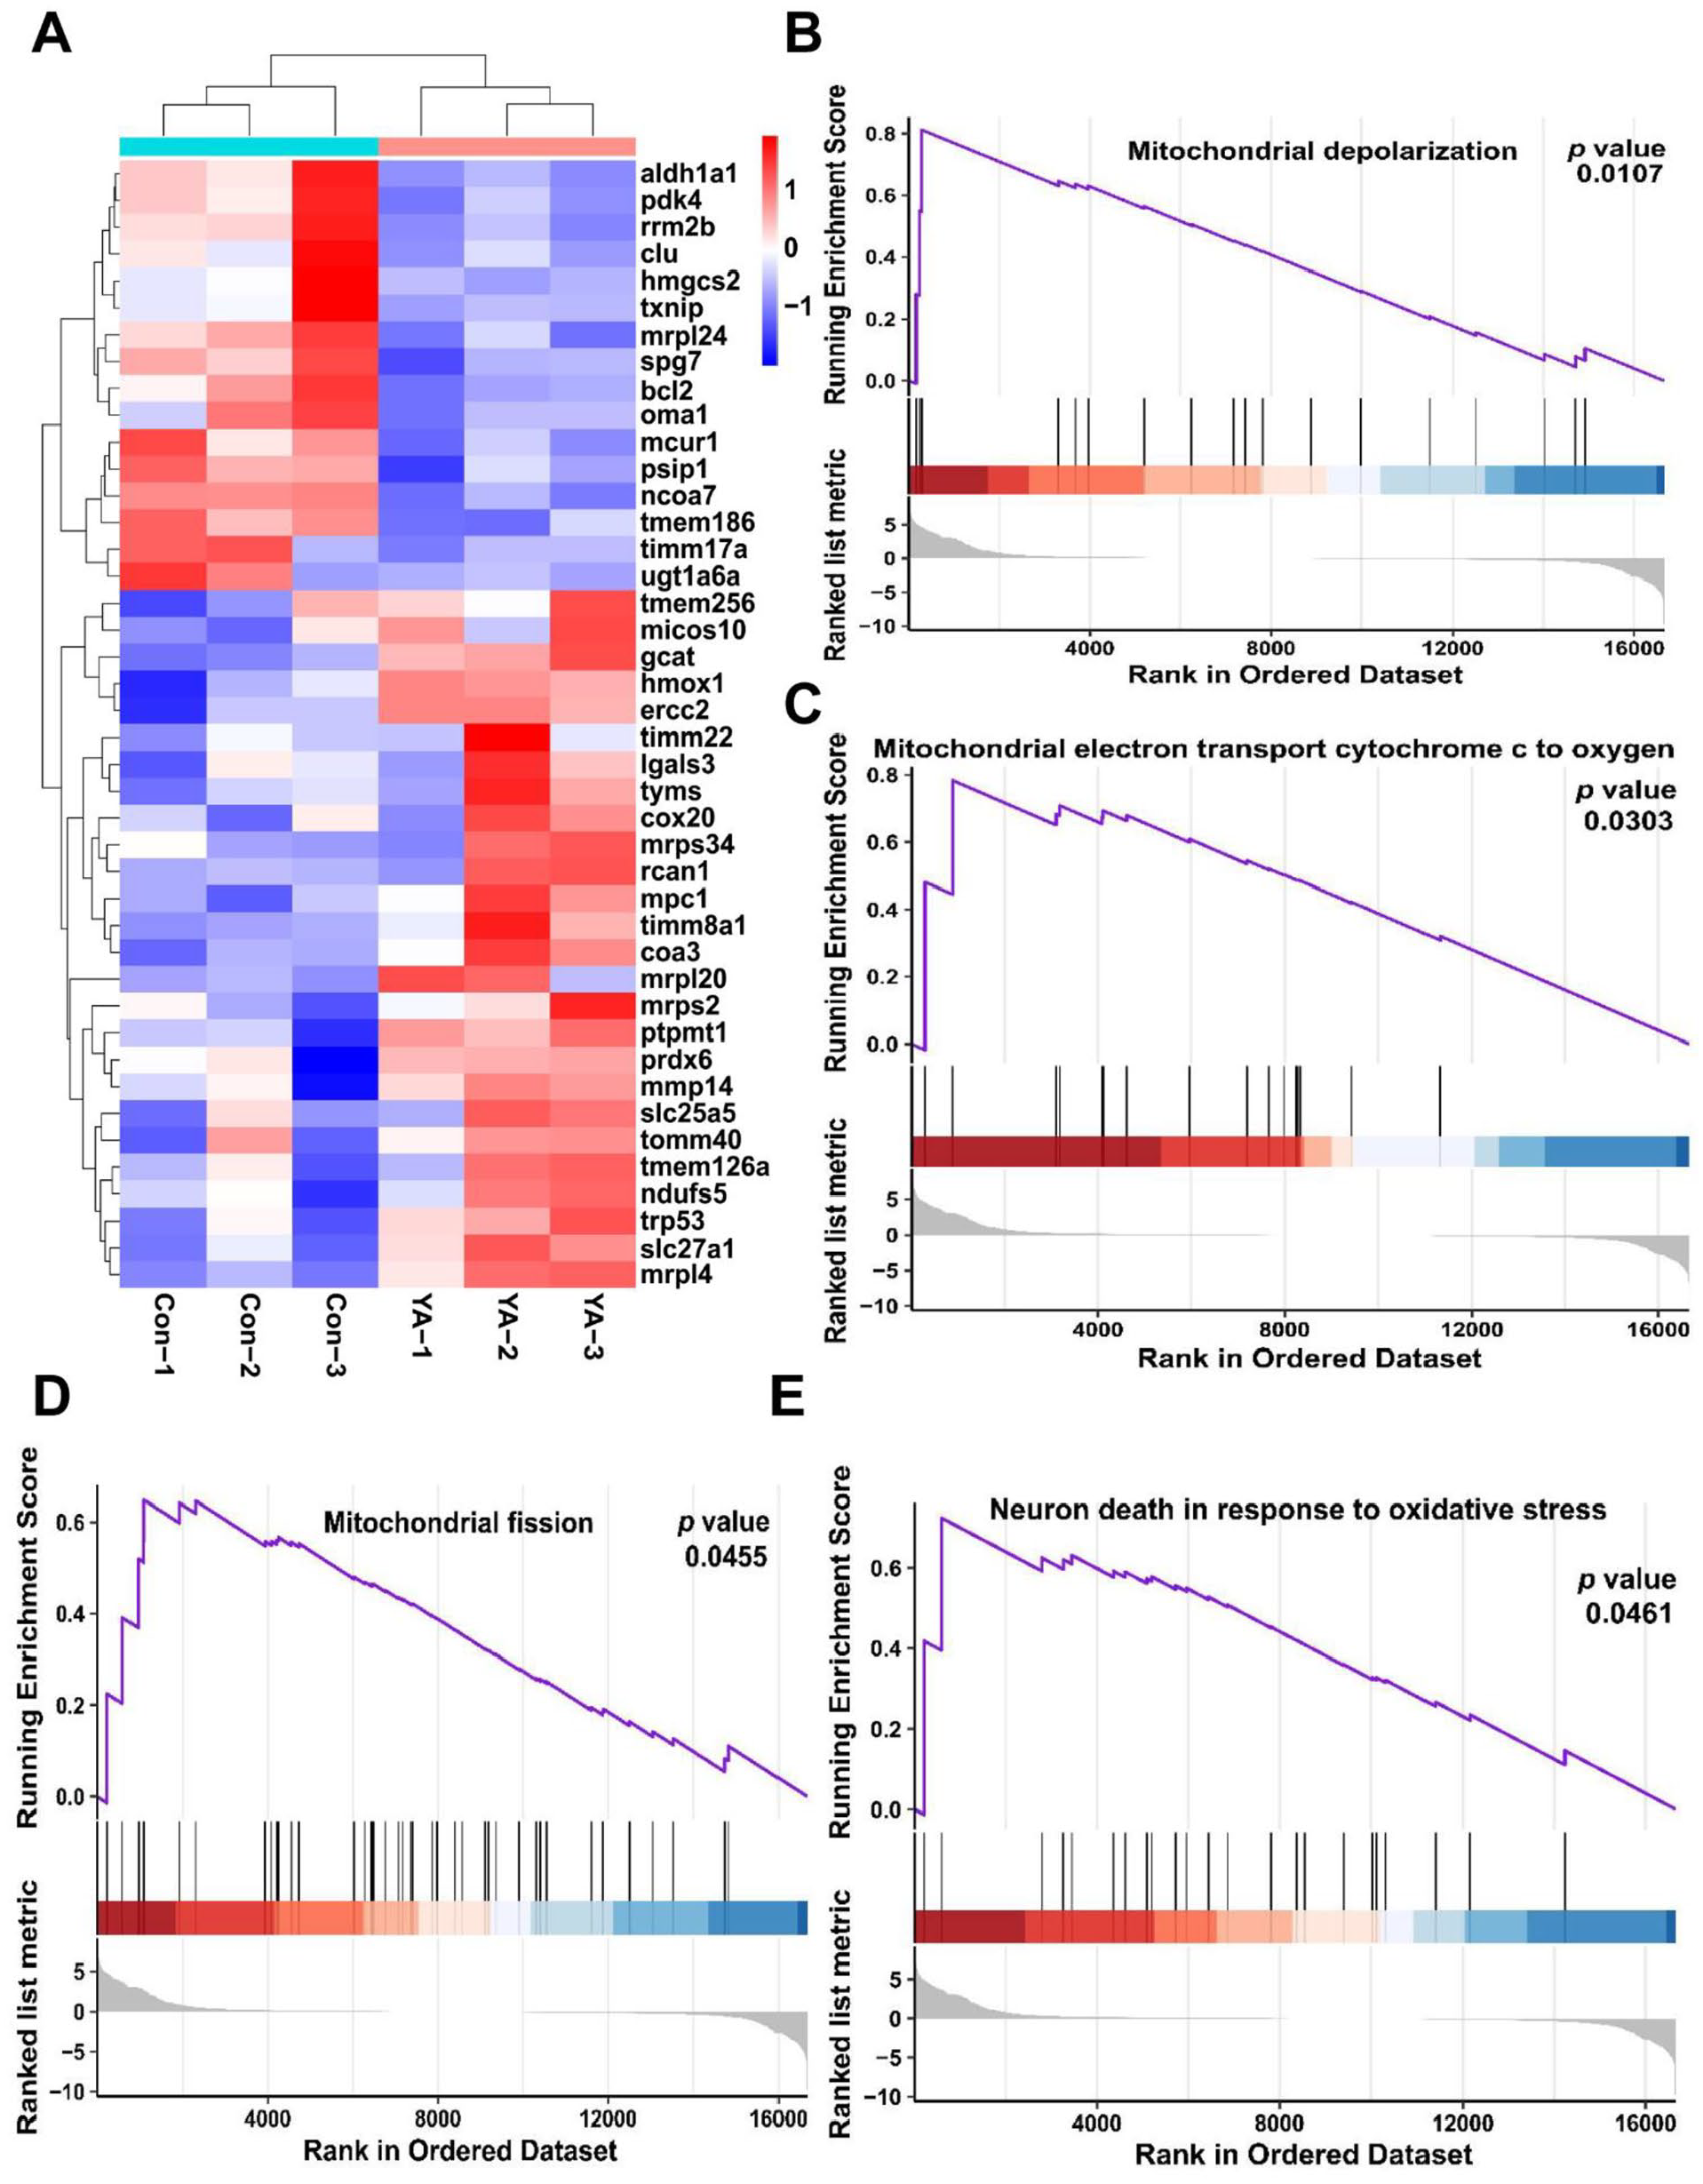
mRNA-seq analysis suggested that mitochondrial damage and oxidative stress may be the potential pathway for YA-induced neurotoxicity. (A) Heatmap of response to oxidative stress-related gene. GSEA analysis of (B) mitochondrial depolarization, (C) mitochondrial electron transport cytochrome c to oxygen, (D) mitochondrial fission, and (E) neuron death in response to oxidative stress the difference after YA treatment.
The m6A modification pattern in YA-treated HT22 cells is revealed through transcriptome-wide MeRIP-seq
Previous studies have established a link between m6A modification and the onset and progression of neurodegenerative diseases. To investigate whether YA treatment induced changes in m6A modification in HT22 cells, we conducted MeRIP-seq. In total, 6484 peaks were identified in 3665 genes in the control group, while 7914 m6A peaks were discovered in 4272m6A genes in the YA group (Figure 5A and B). STREME analysis showed that the presence of a conserved modification motif, RRACH, for both the control and YA treatment groups (Figure 5C). The distribution of m6A modifications across transcripts was non-random, with a predominant localization observed in the CDS and the 3′UTR as depicted in Figure 5D. We counted the number of modified peaks contained in each transcript. It was found that more than 3000 transcripts exhibited 1 to 2 m6A peaks in both the control and YA groups, with only a small subset of transcripts displaying more than 3 m6A modification peaks (Figure 5E).

The modification patterns of m6A in HT22 cells treated with YA. Venn diagram depicting m6A-modified genes (A) and peaks (B) between Con and YA groups. (C) The m6A motifs enriched in the Con and YA groups. (D) Distribution of m6A peaks on transcripts. (E) Distribution of m6A peaks for per gene. (F) Volcano plot depicting differentially m6A modified genes after YA treatment. (G) The GO and (H) KEGG representative enrichment results of 681 differential m6A modification genes. Analysis of Differentially m6A-modified and expressed genes of (I) m6A sites of conservative and gene (J) disease association.
Subsequently, we identified genes exhibiting differential m6A modifications post-YA treatment, using the same screening criteria applied in the mRNA-seq analysis. A total of 681 differential m6A modification genes were identified by MeRIP-seq, consisting of 130 genes with reduced and 551 genes with increased m6A modification (Figure 5F). The GO enrichment results of differential m6A modification genes predominantly included cellular response to DNA damage stimulus, macroautophagy, mitochondrion, and channel binding (Figure 5G). The KEGG enrichment results of differential m6A modification genes mainly included neurotrophin signaling pathway, cellular senescence, and adherens junction (Figure 5H). The result of ConsRM analysis depicted that 98.3% of m6A-modified regions were nonconservative in differential m6A modification genes and DEGs (Figure 5I). Furthermore, RMDisease analysis suggested that 5.5% m6A peaks and 4.5% of m6A genes had a connection with diseases (Figure 5J).
Differential m6A modification and gene expression in YA treated HT22 cells
To further explore the regulation of gene expression changes following YA treatment by m6A modification, we analyzed the overlapping genes exhibiting differential m6A modifications alongside changes in gene expression, as determined by MeRIP-seq and mRNA-seq data. Results showed that 35 genes and 5 genes were upregulated and downregulated after YA treatment respectively, accompanied by enhanced m6A modification. Additionally, 3 genes were upregulated and 4 genes were downregulated, accompanied by a decrease in m6A modification (Figure 6A).

Differential m6A modification and gene expression in HT22 cells treated with YA. (A) Venn diagram illustrating the differentially m6A-modified and expressed genes between control and YA-treated cells. The degree of m6A modification on (B) Trp53, (C) Slc25a5, (D) Atg9a, and (E) Ercc2 mRNA transcripts as visualized through IGV.
Particularly notable was the increased m6A modification observed in the oxidative stress-responsive gene Trp53, mitochondrial inner membrane-related gene Slc25a5, autophagy-related gene Atg9a, and DNA repair-related gene Ercc2 following YA treatment (Figure 6B–E).
YA had a stable interaction with differentially expressed m6A regulators
The changes in mRNA expression of m6A regulatory factors were analyzed through mRNA-seq data to identify potential regulatory factors. As depicted in Table 2, writers METTL14 and VIRMA were significantly decreased, readers YTHDF2, IGF2BP1, YTHDF1, IGF2BP2, and IGF2BP3 were notably increased. Genes related to the response to oxidative stress, mitochondrial inner membrane, autophagy, and DNA repair from GO and KEGG enrichment results of DEGs were collected. Then, we performed the PPI analysis for these genes and m6A regulators. The top 3 genes in response to oxidative stress, namely BCL2, TRP53, and APOE, exhibited degrees of 18, 18, and 9 respectively (Figure 7A). The top 3 genes in mitochondrial inner membrane, namely NDUFS5, TIMM17A, and SLC25A5, exhibited degrees of 17, 17, and 16 respectively (Figure 7B). The leading 3 genes in autophagy, namely BCL2, ATG13, and ATG9A, exhibited degrees of 21, 13, and 13 respectively (Figure 7C). The top 3 genes in DNA repair, namely ATM, PRKDC, and RAD51C, exhibited degrees of 26, 23, and 20 respectively (Figure 7D).
The mRNA expression levels of m6A regulators in YA-treated HT22 cells.


Potential m6A regulators of DEGs. The protein-protein interaction network of m6A regulators and (A) response to oxidative stress, (B) mitochondrial inner membrane, (C) autophagy, and (D) DNA repair. (E) The impact of m6A regulators on the DEGs within response to oxidative stress, mitochondrial inner membrane, autophagy, and DNA repair. (F) The mRNA expression levels of Ythdf2 and Igf2bp2 by RT-qPCR.
To further investigate the targeted substrates of the identified m6A regulators, METTL14, VIRMA, YTHDF2, IGF2BP1, YTHDF1, IGF2BP2, and IGF2BP3 were selected, as well as genes associated with the response to oxidative stress, mitochondrial inner membrane, autophagy, and DNA repair. The results suggested that both YTHDF2 and IGF2BP2 were widely implicated in the regulation of above genes (Figure 7E). The results of mRNA-seq showed that Ythdf2 and Igf2bp2 were up-regulated (Table 2) after YA treatment, which was confirmed by RT-qPCR (Figure 7F).
To investigate the potential molecular targets of YA, we assessed the molecular interactions between YA and differentially expressed regulators of m6A modification, including METTL14, VIRMA, YTHDF1, YTHDF2, IGF2BP1, IGFBP2, and IGFBP3. The basic information of proteins, along with their docking score results with YA, was presented in Table 3. The interaction scores between METTL14, VIRMA, YTHDF1, YTHDF2, IGF2BP1, IGFBP2, and IGFBP3 with YA were 7.5911, 7.9502, 5.5468, 6.6171, 1.4030, 7.1542, and 7.4786, respectively. Figure 8A to F presents the interaction diagrams. These results showed that METTL14, VIRMA, YTHDF1, YTHDF2, IGFBP2, and IGFBP3 interacted stably with YA, suggesting that they were potential targets of YA.
Molecular interactions between YA and m6A regulators.


Molecular interactions between YA and m6A regulators. (A) IGF2BP2, (B) IGF2BP3, (C) METTL14, (D) VIRMA, (E) YTHDF1, and (F) YTHDF2.
YA induced mitochondrial damage and oxidative stress
We discovered that the exposure to YA could influence mitochondria quality and redox balance in the results of mRNA-seq. Mitochondrial damage induced by YA in HT22 cells was evaluated through the decrease in MMP. As shown in Figure 9A, the ratio of red and green fluorescence of JC-10 significantly decreased from 1.98 ± 0.15 in the control group to 0.79 ± 0.01 in the 50 μM YA group (P < 0.05). This reduction indicates that YA treatment led to a decline in MMP, thereby causing mitochondrial damage in HT22 cells.

The adverse effects of YA treatment on mitochondrial and redox balance. (A) Representative fluorescence images of HT22 cells treated with YA show MMP change as measured with JC-10 probe. Scale bar, 50 μm. (B) Statistical analysis of red/green fluorescence intensity ratio in each group. (C) The influence of YA on the mRNA level of oxidation-related genes.
To assess the impact of YA on the antioxidant ability of HT22 cells, we analyzed the expression of antioxidant-related genes, including HO-1, Sod2, and Sod3. As shown in Figure 9B, the mRNA expression of HO-1 suppressed by 19.5% in the 5 μM YA group (P < 0.05). In the 10 μM YA group, the mRNA expressions of HO-1 and Sod3 decreased to 72.4% (P < 0.01) and 72.1% (P < 0.05) of that in the control group, respectively. Notably, the relative mRNA expression of HO-1, Sod2, and Sod3 in the 50 μM YA group were reduced to 70.6% (P < 0.01), 57.6% (P < 0.05), and 37.3% (P < 0.001), respectively, compared with the control group. These findings collectively suggested that YA triggered mitochondrial dysfunction and oxidative stress, potentially causing cellular damage in HT22 cells.
Discussion
Previous research has demonstrated that YA can induce neurotoxicity, as evidenced by neuronal shrinkage and degeneration observed in the cerebral cortex and hippocampus of rats subjected to YA treatment. 31 In present study, HT22 cells viability was notably suppressed with 5, 10, and 50 μM YA treatment for 72 h incubation. Furthermore, we measured the levels of GSH and discovered a reduction after YA exposure, suggesting that YA causes a redox imbalance. The above results showed that YA has nerve cell toxicity.
To further elucidate the mechanisms underlying neurotoxicity in HT22 cells treated with YA, we conducted mRNA-seq. The GO and KEGG pathway enrichment results showed that the main item affected were response to oxidative stress, mitochondrial inner membrane, and DNA repair. This result indicated that YA treatment caused mitochondrial damage and redox imbalance in HT22 cells. Studies have shown that oxidative stress causes a decrease in MMP, leading to mitochondrial dysfunction and ultimately cell death. 32 In this study, the JC-10 probe was employed to detect MMP in HT22 cells following treatment with YA. Our result showed that YA treatment resulted in a decrease in MMP, indicating mitochondrial damage caused by YA. Additionally, qPCR analysis revealed that YA treatment significantly inhibited the expression of antioxidant-related genes, corroborating the results obtained from mRNA-seq.
The most prevalent chemical modifications in eukaryotic mRNAs are m6A methylation. 33 Numerous studies have shown that traditional Chinese medicine can have an impact on m6A methylation. For instance, treatment of zebrafish hepatocytes with 25 µM berberine for 6 h led to alterations in the m6A RNA methylation of the Camk1db gene, thereby regulating cellular oxidative stress and cell death. 34 Additionally, the MeRIP-seq results of HSC-LX2 cells treated with 10 μM dihydroartemisinin for 24 h suggested that dihydroartemisinin induced cell death via FTO-mediated m6A methylation of the BECN1 gene. 35 Our study demonstrated that YA could alter the intracellular m6A RNA methylation level and concurrently modify the mRNA expression level of antioxidant genes, thereby triggering mitochondrial damage and subsequently inducing cell death. Previous studies suggested m6A modify involved in regulating oxidative stress. For instance, in a colistin-treated mouse renal tubular epithelial cell model, overexpression of METTL3 was shown to mitigate colistin-induced oxidative stress and apoptosis. 36 To further explore the impacts of YA on m6A methylation in HT22 cells, we employed MeRIP-seq. The enrichment analysis of differential m6A modification genes reported terms of cellular response to DNA damage stimulus, macroautophagy, mitochondrion, and cellular senescence. Moreover, the m6A modification of response to oxidative stress-related gene Trp53, mitochondrial inner membrane-related gene Slc25a5, autophagy-related gene Atg9a, and DNA repair-related gene Ercc2 increased after treatment with YA.
The regulation of m6A methylation necessitates the coordinated action of readers, writers, and erasers. 37 Among these regulatory proteins, the reader IGF2BP2 plays a crucial role in stabilizing mRNA through interactions with various cofactors. 38 Additionally, the expression levels of IGF2BP2 are maintained at baseline levels in healthy tissues but are elevated in numerous disease states. 39 It has been found that the average axon length of adult dorsal root ganglion (DRG) neurons overexpressing IGF2BP2 is significantly reduced, and IGF2BP2 overexpression significantly inhibited the regeneration of neuronal axons in the DRG under injury conditions. 40 In our study, we investigated the effects of YA treatment on HT22 cells and observed a significant upregulation of IGF2BP2 expression. This upregulation is implicated in the regulation of genes related to response to oxidative stress, DNA repair, mitochondrial inner membrane, and autophagy. These findings revealed that the potential role of IGF2BP2 in mediating the cellular toxic effects of YA, suggesting significant directions for further research on the mechanisms of neurotoxicity.
This study concentrated on high-throughput sequencing and in vitro cell experiments, making it impossible to explore the interaction between drug compounds and the complex in vivo environment. Thus, inferring the reaction of drug compounds in the in vivo setting based on the outcomes of in vitro studies is restricted. However, despite this limitation, in vitro studies remain a critical link in the investigation of the mechanism of toxicity. In forthcoming studies, we will employ Caenorhabditis elegans and mouse animal models to validate our discoveries regarding HT22 cells treated with YA.
Conclusion
In this study, YA disrupted the m6A modification level of antioxidant-related genes and reduced their mRNA expression level, ultimately inducing neurotoxicity. This study offers evidence regarding the neurotoxic effects of YA and a possible m6A epigenetic regulation mechanism for mRNA.
Footnotes
Acknowledgements
We are grateful to the staff of Seqhealth for their assistance in building the sequencing library during this research work.
Author Contributions
Beian Lin and Jian Zhang: Writing–original draft, Investigation, Formal analysis. Mengting Chen, Xinyue Gao, and Jiaxin Wen: Methodology, Software, Data curation. Kun Tian, Yajiao Wu: Methodology, Formal analysis. Zekai Chen, Qiaomei Yang: Visualization, Methodology. An Zhu and Chunhong Du: Writing – review & editing, Conceptualization, Supervision, Project administration, Funding acquisition. The authors have read and approved the manuscript.
Funding:
The author(s) disclosed receipt of the following financial support for the research, authorship, and/or publication of this article: This research was funded by the National Natural Science Foundation of China (82104520), Natural Science Foundation of Fujian Province (2021J05045), and Fujian Medical University High-level Talent Research Startup Funding Project (XRCZX2020014).
Declaration of Conflicting Interests:
The author(s) declared no potential conflicts of interest with respect to the research, authorship, and/or publication of this article.
Data Availability Statement
The data and the material supporting this paper are available from the corresponding author upon request.