
Abstract
Gout is a prevalent chronic inflammatory disease that affects the life of tens of millions of people worldwide, and it typically presents as gout arthritis, gout stone, or even kidney damage. Research has revealed its connection with the gut microbiome, although exact mechanism is still unclear. Studies have shown the decline of microbiome diversity in gout patients and change of microbiome compositions between the gout patients and healthy controls. Nevertheless, how diversity changes across host individuals at a cohort (population) level has not been investigated to the best of our knowledge. Here we apply the diversity-area relationship (DAR), which is an extension to the classic SAR (species-area relationship) and establishes the power-function model between microbiome diversity and the number of individuals within cohort, to comparatively investigate diversity scaling (changes) of gut microbiome in gout patients and healthy controls. The DAR modeling with a study involving 83 subjects (41 gout patients) revealed that the potential number of microbial species in gout patients is only 70% of that in the healthy control (2790 vs 3900) although the difference may not be statistically significant. The other DAR parameters including diversity scaling and similarity parameters did not show statistically significant differences. We postulate that the high resilience of gut microbiome may explain the lack of significant gout-disease effects on gut microbial diversity at the population level. The lack of statistically significant difference between the gout patients and healthy controls at host population (cohort) level is different from the previous findings at individual level in the existing literature.
Keywords
Introduction
Gout is a prevalent chronic inflammatory disease, which typically presents as gout arthritis, gout stone, or even kidney damage. In many parts of the world, especially in developed countries, the rising incidence of gout is becoming a serious public health burden of comorbidities. Gout is caused by monosodium urate crystal deposition, which has been suggested associated with elevated serum urate level (the hyperuricemia). The disorder of purine metabolism and altered urate transport in the gut and kidneys can lead to hyperuricemia. 1 Gout is strongly associated with various metabolic diseases, including hypertension, hyperlipidemia, atherosclerosis, obesity, chronic kidney disease, insulin resistance, and cardiovascular disease. 2 As a complex phenotype, the incidence and development of gout involve many risk factors, such as inherited genetic variants, dietary, age, and sex.3-6 In the last decade and so, the prevalence of gout is increasing and has become the most common inflammatory arthritis in adults in many places of the world.4,7-9
Anti-inflammatory and urate-lowering are two major strategies for gout therapies. The former strategy is the acute therapy whose target is to directly suppress inflammation. Therapies based on this strategy include the use of colchicine, nonsteroidal anti-inflammatory drugs, and corticosteroids, as well as blocking interleukin-1β (IL-1β), which is a key cytokine driving the inflammation of acute gout.10,11 There are three main approaches to reduce the urate (the second strategy): inhibiting urate production by inhibiting xanthine oxidase, promoting the excretion of uric acid (uricosuric), and promoting urate dissolution by using Pegloticase, which is a mammalian recombinant uricase.10,11
The human gut microbiome plays a critical role in metabolism, immune defense, and behavior and the dysbiosis of the gut microbiome has been found to be associated with many metabolism diseases including obesity and type II diabetes, and gout. Indeed, it has been postulated that gut microbiome dysbiosis is associated with disorders in uric acid excretion, purine metabolism, and inflammatory responses. Some gut microbial metabolites, such as short-chain fatty acid, have been found to have anti-inflammatory effects.12,13 Short-chain fatty acids are necessary for adequate inflammasome assembly and IL-1b production, which play important roles in acute inflammatory responses. 14 For example, with germ-free mice experiment, Vieira et al 14 demonstrated a lowered production of short-chain fatty acids and the lack of response to the acute inflammation caused by monosodium urate crystal. This suggested that the gut microbiota is essential for the host inflammatory responses, and participate in the development of gout. Guo et al 15 sampled and characterized the gut microbiome from 35 gout patients and 33 healthy controls. They found that there was a significant change in the gut microbiome composition in gout patients compared with healthy controls, in which Bacteroides caccae and Bacteroides xylanisolvens were increased but Faecalibacterium prausnitzii and Bifidobacterium pseudocatenulatum were decreased. 15 The change in species composition may cause the loss of some important functions such as the disorders of purine degradation and butyric acid biosynthesis, and may lead to the enrichment of opportunistic pathogens, such as Bacteroides, Porphyromonadaceae, Rhodococcus, Erysipelatoclostridium, and Anaerolineaceae.15,16
Despite the above-mentioned advances in the relationship between gut microbiome compositions (diversity) and gout, to the best of our knowledge, all existing studies on composition/diversity studies have been limited to individual-level studies. In other words, the basic scale of diversity analysis has been the individual subject, and no cohort or population level analysis has been performed. As Miller et al 17 argued that lack of consideration of scales beyond individual and ignoring of microbe dispersal are two crucial roadblocks in preventing deep understanding of the heterogeneity of the human microbiome. We concur with Miller et al 17 assessments and further argue that population (cohort) level study of the disease effects (such as gout influences) on the gut microbiome is of significant importance. For example, the population study may provide necessary foundational information for investigating the disease epidemiology and for possibly monitoring the occurrence and prevalence of diseases in pubic health domain.
In the present article, we apply the diversity-area relationship (DAR),18-23 a recent extension to the classic SAR (species-area relationship), for studying diversity scaling (changes) of gut microbiome across individuals of both gout patients and healthy controls. The classic SAR establishes the power-function relationship between the number of species (species richness) and the region area size (A) containing the species numbers, and it is well recognized as one of few classic laws in theoretical ecology. The SAR has played an important role in biodiversity conservation in practice. Given that the number of species (formally known as species richness) is a “rough” measure of biodiversity, one may wonder if the SAR also holds for a more “precise” measure of biodiversity. The more “precise” biodiversity should not only consider the number of species, but also the species abundance. This conjecture was not confirmed until a better metric system for biodiversity (the Hill numbers) was adopted for measuring biodiversity. This was because commonly used diversity metrics such as Shannon entropy and Simpson index do not fit the power-law (or log-linear) relationship of the classic SAR. Ma 18 adopted Hill numbers (that is based on Renyi’s entropy) and successfully extended the classic SAR to the general DAR (diversity-area relationship). With the DAR, the species richness (the number of species) in classic SAR is replaced by the general diversity metrics (specifically, the Hill numbers), and the extension therefore expands the application of the SAR to the general diversity scaling (change) across individuals, which allows us to investigate the population (cohort) level diversity scaling associated with gout in the case of this study.
The objective of this study is set to determine whether or not gout influences the key parameters of DAR models built for the gut microbiomes sampled from the gout patients and healthy controls, respectively. The so-termed DAR scaling parameter can then be used to decipher the microbial diversity scaling (changes) rates across host individuals within a cohort (ie, the diversity changes at the cohort or population level). Another key DAR parameter, the maximal accrual diversity (of a cohort or population), also known as the potential diversity (or dark diversity), measures the total microbial diversity of a cohort or population. Different from traditionally reported microbial diversity (eg, Guo et al 15 ), the potential diversity includes the diversity contributions of all microbial species that may be absent in some host individuals but with the potential to colonize the cohort (or population), and therefore the potential diversity is a cohort- or population-level property (parameter). Previously, Li and Ma 22 studied a similar problem with ours here by investigating 25 microbiome-associated diseases, and they found that in only approximately 1/3 of the cases, diseases led to statistically significant differences. However, their study did not include gout disease, and our study here is aimed to fill the gap.
Materials and Methods
Dataset description
The datasets of gut microbiome we reanalyzed in this study were first reported by Guo et al. 15 The stool samples were collected from 83 Chinese adults, including 41 gout patients and 42 healthy individuals. The collected stool samples were pyro-sequenced on Roche GS FLX platform to obtain 535 153 high-quality 16S-rRNA reads by amplifying the V1-V3 region. The 16S-rRNA reads were fed into the bioinformatics pipeline (QIIME V1.5), and a total of 3689 OTUs at 97% similarity level, and their abundances in the form of OTU (operational taxonomic unit) tables were obtained. Detailed information on the datasets is referred to Guo et al. 15
DAR (diversity-area relationship) power law and its extensions
DAR is an extension of the classic species-area relationship (SAR), which relates the number of species (S) accumulated within a region (ie, species richness) and the area size (A) of the region in a power function model (eg, Tjørve 24 and Plotkin et al 25 ). In the DAR, the species richness (S) is replaced with general diversity in Hill numbers, but both DAR and SAR use the same form of mathematical formulas.18,19,20-23
The process of constructing DAR models consists of the following three steps: (i) Bioinformatics analysis of 16S-rRNA data to get OTU tables26-28; (ii) Computing species or OTU diversities measured with the Hill numbers29-31; (iii) Constructing the DAR models.18,19
Diversity measured in Hill numbers
The Hill numbers, 32 initially introduced into ecology from economics to measure community evenness, are considered the most appropriate metrics for alpha-diversity,29,30,33
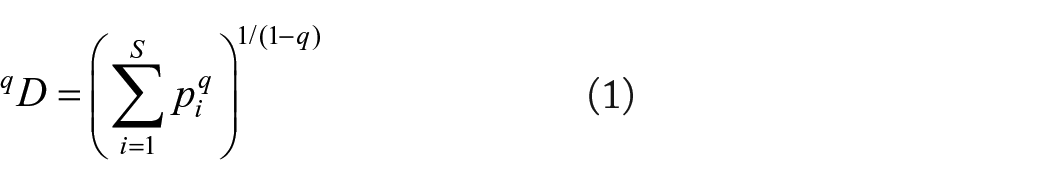
where S is the number of species, pi is the relative abundance of species i, q is the order number of diversity.
The general interpretation of qD (diversity of order q) is that the community has a diversity of order q, which is equivalent to the diversity of a community with qD = x equally abundant species. Note that a series of the Hill numbers at different order q is termed diversity profile.29,30,33
Since Hill numbers are in the unit of species or species equivalents, a community with Hill numbers of qD = x means that the community consists of x equally abundant species. This allows for the comparisons of community diversities under a unified series of positive real numbers, corresponding to the diversity orders. The series of Hill numbers are termed diversity profile, and each Hill number in the profile was weighted differently by the species abundances. For example, when q = 0, the species abundance does not weigh at all, and the Hill number is simply the number of species in the community or the species richness. When q = 1, the Hill number is weighted equally by species abundances. When q = 2, the Hill number is weighted for more by more abundant species.
The DAR (diversity-area relationship) models
Since all Hill numbers are in units of species, and in fact, they are referred to as the effective number of species or as species equivalents (eg, OTUs); intuitively, Hill numbers may be treated as “species” numbers. Following this reasoning, Ma 18 extended classic SAR (species-area relationship), which established the power-function relationship between species numbers (S) and the area (A) of a region containing the species, to Hill numbers and established so-termed DAR (diversity-area relationship):

where qD is diversity measured in Hill numbers of the q-th order, A is area, and c & z are model parameters.
The power-law with exponential cutoff (PLEC) model, originally introduced to SAR modeling by Plotkin et al 25 , Ulrich and Buszko 34 , and Tjørve 24 , is another DAR model:

where d is a parameter that should, in general, be negative in DAR scaling models. An advantage of PLEC model is that it can be utilized to estimate the so-termed potential diversity as explained below.
The following linear transformation can be used to fit the PL and PLEC models (equations (2) and (3)),


To increase the robustness of DAR modeling, 100 times of re-sampling were used to fit the DAR models and the average model parameters from the 100 times of repetitions were adopted as the final model parameters. This re-sampling procedure helps to eliminate the potential bias from arbitrarily ordering the accumulation of samples.
The diversity order stratifies diversity measures (Hill numbers) according to diversity order (q), with lower order weighted more by less abundant species and higher-order weighted more abundant species. At diversity order q = 0, species abundance does not weigh at all, and Hill numbers correspond to species richness. When q = 1, Hill numbers are weighted equally by all species; when q = 2, Hill numbers are weighted more by more abundant species; when q = 3, weighted even more by more abundant species. Therefore, Hill numbers at different orders provide a series of diversity metrics (ie, the so-termed diversity profile) for measuring diversity comprehensively. 30 Similar to the diversity profile, Ma 18 defined DAR profile as a series of DAR scaling parameter (z) corresponding to diversity order (q), that is, z-q series or pattern. It describes the change of diversity scaling parameter (z) with the diversity order (q).
Potential diversity: Predicting MAD (maximal accrual diversity) with PLEC-DAR models
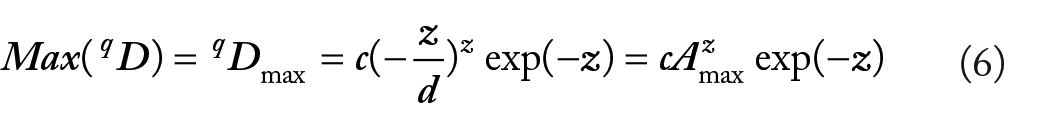
The maximal accrual diversity (MAD) in a cohort (or population) can be computed with PLEC parameters (equations (3) and (5)) according to the following formula18,20:
and the number of individuals reaching the maximum (Amax) can be estimated by
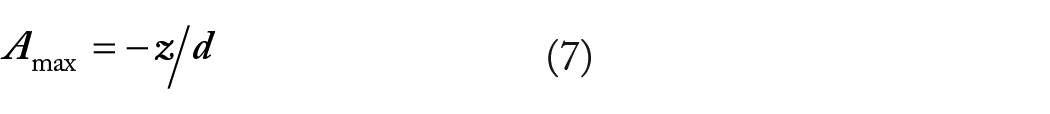
where all parameters are the same as equations (3) and (5).
The MAD profile (Dmax-q pattern) is a series of Dmax values corresponding to a series of diversity order numbers (q = 0, 1, 2, 3,. . .). MAD can be considered as potential diversity in a cohort (population) or a region. 20
Pair-wise diversity overlap (PDO) profile
The pair-wise diversity overlap (g) is defined as 18 :

where z is the scaling parameter of PL DAR model (equations (2) and (4)). If z = 1, then g = 0, there is no diversity overlap; and if z = 0, g = 1, the diversity overlap is in total. In reality, g should between 0 and 1. Given that the range of g is between 0 and 1, we may even use percentage notation to measure pair-wise diversity overlap. Similar to the previously defined diversity profile (D-q), DAR profile (z-q series), and MAD profile (Dmax-q), PDO profile refers to the series of g corresponding with q, that is, g-q series.
Results and Discussion
Table 1 exhibited the model parameters from fitting the DAR (diversity-area relationship) with the gout, healthy, and their combined datasets. The left side of Table 1 is the PL (power-law) model parameters and the right side is the PLEC (power-law with exponential cutoff) parameters. The p-values in Table 1 show that both PL and PLEC fitted all three groups of the datasets extremely significant (in most cases P < .001). The PLEC model has an advantage of being able to estimate the MAD (maximal accrual diversity) profile or Dmax, which essentially measures the accrued diversity in a population or cohort (or the so-termed potential diversity), at different diversity orders. The other two parameters from PL model, scaling parameter (z) and pair-wise diversity overlap (PDO) parameter (g) define the DAR profile and PDO profile, respectively.
Fitting the alpha-DAR models with 100 times of random permutations of the samples in each group (ie, healthy or diseased treatment).

We performed a permutation test (refer to Collingridge 35 for the permutation algorithm) for the key parameters of DAR models and the results were listed in Table 2. It turned out that, statistically, gout does not significantly influence the values of those key DAR parameters. Given the lack of significant differences between the healthy and diseased groups, to take advantage of the larger sample size, we also built DAR models with the combined datasets of gout and healthy groups. Given the lack of disease influence and the larger sample size, in the following interpretations, we use the parameters from the combined dataset for simplicity and convenience.
The permutation tests for differences in the alpha-DAR parameters between gout and healthy gut microbial communities.
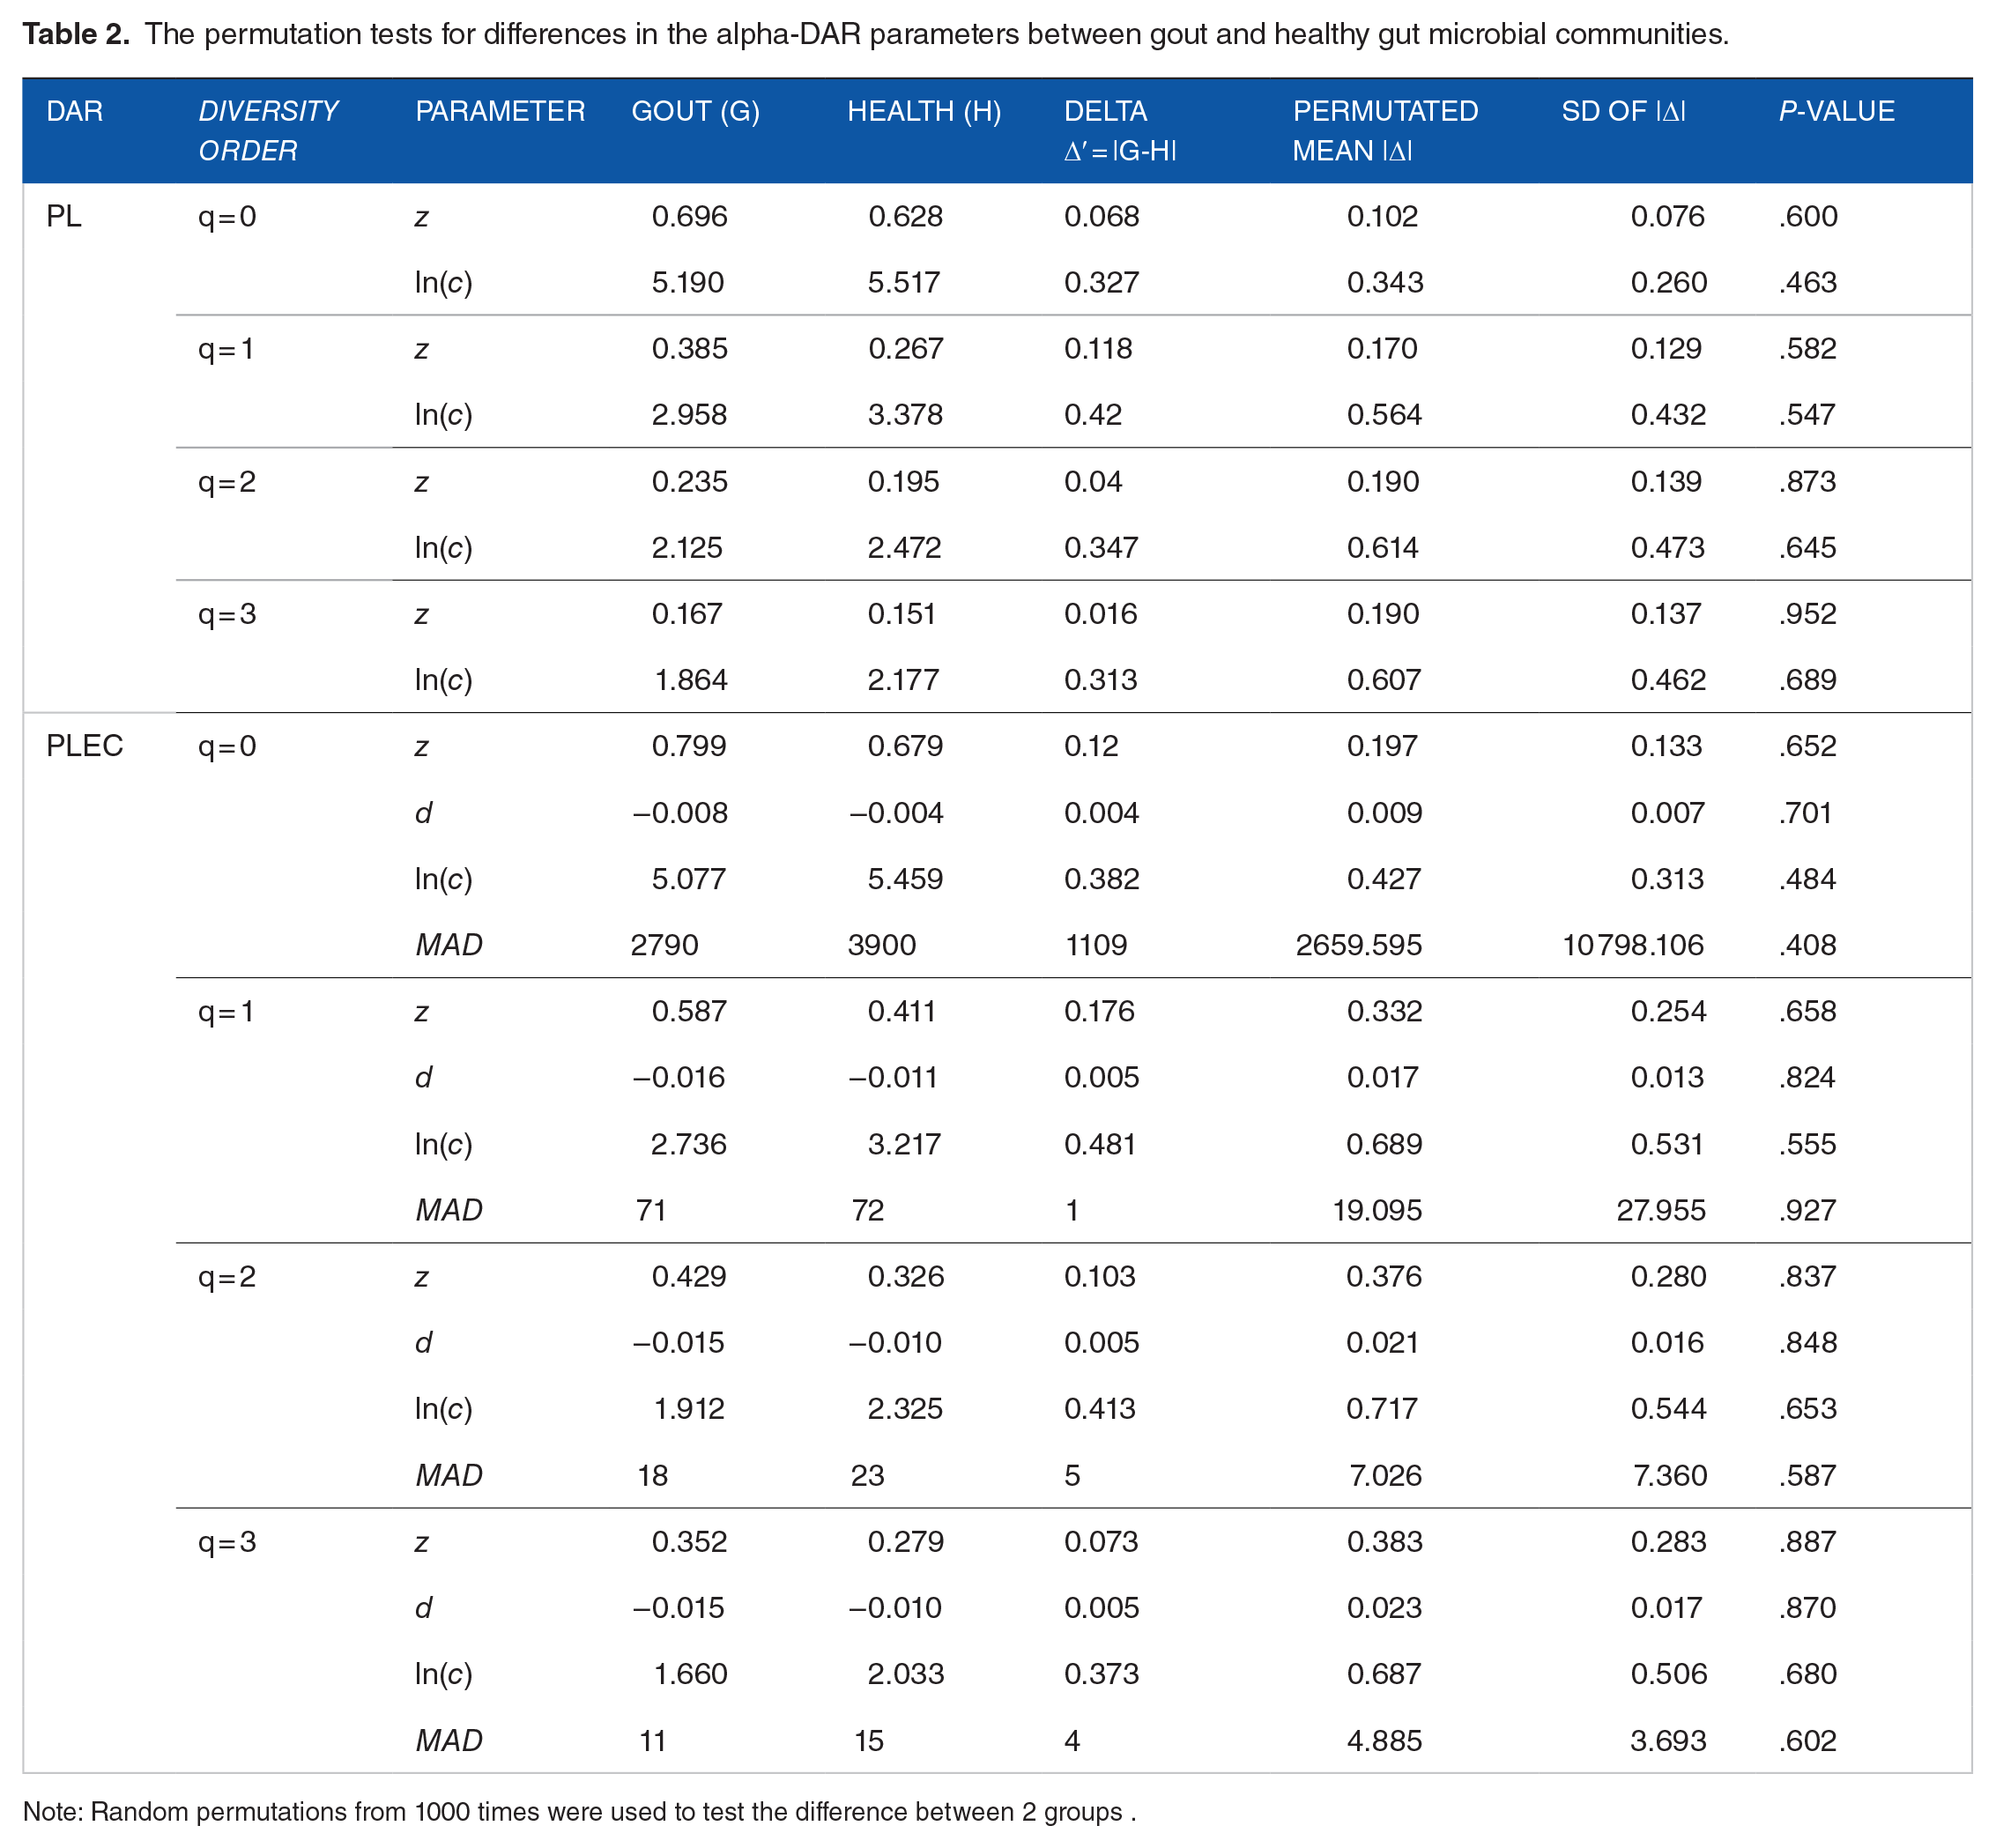
Note: Random permutations from 1000 times were used to test the difference between 2 groups .
From Table 1, we summarized the following findings:
(i) The gut microbiome diversity scaling (changes across individuals) follows the DAR model, but gout has insignificant influence on the model parameters. This suggests that the gut microbiome is rather resilient against the disturbance from gout.
(ii) The DAR profile (Figure 1): the scaling parameter (z) across the diversity order (q) from the PL model is: z-q = {0.633 [q = 0], 0.263 [q = 1], 0.155 [q = 2], 0.099 [q = 3]}, a monotonically decreasing trend with the increase of diversity order (q). This indicates that at lower diversity orders, the inter-subject heterogeneity is larger than that at higher orders. The highest heterogeneity is at the species richness level (q = 0). Since at higher diversity order, the dominant species were given more weights in computing the diversity (Hill numbers). This suggests that the humans gut microbiome are more homogenous (less heterogeneous) in terms of their dominant species. Since at lower diversity order, the rare species were given more weights in computing the diversity (Hill numbers). This suggests that the human gut microbiome is more heterogeneous in terms of rare species. In other words, people tend to be more similar in their gut microbiome composition in terms of dominant species and tend to be more dissimilar in terms of rare species. It may be the case, that we all share certain dominant species but each individual may have his or her own rare species. This should be true intuitively, but our study offers a piece of quantitative evidence to support this phenomenon.
(iii) The PDO profile (Figure 2): the parameter g-q series from the PL model is: g-q = {0.448 [q = 0], 0.796 [q = 1], 0.882 [q = 2], 0.924 [q = 3]}, a monotonically increasing trend with the increase of diversity order (q). This indicates that at lower diversity orders, the pair-wise diversity overlap (similarity) is larger than that at higher orders. The lowest diversity overlap (similarity) is at the species richness level (q = 0), and the highest similarity occurred at the diversity order q = 3. This finding further supports the finding revealed by the DAR profile in the previous (ii).
(iv) The MAD profile (Figure 3): the parameter Dmax-q series estimated from the PLEC model is: Dmax-q ={5040 [q = 0], 83.1 [q = 1], 22.0 [q = 2], 13.3 [q = 3]}, showing a monotonically decreasing population potential diversity (Dmax) with the increase of diversity order (q). This, of course, is determined by the nature of the diversity (Hill numbers) and MAD.
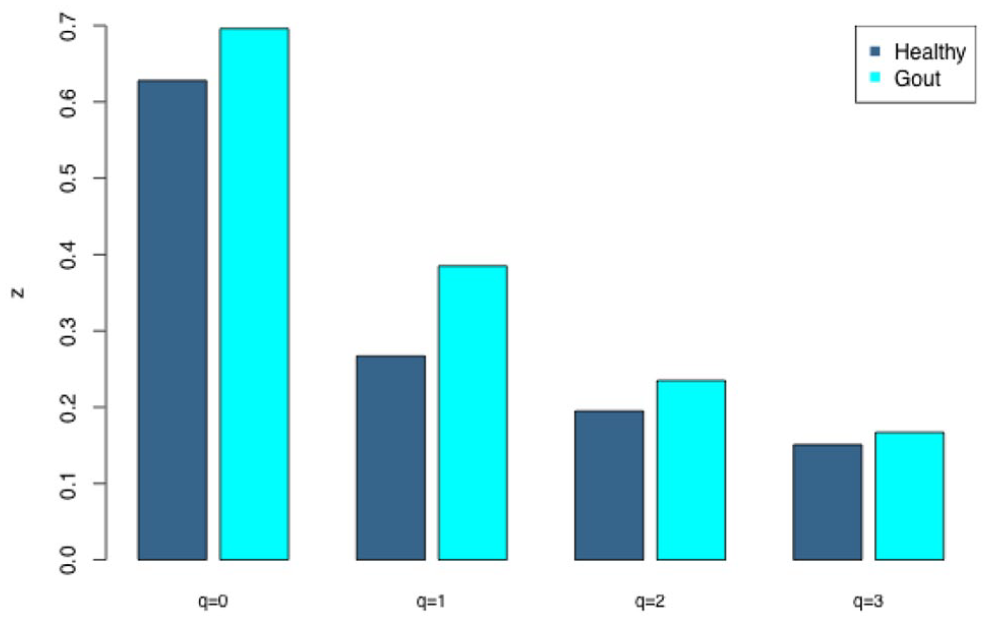
The DAR profile (z-q) for the healthy and gout groups, where z is the DAR scaling parameter and q is the diversity order.

The PDO profile (pair-wise diversity overlap) (g-q) for the healthy and gout groups, where g is the pair-wise diversity overlap (similarity) parameter and q is the diversity order.
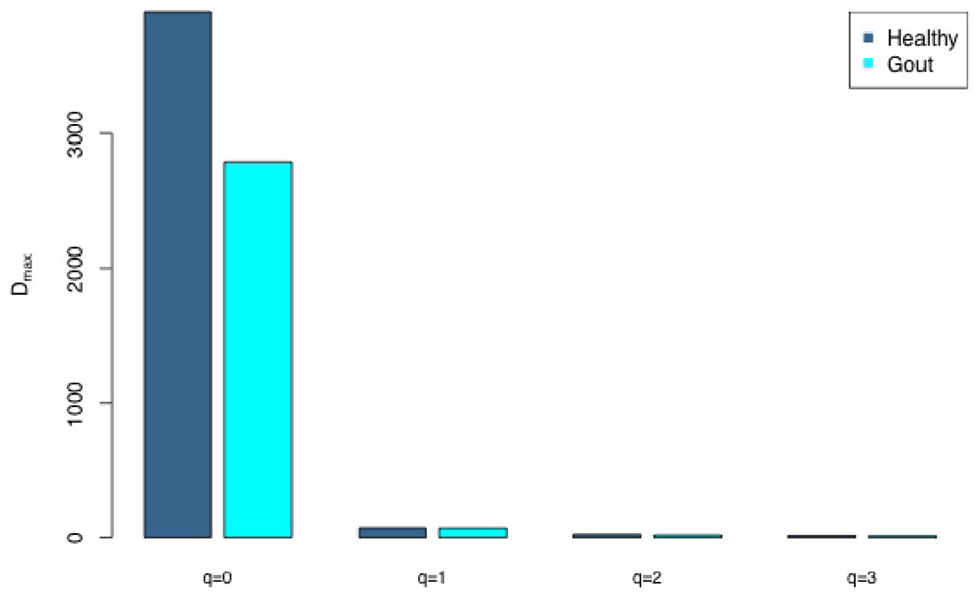
The MAD profile (maximal accrual diversity) (Dmax-q) for the healthy and gout groups, where Dmax is the maximal accrual diversity (MAD) and q is the diversity order.
The Dmax(0) = 5040 is simply the maximal accrual of species richness since the Hill numbers at q = 0 are the species richness. In other words, this is the expected maximum of species richness in the cohort of the population potential species richness. The term population here means the population of microbiome hosts (individual subjects).
At diversity order q = 1, the Hill numbers are equivalent to an exponential function of Shannon diversity index. It represents the number of species in terms of “common species” or species with a typical abundance level. Dmax(1) = 83.1 suggests that there are potentially 83 commonly observed bacterial species in the human gut microbiome. Dmax(2) = 22 suggests that there are potentially 22 dominant species in the human gut microbiome. Similar interpretations can be made for q = 3.
As reported in Guo et al, 15 they obtained 3689 species (OTUs at 97% similarity level) from the whole sequencing experiment, this number is approximately 900 more than the maximal accrual species richness in our DAR model for the gout disease group estimated [Gout treatment: Dmax(0) = 2790, Table 1] and is 210 less than the number our DAR model estimated for the healthy treatment [Healthy treatment: Dmax(0) = 3900, Table 1]. This finding suggests that gout disease may lead to a decrease in species richness. The difference between the Dmax for the healthy control and gout group is 3900−2790 = 1100, which is approximately 30% decline compared with the healthy control and 40% decline with the gout group. Although the statistical test (Table 2) did not support the significance level of the difference, we believe that the 30-40% difference between the healthy control and gout group is remarkable and worthy of further investigation.
While the statistical tests of the DAR parameters (Table 2) did not reveal significant differences between the healthy control and gout groups, we also computed the diversity of the healthy and gout groups (Table 3) and conducted statistical tests to compare their differences in the alpha-diversity (Hill numbers) (Table 4). Table 4 shows that there are significant differences between the healthy and gout groups in terms of the alpha-diversity (Hill numbers) per se. Then, why did not the DAR parameters show similar differences?
The mean and standard error of the alpha diversity (Hill numbers).

The p-values from Wilcoxon tests for the alpha diversity between the healthy control and gout group.

There are two possible explanations for the lack of differences in the DAR parameters between the healthy and gout groups. One is the stability (resilience) of the gut microbiome ecosystem, which can be sufficiently strong to resist the changes due to gout. Another is the difference between the diversity per se and the scaling of diversity (DAR). Using an analogy in physics, the relationship between diversity and diversity scaling parameter (z of DAR) is similar to that between gravity and the gravitational coefficient (which is g = 9.8 can be considered as a constant on the earth). The gravitational coefficient is essentially the acceleration rate of gravity, that is, the scaling (change) rate of gravity. Therefore, it can be the case that the gut microbiome has its characteristic diversity scaling parameter (z) or DAR profile (z-q series), just as the earth has its constant gravitational coefficient. Therefore, although we do not necessarily believe that the gut must have a constant diversity scaling parameter, we should not be surprised that the gut microbiome diversity scaling parameters were not influenced significantly by gout.
Li and Ma 22 found that in only approximately 1/3 of the studied cases, there were statistically significant differences between the healthy and diseased treatments in the DAR parameters. However, their study did not include the case study of gout-associated microbiomes, and our results here add another negative case of “no significant disease effects.” Still, we caution that further studies with larger datasets will be extremely helpful to validate or reject our findings. Finally, it should be noted that the findings from this study are not directly comparable with those reported originally by Guo et al, 15 even though both articles analyzed the same datasets and both analyzed microbial diversity. This is because our diversity analysis is performed with the DAR modeling approach18-20,22 at the host cohort (population level), while the diversity analysis conducted by Guo et al 15 adopted a standard, individual-level, alpha-diversity indexes such as Shannon entropy.
Conclusions
This study aims to investigate the diversity scaling of the gut microbiome under the influence of gout, and it was found that the potential number of microbial species in the cohort of gout patients is only 70% of that in the cohort of the healthy control (2790 vs 3900), although the difference may not be statistically significant. We postulate that, although the influence of gout on diversity measured in Hill numbers may not be statistically significant, the 30% difference in species numbers suggests that there may be a significant change in species composition associated with gout. In other words, the identities of some species may be changed in association with the disease, and the potential reduction of unique species numbers associated with gout can be as many as 1100 or 30%. Furthermore, the diversity scaling parameter in gout patients is apparently larger than in the healthy controls, although the difference is again statistically insignificant. We hypothesize that the high resilience of the gut microbiome explains the lack of significant disease effects on the key DAR parameters such as the potential diversity and diversity scaling parameters. In perspective, our findings can be of important public health significance for preventing and/or managing gout through regulating the gut microbiome at the host population level.
Footnotes
Funding:
The author(s) disclosed receipt of the following financial support for the research, authorship, and/or publication of this article: This research received funding from the following sources: the State Key Laboratory of Genetic Resources and Evolution (#GREKF21-06, #GREKF20-06, #GREKF19-07) and Yunnan Province Local University (Part) Basic Research for Youths (#2019FH001-117, #202001BA070001-100, and 202101BA070001-018). National Science Foundation of China (Grant #12161033). The Yunnan provincial department of education scientific research fund project (#2022J0896).
Declaration of Conflicting Interests:
The author declared no potential conflicts of interest with respect to the research, authorship, and/or publication of this article.
Author Contributions
JSZ, WS, and HJC and conceived the study, YLY, PLX, BY, and HJC performed the data analysis, HJC, YLY, WS, JSZ, BY, and PLX wrote and revised the manuscript. All authors approved the submission.
Ethics Approval and Consent to Participate
N/A since the data is already published and is available in the public domain. Therefore, no human subjects are involved in the study, and no methods or protocols need special approval.