
Abstract
Green turtles (Chelonia mydas) have a hindgut fermentation digestive tract, which uses cellulolytic microbes to break down plant matter in the cecum and proximal colon. Previous studies on bacterial communities of green turtles have not identified in situ hindgut microbiota, and never before in Hawaiian green turtles, which comprise an isolated metapopulation. Fresh samples using sterile swabs were taken from five locations along the gastrointestinal tracts of eight green turtles that had required euthanization. Bacteria were cultured, aerobically and anaerobically, on nutrient agar and four differential and selective media. Samples at three sections along the gastrointestinal tracts of two green turtles were analyzed using 16S metagenomics on an Ion Torrent Personal Genome Machine. More than half of the 4 532 104 sequences belonged to the phylum Firmicutes, followed by Bacteroidetes and Proteobacteria, which are characteristic of herbivore gut microbiota. Some microbiota variation existed between turtles and among gastrointestinal sections. The 16S sequence analysis provided a better representation of the total gastrointestinal bacterial community, much of which cannot be cultured using traditional microbial techniques. These metagenomic analyses serve as a foundation for a better understanding of the microbiome of green turtles in the Hawaiian Islands and elsewhere.
Introduction
Green turtles (Chelonia mydas), the largest marine herbivores in the Hawaiian Islands, are known to consume more than 300 species of marine macroalgae, two seagrasses, at least one terrestrial shoreline grass, and the fallen leaves of a coastal tree, based on crop and stomach samples.1-7 Green turtles globally often consume both marine macroalgae and seagrasses simultaneously or sequentially.8-10 Green turtles have a hindgut fermentation digestive tract, which uses cellulolytic microbes to break down plant matter in the cecum and proximal colon. 11 In some foraging areas in the Hawaiian Islands, green turtles are growing at potentially reduced rates resulting in late age of reproductive maturity (30+ years) compared with the age of reproductive maturity in earlier times (mid 1970s/early 1980s).12-14 Food abundance, food quality, turtle abundance, and disease have been considered as causes for this change,12-16 but other factors may also be involved, such as inefficient digestion because of changes in gastrointestinal (GI) microbiota composition. Changes in the GI microbiome (total community of long-term resident microbes in a habitat) could be caused by short-term shifts in diet,11,17 stress, disease, and/or chemical exposure.
Cellulolytic bacteria belonging to the phyla Actinobacteria, Bacteroidetes, and Firmicutes have been found in the GI microbiota of herbivorous marine iguanas, marine fish, and manatees.18-23 In herbivorous green turtles, the aerobic bacterial flora in cloacal swabs contained 123 Gram-negative and 29 Gram-positive isolates, consisting mostly of members of the family Enterobacteriaceae (phylum Proteobacteria) and Staphylococcus species (phylum Firmicutes). 24 Similar bacterial isolates were found in the East Pacific green turtle and olive ridley cloacal fluids. 25 Cloacal and fecal samples from juvenile green turtles in the northern Gulf of Mexico showed a microbiota dominated by the phylum Proteobacteria. 26 Proteobacteria was the most abundant phylum in cloacal swabs of stranded, as well as hospitalized, and rehabilitated green turtles in Australia.27,28 In contrast, the phyla Firmicutes and Bacteroidetes were the most abundant phyla in cloacal swabs of healthy, wild green turtles from the Great Barrier Reef 27 and Brazil. 29
Despite the importance of hindgut microbiota in green turtle digestion, few studies have examined the microbiome within green turtles, and those studies have used fecal samples or cloacal swab samples, perhaps because of the difficulty of obtaining fresh samples and the complexity of maintaining bacterial cultures, especially anaerobic taxa. Previous studies of other organisms concluded that the fecal microbiome is not equivalent to the GI tract microbiome, and that fecal sampling was not adequate.30-35 However, Hong et al. 23 argued that in herbivorous reptiles, fecal microbiota suffice as good proxies of gut microbiota because of the long food retention time. We chose to use in situ sampling of the GI tract because samples taken from the cloaca and feces may be unreliable indicators of digestive system microbiota because of (1) contamination of the external surfaces of the cloaca and feces by bacteria occurring in seawater and (2) aerobic conditions in the cloaca and fecal material which may select against anaerobic bacteria. This study is the first to carry out successful, in situ GI tract sampling of digestive, hindgut microbiota of green turtles. The objective of this study was to identify the digestive, GI microbiota found in the green turtle (C. mydas) in Hawai‘i. We used traditional culture isolation techniques, as well as high-throughput sequencing of the bacterial 16S rDNA gene to achieve four goals 36 : (1) create a taxa list, (2) quantify the abundance of taxa, (3) compare microbial communities from different samples, and (4) detect potentially important community members.
Methods
Microbial collection and traditional culturing
Eight green turtles that had required euthanization by a collaborative assessment from Dr. Thierry Work, Wildlife Pathologist of the USGS (U.S. Geological Survey) and the National Marine Fisheries Service of NOAA (National Oceanic and Atmospheric Administration) after mortal injury or terminal illness, served as donors immediately postmortem for this project. 37 In view of conservation policy, as set forth by the Endangered Species Act (ESA), no attempts were made to obtain free-swimming, wild turtles. All turtles sampled had been euthanized due to fibropapillomatosis or injury from fishing line entanglement (Table 1), and all had macroalgae (mostly Rhodophyta) in the GI tract with no indication of rotting material undergoing digestion, and no H2S smell. Turtles were collected from several locations in the main Hawaiian Islands (Figure 1) and included immature males and females determined by gonad examination with curved carapace lengths of 49 to 80 cm (Table 1). Fresh gut samples were taken at five locations along the GI tract (crop, stomach, small intestine, cecum, and large intestine) by wiping a cotton sterile swab and a BD BBL Vacutainer anaerobic specimen collector (Becton, Dickinson and Company) on the areas. Swabs were placed on nutrient agar medium for transport and restreaked within 4 hours on several types of media: nutrient agar, MacConkey agar for the isolation of Enterobacteriaceae, mannitol salt agar for the isolation of Staphylococcus species, thiosulfate-citrate-bile-salts-sucrose agar for the isolation of Vibrio species, and xylose-lysine deoxychloate agar for the isolation of Salmonella and Shigella species. Plates were incubated at 30°C aerobically using a 12-140E incubator (Quincy Lab, Inc.) and examined after 24 hours; and anaerobically in a 12-140E incubator (Quincy Lab, Inc.) within a BD GasPak EZ Incubation Container (Becton, Dickinson and Company) with BD GasPak EZ Anaerobe Container System Sachets (Becton, Dickinson and Company) and examined after 24 hours. Isolated colonies were identified via Gram staining and the following biochemical reactions: indole production (Becton, Dickinson and Company; Cat. no. 261185), oxidase production (BD; Cat. no. 261181), and Voges-Proskauer A & B reagents (Becton, Dickinson and Company; Cat. no. 261192 and 261193). Identification of Gram-negative organisms was confirmed by EnteroPluri Test Kit (Becton, Dickinson and Company; Cat. no. L010570), a 12-sector system containing special culture media that permit identification of Enterobacteriaceae and other Gram-negative, oxidase-negative bacteria. Cultures were incubated at 36°C and examined after 18 hours, according to manufacturer instructions.
Information compiled from necropsy reports on turtles used for microbial culturing and 16S metagenomics sequencing.

Abbreviations: CCL, curved carapace length; GIT, gastrointestinal tract.
Body condition is based on NOAA (National Oceanic and Atmospheric Administration) and USGS (U.S. Geological Survey) qualitative determination of the degree of body fat, degree of muscle mass, and the amount of internal depot fat.

Map of geographic locations from which green turtles were collected prior to euthanization.
Tissue collection and DNA extraction
Whole GI tracts from two freshly euthanized turtles were extracted from the animals and immediately frozen at −20°C. Turtle 25338 was a 14.7 kg male with fibropapilloma (FP) tumors found at Hale‘iwa on the island of O‘ahu (whose GI tract was also sampled for microbial collection and culture described previously), and Turtle 25405 was a 13.8 kg female with no FP tumors found at Puakō on the island of Hawai‘i. Both turtles had macroalgae (mostly Rhodophyta) in the GI tract. The frozen GI tracts were transferred to a −80°C freezer.
DNA extractions were performed using the Qiagen DNA Stool Mini Kit following the manufacturer protocol (QIAGEN; Cat. no. 51504). Three sections of the GI tracts of each turtle were selected for this study: the cecum, the large intestine, and the rectum. Following extractions, the quantity and quality of each DNA eluate were ascertained using gel electrophoresis (Thermo Fisher) and spectrophotometry assay (NanoDrop ND-1000).
Microbiome amplification using 16S metagenomics methods
Each DNA sample, a positive DNA control, and a negative control were amplified through polymerase chain reaction (PCR) using the Ion 16S Metagenomics Kit (Life Technologies Corp.; Cat. no. A26212). Following PCR amplification, a solution of 70% ethanol and a 1.2× volume of Agencourt AMPure XP beads was prepared to purify the amplicons (Beckman Coulter Life Sciences; Cat. no. A63880). All purification steps involved in this protocol used a 70% solution of molecular-grade ethanol.
Determination of DNA input for library preparation and end repair
The 16S amplicons were enzymatically processed for adapter and barcode ligation using the Ion Plus Fragment Library Kit (Life Technologies Corp.; Cat. no. 4471252), and thereafter, purified with an ethanol solution and 1.4× volume of AMPure beads. Following purification, diluted (1:10) aliquots of each amplicon and the positive control were prepared and quantified on a Bioanalyzer 2100 instrument using a High-Sensitivity DNA Kit (Agilent Technologies; Cat. no 5067-4626). For each amplicon assayed, a smear analysis of its chromatogram was generated, including peaks ranging from 280 to 390 bp (base pairs), from which the total sample concentration was determined. The samples and the positive control were standardized to a concentration of 100 ng. Once standardized, amplicons were enzymatically blunt-ended and end-repaired to remove overhangs (Ion Plus Fragment Library Kit; Cat. No. 4471252). Following the end repair step, samples were purified using an ethanol solution and 1.2× volume of AMPure beads.
Ligation of adapters and barcodes and purification of adapter-ligated and nick-repaired DNA
Using the Ion Xpress Fragment Library Kit, six unique barcode adapters (Table 2) were ligated to the purified amplicons (Life Technologies Corp.; Cat. no. 4474009). Samples were prepared following manufacturer protocol, except for one minor modification, in which 1 µL of each adapter and barcode was used to avoid excess that forms dimers. Following ligation and nick repair, samples were purified using an ethanol solution and 1.4× volume of AMPure beads.
Barcode sequences from Ion Xpress Kit #17-32 (Life Technologies).

PCR amplification and bioanalyzer assay
Subsequent to ligation and nick repair, amplicons were further PCR amplified for seven cycles according to manufacturer protocol. Following amplification, samples were cleaned up with an ethanol solution and 1.0× volume of AMPure beads. Samples were diluted (1:1) and assayed on a Bioanalyzer 2100 on a high-sensitivity DNA chip. Each amplicon was smear-analyzed, including chromatogram peaks ranging from 230 to 400 bp to determine their combined concentration. Amplicons were adjusted to a molarity of 501.0 pmol/L, which reflected the lowest concentration of any sample at that point.
Quantitative PCR and determination of library concentration
As accurate determination of 16S library molecules is essential for the efficient use of next-generation sequencing platforms, amplicons were quantified using a KAPA library quantification assay designed for Ion Torrent platforms (KAPA Biosystems Inc.; Cat. no. KK4838), and the quantitative PCR (qPCR) assay was performed using a StepOne Plus instrument (Life Technologies Corp.; Cat. no. 4376600). Once each sample concentration was accurately determined by the qPCR assay results, samples were diluted accordingly, and dilutions were pulled together to form the final library to be sequenced.
Emulsion PCR and sequencing
After making a pooled, equimolar library, 400 bp (amplification) emulsion PCR (emPCR) was conducted using the Ion Personal Genome Machine (PGM) Hi-Q View OT2 Kit (Life Technologies Corp.; Cat. no. A29900). Quality of the emPCR was checked using the Ion Sphere Quality Control Kit (Life Technologies Corp.; Cat. no. 446856). The 400 bp library was assessed using the Ion Sphere Assay with a Qubit 3.0 fluorometer (Life Technologies Corp.; MAN0016388) and passed with 32.50% templated Ion Sphere Particles (ISPs). Enrichment of template-positive Ion PGM Hi-Q View ISPs was done using the Ion OneTouch ES following manufacturer protocol (Life Technologies; MAN0014579). The enriched library was then processed for DNA sequencing. The 400 bp sequencing was done on the Ion PGM using the Hi-Q View Sequencing Kit (Life Technologies Corp.; Cat. no. A30044) using an Ion Torrent 318 v2 BC chip and allowing for 850 flows of sequencing dNTPs (Life Technologies Corp.; Cat. no. 4488146).
16S metagenomics pipeline
All sequences were sorted by barcode into separate files using Torrent Suite Plugin FileExporter version 5.0.3.1 into the Ion Reporter software version 5.10.3.0. The individual sequence reads were filtered by the PGM software to remove low quality, low abundance (<10 reads), reads less than 150 bp, and polyclonal sequences. Sequences matching the PGM 3′ adaptor were also automatically trimmed. All PGM quality-approved, trimmed, and filtered data were exported into SAMtools toolkit 38 within Galaxy 39 to convert the output “.bam” files into human-readable “.fastq” files. All reads were quality checked and further trimmed using Trimmomatic 40 within Galaxy to 280 bp, and then replotted to achieve quality scores greater than 20 (crop: 280 leading: 2 trailing: 2 minlen: 50). The filtered .fastq files were exported into R version 3.6.0 using the dada2 package version 1.10.1. 41 The sequencing error rates were estimated (dada2 function learnErrors) and the filtered sequences were dereplicated (dada2 function derepFastq) to generate unique sequences. These unique sequences were then processed using the dada2 algorithm (dada2 function dada) to infer exact amplicon sequence variants (ASVs). Chimeric and nontargeted sequences were removed (dada2 function removeBimeraDenovo) and an ASV table analogous to OTU (operational taxonomic unit) tables was generated by comparing sequences to the Greengenes, Ribosomal Database Project (RDP), and NCBI (National Center for Biotechnology Information) BLAST reference sequence databases. A genus was defined at 97% sequence similarity to the database entity, and a species was defined at 99% similarity.
Species richness, family richness, Shannon-Wiener diversity (H’)
42
(equation (1)), and equitability

where S is the total number of families in the community (richness); pi is the proportion of S made up of the ith family:

Jaccard Similarity Index

where a is the number of bacterial families shared in common by both communities, b is the number of bacterial families occurring in only one of the communities, and c is the number of bacterial families occurring only in the other community
The distribution of beta diversity in the six microbial communities was explored using principal coordinate analysis (PCoA) on Bray-Curtis distance matrices; the uncertainty in PCoA plots was estimated using jackknife replicates. Rarefaction was applied by taking a random subset of reads for each sample, corresponding to the 80% of the total read number of those samples with the lowest number of reads in each data set. The PCoA axes were visualized with EMPeror 43 incorporated into the Ion Reporter software.
Results
Identification from traditional culture methods
Thirteen taxa were identified among five locations along eight GI tracts of green turtles, primarily consisting of phylum Proteobacteria (11 taxa) and two isolates from phylum Firmicutes (Table 3). The greatest number of different taxa were isolated from the small intestine (13), stomach (12), and cecum (12). Only six taxa were found in the large intestine.
Bacterial taxa identified from Gram-staining, and differential and selective media (+ = present, − = absent).

Technical efficiency and sample preparation from ion torrent sequencing data
The Ion Torrent run produced 4 532 104 DNA sequencing reads on the 318v2 chip with 60% loading after Ion Reporter filtering. After filtering through the DADA2 pipeline, there was a total of 3 590 756 DNA sequencing reads with a mean read length of 227 bp and mean number of reads per sample was 598 459.33 (Table 4). Dominant microbiota in all samples from both turtles consisted of phylum Firmicutes; Order Clostridiales; Families Clostridiaceae, Ruminococcaceae, and Lachnospiraceae; and phylum Bacteroidetes; Order Bacteroidales; Families Porphyromonadaceae and Bacteroidaceae (Figures 2 to 5). For both turtles, most of the sequences that could be identified to the species level belonged to Clostridium species (Phylum Firmicutes, Family Clostridiaceae) (Table 5). Bacteroides sp. (Phylum Bacteroidetes, Family Bacteroidaceae) comprised 1.72% to 3.35% of total sequences identified to species for all samples. Distribution of reads among the samples primarily consisted of the V3 and V6/7 hypervariable regions of the 16S gene (Figure 6). Table 6 shows differences in abundances at the phylum level for the different hypervariable regions.
Number of reads per sample after quality filtering steps in Ion Reporter.


16S rDNA operational taxonomic units (OTUs) in the three sampled sections (cecum, large intestine, and rectum) of Turtle 25338. Taxa are organized from phylum level on the innermost circle to species on the outermost circle.

16S rDNA operational taxonomic units (OTUs) in the three sampled sections (cecum, large intestine, rectum) of Turtle 25405. Taxa are organized from phylum level on the innermost circle to species on the outermost circle.

Plot of proportion of phylum abundance. Relative abundance (%) of operational taxonomic units (OTUs) separated by phylum in the cecum, large intestine, and rectum of both turtles.

Plot of proportion of family abundance. Relative abundance (%) of operational taxonomic units (OTUs) separated by families in the cecum, large intestine, and rectum of both turtles.
Relative abundance (%) of bacterial taxa sequences identified to species level.
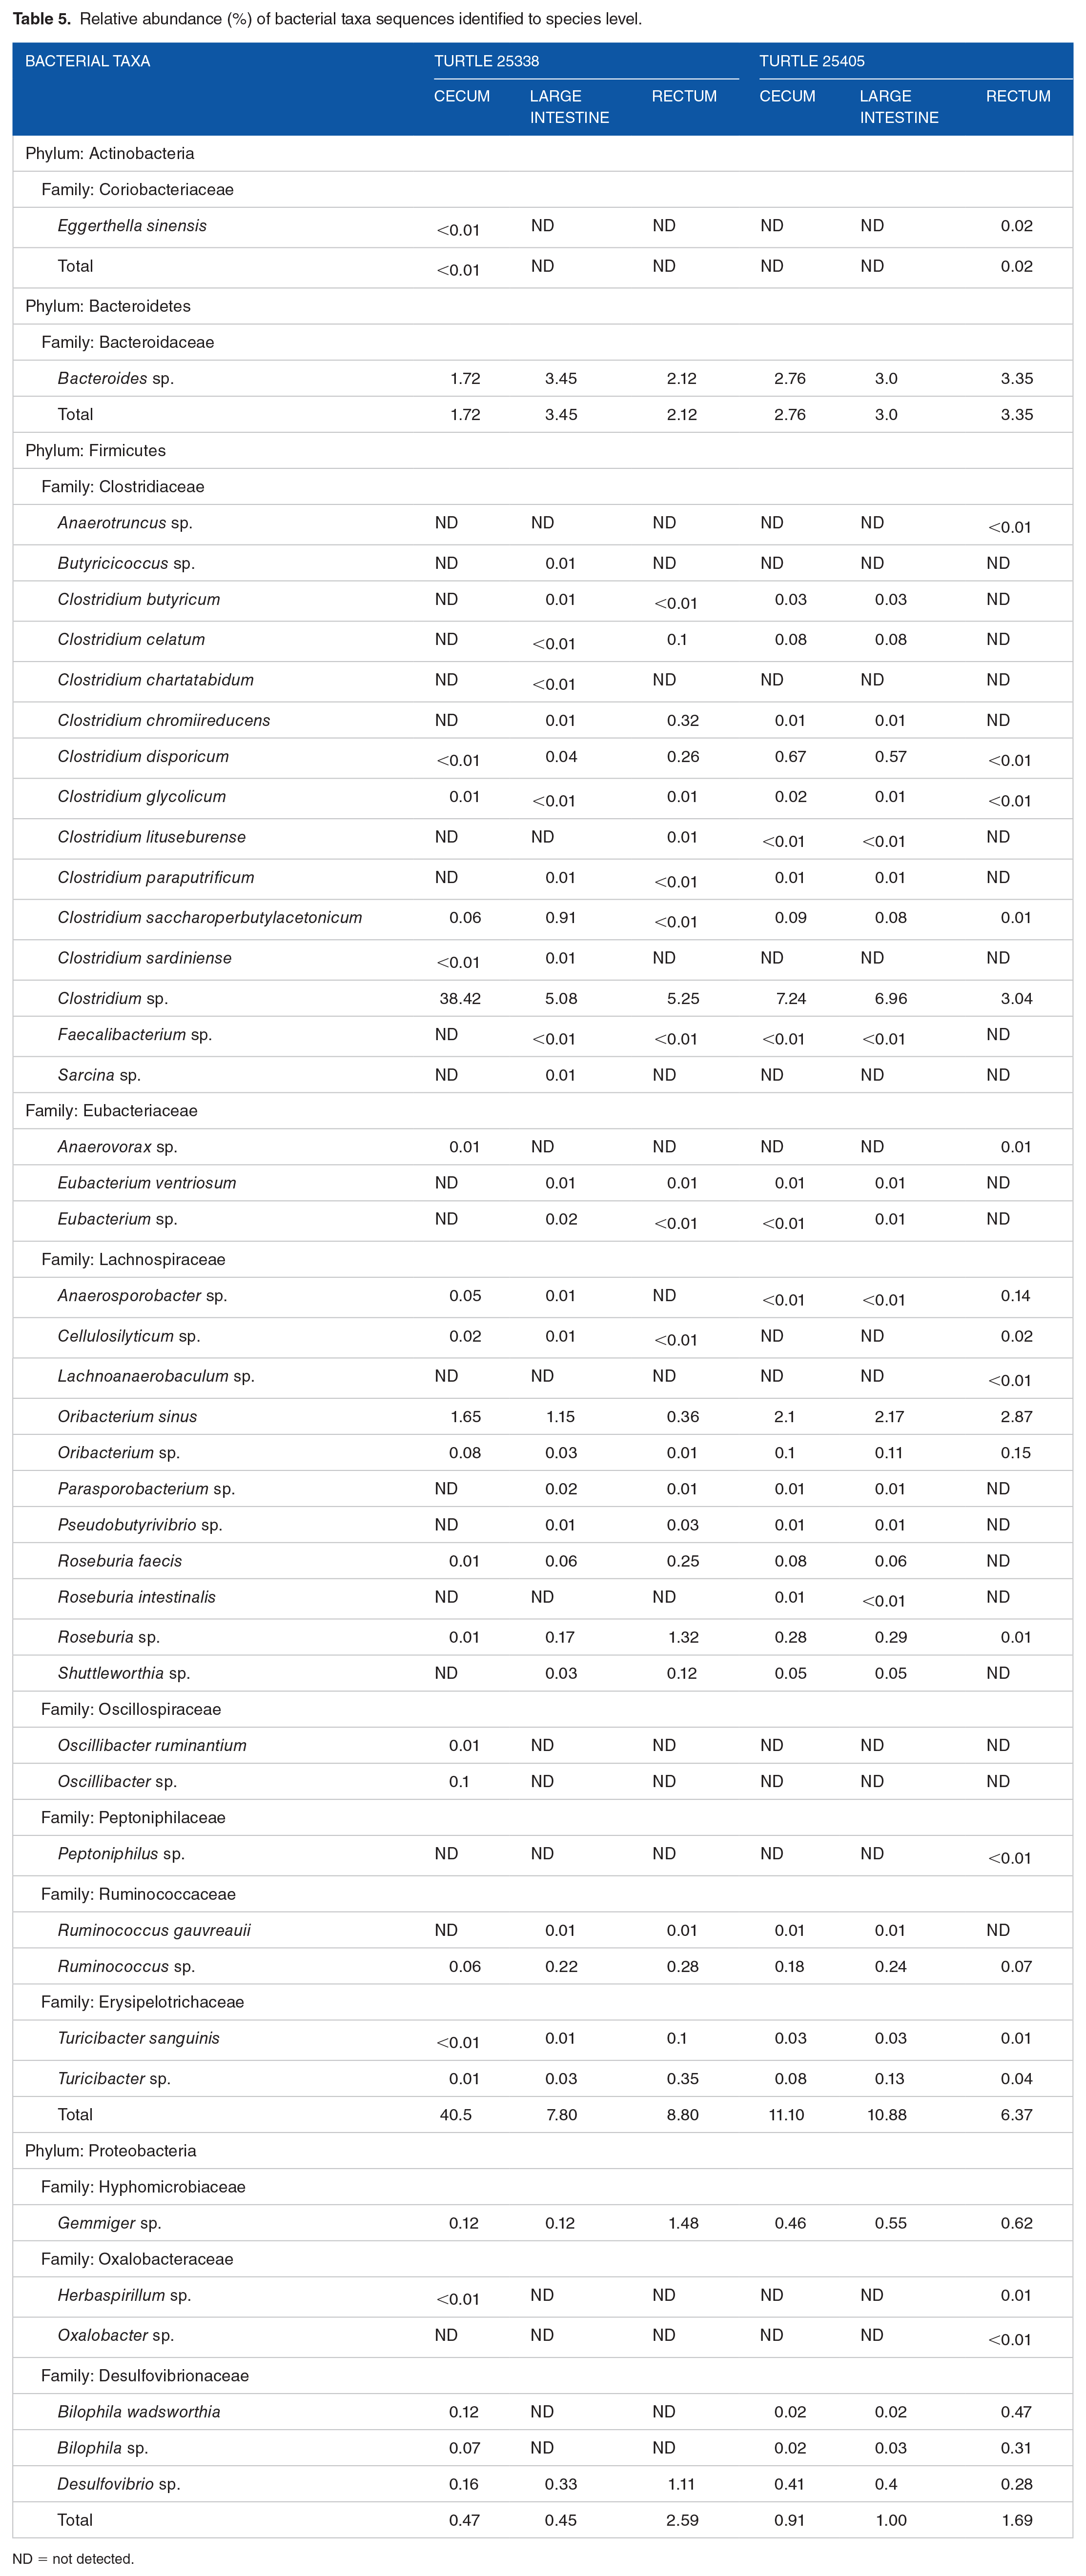
ND = not detected.

Relative abundance among the 16S hypervariable regions (V2V9) in each sample.
Distribution of phyla in hypervariable regions for each sample and Firmicutes: Bacteroidetes ratio.

NA: not applicable.
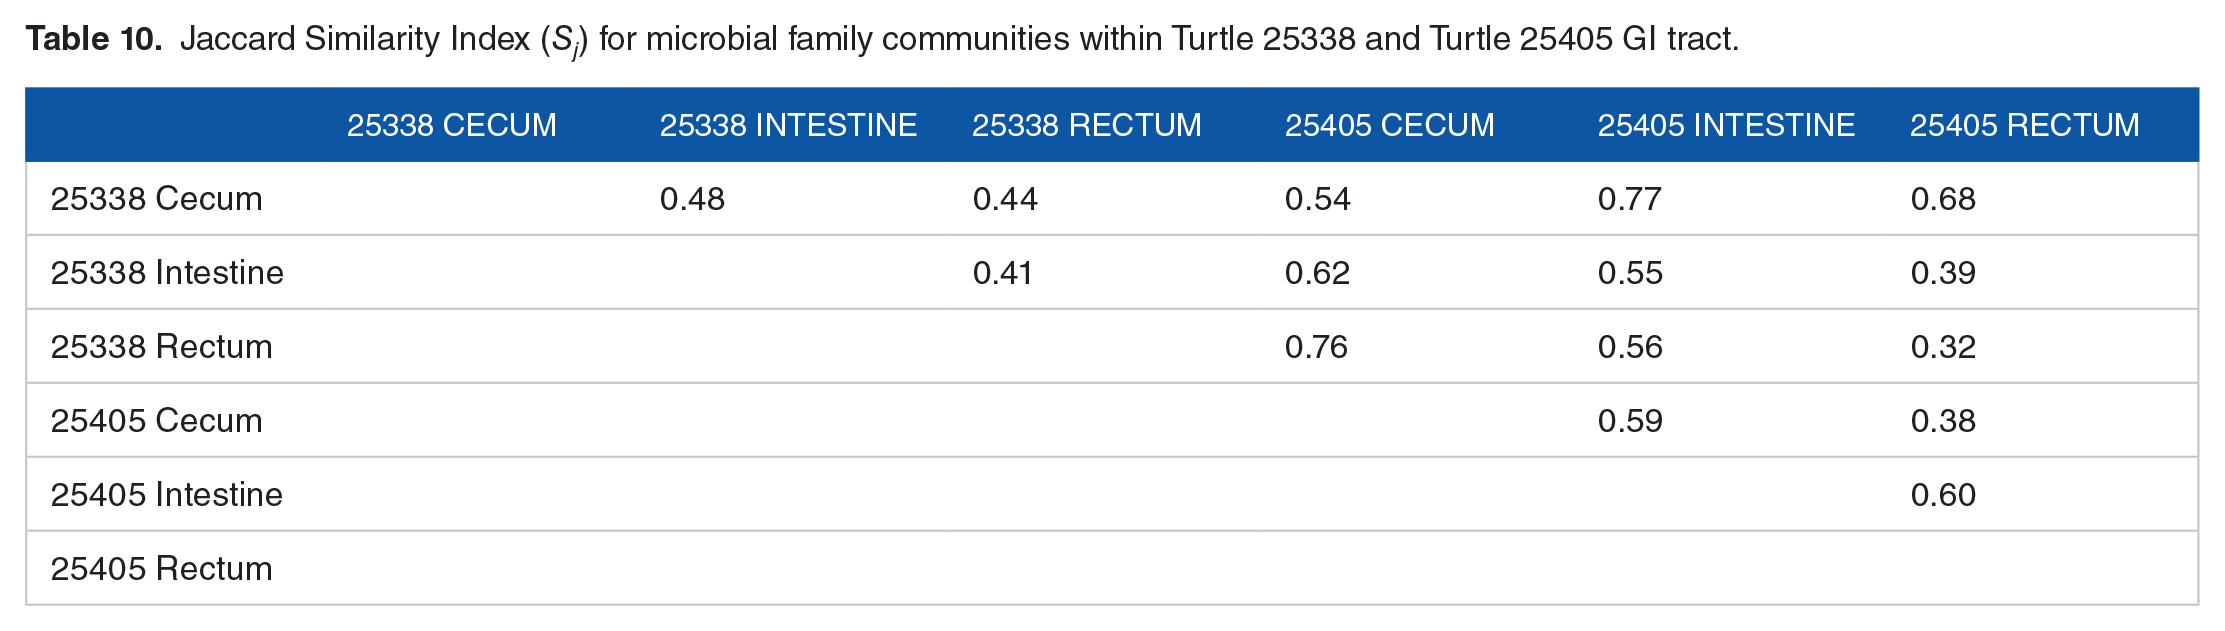
Some differences between turtles were observed in terms of the Firmicutes:Bacteroidetes ratio (F:B), abundance of Phylum Firmicutes, and total number of families. In Turtle 25338, the mean F:B was 2.21 ± 1.75 SD, and in Turtle 25405, the mean F:B was 2.42 ± 1.20 SD. Differences in F:B among hypervariable regions are evident (Table 6). The percent composition of Phylum Firmicutes increased in distal sections of the GI tract in Turtle 25338 (Table 7): 50% in cecum to 56% in large intestine to 78% in rectum, whereas this pattern was not seen in Turtle 25405 (Table 7): 74% Phylum Firmicutes in cecum, 73% in large intestine, 42% in rectum (Figures 2 and 3). In both turtles, the five most abundant bacterial families included Bacteroi-daceae and Porphyromonadaceae (Phylum Bacteroidetes) and Clostridiaceae, Lachnospiraceae, and Ruminococcaceae (Phylum Firmicutes) in varying amounts (Table 8). In Turtle 25338, the family richness decreased distally: 39 families in the cecum, 28 in large intestine, and 22 in rectum (Figure 2). However, in Turtle 25405, the family richness was lowest in the cecum (23); the large intestine (36) and rectum (31) contained more bacterial families (Figure 3). Although the cecum in Turtle 25338 contained the greatest number of different families, 30 of the families were in low abundance (<1% of total sequences). The highest family diversity index (H’) was found in Turtle 25405’s rectum (2.14), whereas the lowest family diversity was in Turtle 25338’s rectum (Table 9). In Turtle 25338, the family diversity (H’) decreased distally: 2.03 in the cecum, 1.76 in the large intestine, and 1.51 in the rectum. Conversely, in Turtle 25405, the family diversity (H’) increased distally: 1.55 in the cecum, 1.63 in the large intestine, and 2.14 in the rectum. Equitability (EH) among all samples was variable, with the highest evenness in Turtle 25338’s rectum (0.56) and the lowest in Turtle 25405’s rectum (0.39) (Table 9). For Turtle 25338, the equitability decreased distally: 0.53 in cecum, 0.45 in the large intestine, and 0.39 in the rectum. However, in Turtle 25405, the equitability increased distally: 0.40 in the cecum, 0.43 in the large intestine, and 0.56 in the rectum. Using Jaccard Index (Sj), similarity of family composition in GI regions within each turtle, and between turtles was highly variable (Table 10). The most similar bacterial communities were in Turtle 25338’s cecum and Turtle 25405’s large intestine (77%). The most dissimilar bacterial communities were from the rectum of both turtles (32%). Examination of the beta diversity in the microbial communities among different taxonomic levels (family, genus, species) shows that the samples from the cecum and large intestine of Turtle 25405 group together at all three levels, as shown in the PCoA plots (Figure 7A to C), whereas in a species level comparison, the samples from the cecum and large intestine of Turtle 25338 are similar, but the rectum sample from Turtle 25338 is not.
Percent abundance of bacterial phyla in the microbiome of three sections of the GI tract in two Hawaiian green turtles.

Abbreviation: GI, gastrointestinal.
Percent abundance of four most abundant bacterial families in the microbiome of three sections of the GI tract in two Hawaiian green turtles.

Abbreviation: GI, gastrointestinal.
Alpha diversity index of microbial family communities using the Shannon-Wiener Diversity Index (H’) and the Shannon-Wiener Equitability Index (EH) in parentheses.

Jaccard Similarity Index (Sj) for microbial family communities within Turtle 25338 and Turtle 25405 GI tract.

Principle Coordinates Analyses (PCoA) plots for the comparison of six microbiome communities using the Bray-Curtis diversity index (A = Family level; B = Genus level; C = Species level). The eigenvalues represent the variance extracted by each axis and are expressed as a percentage of the sum of all eigenvalues (total variance).
Discussion
Adaptations of marine reptiles for efficient digestion of plant material include large body size, slow metabolic rate, scissor-like feeding structures, large colon, long transit times through GI tract, 23 and GI digestive bacteria that can hydrolyze and ferment complex carbohydrates or polysaccharides in the food. Using traditional microbial techniques, the cecum, one of the primary sites of marine plant digestion for green turtles, had the greatest number of bacterial taxa identified; however, these were only aerobic and culturable taxa, which are not representative of the total digestive GI microbiota.
Using 16S metagenomics, all samples from the Hawaiian green turtle GI tract had dominant microbiota consistent with other marine herbivores, ie, fish, marine iguana, manatee.18-23,44,45 The abundance of Firmicutes and Bacteroidetes bacteria in green turtles mirrors the predominance of these phyla in marine iguana fecal and total microbial communities, where Firmicutes and Bacteroidetes have a core role in gut function and host metabolism in iguanas. 23 The current study, as well as Ahasan et al. 27 and Campos et al., 29 documented the families Bacteroidaceae and Porphyromonadaceae (Phylum Bacteroidetes), and Clostridiaceae, Lachnospiraceae, and Ruminococcaceae (Phylum Firmicutes) as dominant, core families in the microbiome in green turtles. In addition, the abundance of Lachnospiraceae exceeded that of Ruminococcaceae in all three sections of the GI tract, which was also characteristic of green turtles from Australia and Brazil27,29 and marine iguanas in the Galápagos Islands. 23 The genera, Clostridium and Rumminococcus (Phylum Firmicutes), prevalent in marine iguanas, are known to produce carbohydrate active enzymes and to degrade cellulose, 33 and Clostridium butyricum produces butyrate and acetate, two short-chain or volatile fatty acids, through microbial fermentation of dietary fibers in the lower intestinal tract. Members of the genus Bacteroides (Phylum Bacteroidetes) are abundant in the digestive tract of herbivorous hindgut fermenting vertebrates.33,46 Species of Bacteroides produce a variety of glucosidases and xylosidases, including β-1,3-glucosidase that can degrade laminarin, a polysaccharide of brown algae. 47 Bacteroides spp. have the ability to use macroalgal glycans and ferment these carbohydrates into short-chain fatty acids, nutritionally valuable to marine herbivores, such as green turtles.48,49
The Firmicutes:Bacteroidetes ratio (F:B) of ~2.0 observed in Hawaiian green turtles in this study is similar to the F:B reported from herbivorous, mammalian hindgut fermenters, such as the healthy gut of horses, 50 the cecum of beavers, 33 as well as from some green turtles from Australia, Gulf of Mexico, and Brazil (Table 11).26-29 Previously reported F:B in green turtle microbiomes ranges from 0.24 in juvenile pelagic green turtles 26 to 2.1 in wild adults (Table 11). 27 Price et al. 26 also reported differences in F:B in juvenile green turtle fecal samples (2.0) compared with their cloacal samples (0.47). Fecal samples of omnivorous, hospitalized loggerhead turtles (Caretta caretta) from the Mediterranean Sea have high abundances of Firmicutes, and high F:B ranging from 2.3 to 10.651-53; however, the ratios are even higher in herbivorous marine and terrestrial iguanas. 23 The consistent prevalence of Firmicutes and Bacteroidetes in green turtles in this study, as well as previous studies from other parts of the world, suggests that these two bacterial phyla form a stable core of the green turtle microbiome.
Percent abundance of common bacterial phyla in the microbiome of marine turtle species and herbivorous lizard species.

Abbreviations: F:B, Firmicutes:Bacteroidetes ratio; GI, gastrointestinal; H, herbivorous; O, omnivorous.
Another phylum, Proteobacteria, was reported as abundant in microbiome samples of juvenile green turtles, 26 immunodepressed green turtles, 29 stranded, prehospitalization, and postrehabilitation green turtles,27,28 as well as hospitalized loggerhead turtles,51-53 but was not abundant in healthy wild green turtles27,29 nor in this study (Tables 7 and 11). Proteobacteria, known to be abundant in omnivores, have vital roles in maintaining gut O2 and CO2 concentrations and pH levels that facilitate anaerobic bacterial colonization. However, some members of the Proteobacteria can be indicators of dysbiosis or an imbalance in the natural microbiota, and some are pathogens responsible for disease. 27
A small number of sequences from Order Desulfovibrionales (phylum Proteobacteria) were found in all green turtle samples in this study, with the highest percentages in the rectum for both turtles. This order of bacteria is common in omnivores 45 and could be residual bacteria from the juvenile omnivorous stage of green turtles. Desulfovibrio was one of the dominant genera found in the hindgut and blind cecum of zebra perch sea chub (Hermosilla azurea), a warm-temperate fish that eats only macroalgae, 44 and in the fecal microbiome of marine iguanas. 23 Desulfovibrio spp. are anaerobic, sulfate-reducing bacteria. Red macroalgae are common in the diet of green turtles, marine iguanas, and zebra perch sea chub. The utilization of these macroalgae, which contain sulfated algal galactans, 54 might explain the presence of members of the Desulfovibrionales in the microbiome.
All GI tract samples in this study had lower diversity (H’ ⩽ 2.16) than Price et al. 26 reported for juvenile green turtle cloacal (H’ = 4.5) and fecal (H’ = 6.5) swab samples because the current study included only families, not all levels of taxa (phylum to species) in the Shannon-Wiener analysis as in Price et al. 26 Differences in results between this work and Price et al. 26 may also be attributed to differences in age of turtles (adults vs juveniles), habitat (Pacific Ocean vs Northern Gulf of Mexico), and sample sources (internal GI tract vs cloaca and feces).
This study is the first to successfully carry out in situ GI tract sampling of digestive, hindgut microbiota of green turtles, whereas previous studies of green turtle microbiota used only cloacal and/or fecal sampling.24-29 Julliand and Grimm 34 determined that feces are not representative of the proximal part of the hindgut, and that the fecal microbiome is not equivalent to the cecum and colon microbiomes in horses. The cecum and fecal communities in beavers were distinct: microbial composition was similar, but communities differed in abundance of bacterial groups. 33 Similarly, for ruminant herbivores, Neumann and Dehority 30 and Ishaq and Wright31,32 have repeatedly argued that fecal samples are not adequate for studying organisms in the rumen. The GI tract of freshwater American alligators consists of several distinct microbiomes specific to GI organs from the mouth to the colon. 35 Keenan et al. 35 unequivocally showed that alligator fecal microbial community composition did not accurately represent the gut microbiome, and that fecal samples alone would give misleading information about the GI tract ecosystem. However, Hong et al. 23 contended that fecal microbiota adequately represent the gut microbiota in herbivorous reptiles with long food retention times. Despite a reported mean intake passage time for East Pacific green turtles of 23.3 days, 55 we chose to use in situ sampling because samples taken from the cloaca and feces may be unreliable indicators of digestive system microbiota because of possible contamination of the external surfaces of the cloaca and feces by bacteria occurring in seawater, and because aerobic conditions in the cloaca and fecal material may select against anaerobic bacteria. Results of this study showed some variation among the GI tract sections, but more whole GI tracts need to be sampled to determine whether these differences are significant. Although at the phylum level, Firmicutes and Bacteroidetes are consistently prevalent in fecal samples, cloacal swabs, and in situ samples, closer comparisons at the genus and species level are needed to support the conclusion that the fecal microbiota is a good proxy for GI tract microbiota in green turtles.
The GI microbiome contributes significantly to the herbivorous host’s nutrition and health. 56 Beneficial functions of the gut microbiome include (1) utilization of carbohydrates that the host cannot digest and release of energy to the host in the form of short-chain fatty acids; (2) protection of the host from pathogens 57 ; (3) detoxification of secondary metabolites in food plants, ie, terpenes, polyphenols, halogenated compounds 23 ; and (4) contributions to the physiological development of the host.34,58 These roles of the microbiome need to be examined in green turtles.
Strong links have been documented among ecosystem factors (host habitat, available resources, and diet), microbiome characteristics (richness, diversity, composition, and stability), and host health, fitness, and abundance.59,60 Change in host diet “can rapidly and dramatically alter composition, relative abundance, and function of gut microbes.” 59 In Burmese pythons, a significant shift in the intestinal bacterial community at the genus level occurred after feeding. 61 The GI microbiome in American alligators varied with seasonal winter fasting, as well as diet (wild vs farm-raised). 35 Minor changes in diet also produce notable effects on the microbiome in monkeys 60 and horses. 34 Dietary shifts associated with habitat disturbance influenced the GI microbiomes of herbivorous black howler monkeys. 62 Howler monkeys occupying suboptimal, disturbed habitats consumed less diverse diets, had less diverse gut microbiomes, and showed a reduction in the number of microbial genes related to butyrate production and hydrogen metabolism, all of which could affect host health. 62 Hawaiian green turtles face many similar challenges in the wild: degraded reef habitats, coastal eutrophication, and marine benthic flora often dominated by non-native, invasive macroalgae. Green turtles in Australia that had undergone rehabilitation in captivity showed shifts in abundance of cloacal bacterial genera that Ahasan et al. 28 attributed to a diet shift from seagrasses to human-grade seafood (squid), as well as improved health. Stress from being confined may also have been a factor. Similarly, the cloacal microbiome of freshwater false map turtles (Graptemys pseuodogeographica) was altered by captivity, 63 perhaps because of diet, stress, and/or water conditions. A potential chemical stressor, glyphosate herbicide, at low concentration for 72 hours while in captivity, did not have a significant effect on the community structure in the false map turtle cloacal microbiome. 63 However, examination of the data seemed to show a decrease in the diversity of OTUs after 72 hours in turtles exposed to the glyphosate, but the researchers did not statistically analyze this change. 63 Bacteria isolated from Hawaiian green turtle GI tracts and then exposed to glyphosate in vitro had significantly lower bacterial growth and survival in glyphosate concentrations ⩾2.2 × 10⁻⁴ g L−1. 64 Exposure to stress also significantly altered the composition and function of gut microbes in mice: the relative abundance of Bacteroides decreased, but the relative abundance of Clostridium increased. 65 The two turtles used in the current 16S microbiome analysis differed in many ways that could have influenced their microbiome: home island, season, sex, gut fill amount, and health. Whether fibropapillomatosis and stress from fishing line entanglement cause different effects in the GI tract microbiome cannot be determined from this study’s data. Future work must compare the microbiomes of green turtles, both healthy and stranded, in different habitats, eating different diets, and exposed to different stressors.
The fermentation of carbohydrates to short-chain fatty acids “appears to exhibit a high level of redundancy” 58 because multiple species in the phyla Bacteroidetes, Firmicutes, Actinobacteria, and Proteobacteria have the genes that code for carbohydrate metabolism. This redundancy of function may help to conserve the stability of enzymes, to guard against breakdown of critical chemical reactions even in the face of change in the host’s microbiome composition, and to allow recovery of function after a disturbance to the microbial community, such as change in diet, viral attack, or antimicrobial chemicals.46,58 The hyperdiverse, yet functionally redundant, GI microbial communities of green turtles may be proof of Ehrlich and Walker’s 66 concept of rivets and redundancy, which states that “species redundancy in ecosystems is an important property that contributes to ecosystem resilience.” However, we know too little about the green turtle microbiome to determine which bacteria are crucial, indispensable, core species, and which are “poppable” rivets.
Next-generation sequencing, such as high-throughput sequencing techniques, can more fully elucidate the whole microbial community in organisms, especially GI tract microbiota that cannot be cultured.32,41 However, different universal primers used in species-rich mixtures may amplify different fractions of a community and bias the results toward certain taxa. 67 For a more complete description of the turtle gut microbiome diversity and dynamics, the use of different universal primer pairs may be needed. In addition, the quality of metagenomic data analysis is limited by the reference library available. Some of the reads in our samples were identified as red macroalgal sequences, including Pterocladiella capillacea, a red macroalga frequently consumed by green turtles. Reference databases for eukaryotic algal sequences are still in the developmental stages.68-70 In this study, preliminary analysis using Ion Reporter (Life Technologies Corp.) showed that over half of the sequences obtained could not be identified to species level, but only to family level. Regardless, the bacterial diversity present in the green turtle gut microbiome is irrefutable. Green turtle GI microbiomes might be a potential source of novel microbial genes and enzymes with bioengineering applications in the breakdown of complex plant materials. In the future, we may need to “mine the microbiome” 46 of green turtles!
Future studies should compare the GI tract bacteria of more turtles for insight into the healthy, core GI microbiome. Accurate and precise enumeration of green turtle microbiota may help clarify connections between diet composition and digestive bacteria, as well as provide new tools for assessing the health of green turtles grazing in different locales. Knowledge of the green turtle microbiome may allow development of methods for disease prevention. A key to long-term conservation of this species may depend on our understanding of their microbial community composition and dynamics and factors affecting the microbiome.
Footnotes
Acknowledgements
The authors are thankful for the help of many people: Dr Thierry Work, Dr Bob Morris, Dr Jennifer Lynch, Ms Shandell Brunson, Mr Devon Francke, Ms Olivia Hughes (NOAA National Marine Fisheries Service-PIFSC Marine Turtle Biology and Assessment Program), who assisted with necropsies and sample collections; Mr Marc Rice and many of his students at Hawai‘i Preparatory Academy, who helped with sample collection during turtle tagging; Dr Scott Geib (U.S. Department of Agriculture-Agricultural Research Service), Mr Donald Wong (University of British Columbia), and Mr Casey Riegler (Thermo Fisher Scientific) for helping to troubleshoot the Ion Torrent pipeline; Dr Jonathan Awaya (UH-Hilo Biology Department), Ms Tara Holitzki, Mr Erik Johnson, and Ms Jazmine Panelo (UH-Hilo Analytical Lab) for assistance in the lab, and providing lab space and equipment; Ms Virginia Branco and Mr Kalewa Correa (NOAA-Mokupāpapa Discovery Center for Hawaiʻi’s Remote Coral Reefs) for providing comments on preliminary manuscript drafts; and UH-Hilo students, who assisted with preliminary fecal sample collection.
Funding:
The author(s) received no financial support for the research, authorship, and/or publication of this article.
Declaration of conflicting interests:
The author(s) declared no potential conflicts of interest with respect to the research, authorship, and/or publication of this article.
Author Contributions
KJM contributed to literature review, data analysis, interpretation of results, writing, and supervision of the team’s collaboration; RPK carried out all aspects of this research from turtle necropsies to manuscript edits; AV assisted with and supervised all steps of 16S metagenomics analysis and contributed edits; SP provided expertise on analysis of sequencing data and contributed edits; LM advised on traditional bacterial culturing and made edits; GHB assisted with tissue sampling and editing.