
Abstract
Hepatocellular carcinoma (HCC) is a common malignant tumor representing more than 90% of primary liver cancer. This study aimed to identify metabolism-related biomarkers with prognostic value by developing the novel prognostic score (PS) model. Transcriptomic profiles derived from TCGA and EBIArray databases were analyzed to identify differentially expressed genes (DEGs) in HCC tumor samples compared with normal samples. The overlapped genes between DEGs and metabolism-related genes (crucial genes) were screened and functionally analyzed. A novel PS model was constructed to identify optimal signature genes. Cox regression analysis was performed to identify independent clinical factors related to prognosis. Nomogram model was constructed to estimate the predictability of clinical factors. Finally, protein expression of crucial genes was explored in different cancer tissues and cell types from the Human Protein Atlas (HPA). We screened a total of 305 overlapped genes (differentially expressed metabolism-related genes). These genes were mainly involved in “oxidation reduction,” “steroid hormone biosynthesis,” “fatty acid metabolic process,” and “linoleic acid metabolism.” Furthermore, we screened ten optimal DEGs (CYP2C9, CYP3A4, and TKT, among others) by using the PS model. Two clinical factors of pathologic stage (P < .001, HR: 1.512 [1.219-1.875]) and PS status (P <.001, HR: 2.259 [1.522-3.354]) were independent prognostic predictors by cox regression analysis. Nomogram model showed a high predicted probability of overall survival time, and the AUC value was 0.837. The expression status of 7 proteins was frequently altered in normal or differential tumor tissues, such as liver cancer and stomach cancer samples.We have identified several metabolism-related biomarkers for prognosis prediction of HCC based on the PS model. Two clinical factors were independent prognostic predictors of pathologic stage and PS status (high/low risk). The prognosis prediction model described in this study is a useful and stable method for novel biomarker identification.
Introduction
Hepatocellular carcinoma (HCC) is the most common type of liver cancer in China and account for the second leading cause of cancer death. 1 An estimated 42,810 new cases were diagnosed as liver cancer in the United States and more than 30,160 patients died of this disease, according to cancer statistic in 2020. 2 Risk factors for HCC included infection of chronic hepatitis B or C (HBV/HCV) virus, alcohol abuse, diet of aflatoxin, and progress to cirrhosis induced by nonalcoholic steatohepatitis.3,4 Treatment of HCC depends on the tumor stage, and different therapeutic options are available for early-stage patients, including orthotopic liver transplantation, surgical resection, radiofrequency ablation, and chemo- and radio-therapy.5,6 Despite great improvement in surgical treatments over past decades, long-term outcome needs remain unmet, and patients with advanced stage still have limited therapeutic options. As for the greatly increased disease burden, it is important to identify useful and reliable tumor biomarkers for early stage detection and prognosis prediction of advanced HCC.
Changes in genomic and subsequent transcriptome expression are the most common characteristics driving tumorigenesis and have been extensively uncovered in liver cancer patients.7-9 The recent development of sequential transcriptome analysis could potentially promote understanding of molecular mechanisms in human liver cancer. It facilitated the diagnosis and therapy of this disease. By using transcriptome analysis, researchers identified cohorts of genes as potential candidate biomarkers for prognosis in HCC patients, such as YWHAZ, ENAH, and HMGN4. 10 Furthermore, based on RNA-seq analyses, Jiang et al. identified several genes and miRNAs that might be pathogenic biomarkers of HCC. 11 According to integrative analyses of genome and transcriptome sequencing data, Miao et al. screened multiple prognostic biomarkers in hepatitis B virus-related HCC patients, including protein kinase TTK. 12 These findings provided novel insights and an important strategy to identify tumor biomarkers for early diagnosis and prognosis prediction of the disease.
In this study, we first analyzed the transcriptomic expression status of HCC derived from The Cancer Genome Atlas (TCGA) database and screened differentially expressed genes (DEGs) by integrated analysis of three genomic profiles related to the metabolism of amino acids, carbohydrates, and lipids. The prognostic score (PS) model was constructed to identify optimal prognosis-related genes. Finally, by analyzing the Human Protein Atlas (HPA) database, we analyzed the expression levels of critical genes in different cells, tissues, and cancer types. Our results identified novel prognostic biomarkers for HCC patients, which provides new insight on the understanding of HCC.
Materials and Methods
Microarray data resource
Microarray datasets of HCC downloaded from TCGA database (https://gdc-portal.nci.nih.gov/) on 10 February 2020 were tested on the Illumina HiSeq 2000 RNA Sequencing platform. The datasets comprised 423 samples, including 373 liver cancer samples and 50 normal samples. There were 367 tumor samples labeled with clinical prognostic information. This dataset was used as training data set.
Moreover, the genomic profiles of liver cancer under access number E-TABM-36 13 were derived from EBIArray database 14 (https://www.ebi.ac.uk/arrayexpress/) and tested on GPL96 [HG-U133A] Affymetrix Gene Chip Human Genome HG-U133A platform. E-TABM-36 dataset included a total of 65 samples, which comprised 11 normal samples and 44 liver cancer tissue samples with prognostic information. E-TABM-36 was considered as validation dataset.
Screening metabolism-related DEGs in liver cancer samples
Limma package 15 in Version 3.34.7 (https://bioconductor.org/packages/release/bioc/html/limma.html) was used to screen the DEGs between tumor samples and normal tissue samples in TCGA training sets under the criteria of FDR < 0.05and | log2FC | > 1 (Parameters was set as 2 times).
After exacting the expression value of DEGs from the training data set, we used pheatmap 16 (version1.0.8, https://cran.r-project.org/web/packages/pheatmap/index.html) in R3.4.1 software to perform hierarchical clustering analysis by using the algorithm of centered Pearson correlation. 17
All genes related to the metabolism of amino acids, carbohydrates, and lipids were downloaded from the Gene Set Enrichment Analysis 18 (GSEA, http://software.broadinstitute.org/gsea/downloads.jsp) database. We analyzed the intersection between metabolism-related genes and DEGs of training datasets.
The overlapped genes were screened as candidate genes and by functional enrichment analysis, including GO biological process annotation and KEGG pathway analysis by using DAVID19,20 (version 6.8, https://david.ncifcrf.gov/) tool. P values lower than .05 were considered to indicate significant difference.
Construction of PS model
As for the overlapped genes screening from TCGA training set and metabolism cohort gene, we conducted Cox regression analysis using the survival package (version 2.41-1, http://bioconductor.org/packages/survivalr/). 21 By the criteria of log-rank p value less than 0.05, we screened the prognosis related DEGs.
Penalized package 22 Version 0.9.50 (https://cran.r-project.org/web/packages/penalized/index.html) were used to construct the LASSO Cox regression model 23 for optimal DEGs screening. The parameter of “lambda” in the filter model was calculated by 1000 cross-validation likelihood (CVL) algorithm. Then, we developed a novel PS model by calculating the prognostic coefficient of each DEGs and the expression level of DEGs in training set samples. The formula for calculating PS was as follows:

βDEGs meant the prognostic coefficient of signature DEGs, and the Exp DEGs represented the expression levels of DEGs in the training dataset.
To assess the effectiveness and predictive ability of the prognostic model, we first calculated the PS values of whole samples in the TCGA data set. Then, these samples were divided into high- and low-risk groups, based on median PS value. Kaplan Meier curves were generated to evaluate overall survival times of patients between the 2 groups by using survival package Version2.41. Furthermore, the expression values of DEGs were extracted from the validation dataset, and all specimens were also divided into high- and low-risk groups according to the median value. Kaplan Meier curves were generated to evaluate the correlation between prognosis and differential risk groups.
Identifying clinical factors with independent prognostic value in HCC
In the TCGA training dataset, the survival package was used to analyzed HCC samples. Univariate and multivariate Cox regression analyses were conducted to identify independent prognostic factors associated with the survival of patients by the criteria of log-rank P value < .05.
Thus, liver cancer samples derived from the training dataset were divided into different groups according to pathological stage I-IV. Stratified analyses were conducted to explore the correlation between risk grouping and clinical factors.
Moreover, we developed a nomogram model to predict the 3 year- and 5 year- survival probability in liver cancer patients by using rms package 24 (version 5.1-2, https://cran.r-project.org/web/packages/rms/index.html). Nomogram is a logistic regression-based model that has been extensively applied in prognostic prediction of various cancers, such as colorectal cancer, renal cancer, and bladder cancer.25-27 It formulates the scoring criteria according to regression coefficients of all independent variables and assigns a score level for each independent variable. All of the selected samples entered the logistic regression model and the total score of each feature was calculated. The survival probability of each individual was calculated by the transfer function between the score and survival probability.
Expression analysis of target genes at the protein level (HPA database)
By using the Human Protein Atlas (HPA, https://www.proteinatlas.org/) Version 18 database, we analyzed the expression of target genes at the protein level in various cell types and different cancer tissues. HPA is an online database containing large amounts of antibody proteomics and transcriptomics data generated from normal and cancer tissues profiling and RNA sequencing technologies.28-30 Although the HPA database provided immunohistochemistry images, proteomics, and transcriptomics data, it may not be optimal for dataset analysis and automatic retrieval of images. In this study, we performed data mining for critical genes by using HPA analyze packager 31 (version 1.4.3, http://www.bioconductor.org/packages/release/bioc/html/HPAanalyze.html), a software package designed for easy retrieval and analysis of HPA data.
Results
Screening DEGs associated with the metabolism of liver cancer
After data preprocessing, the specimens from TCGA database were divided into tumor and control groups according to clinical information of relapse. By the criteria of FDR < 0.05 and | log2FC | > 1, we screened a total of 1035 DEGs from tumor samples compared with normal specimens, including 196 downregulated and 840 upregulated DEGs (Figure 1A). These DEGs were sorted by increased logFC value, and the top 50 upregulated and downregulated genes were selected to conduct expression level-based hierarchical clustering analysis (Figure 1B). The results showed that clinical samples can be clustered into 2 different directions. Based on GSEA database screening, we obtained 372 amino acid metabolism related-genes, 293 carbohydrate metabolism-related genes, and 738 lipid metabolism-related genes. By comparison of DEGs, we identified 305 overlapped genes (Figure 1C).
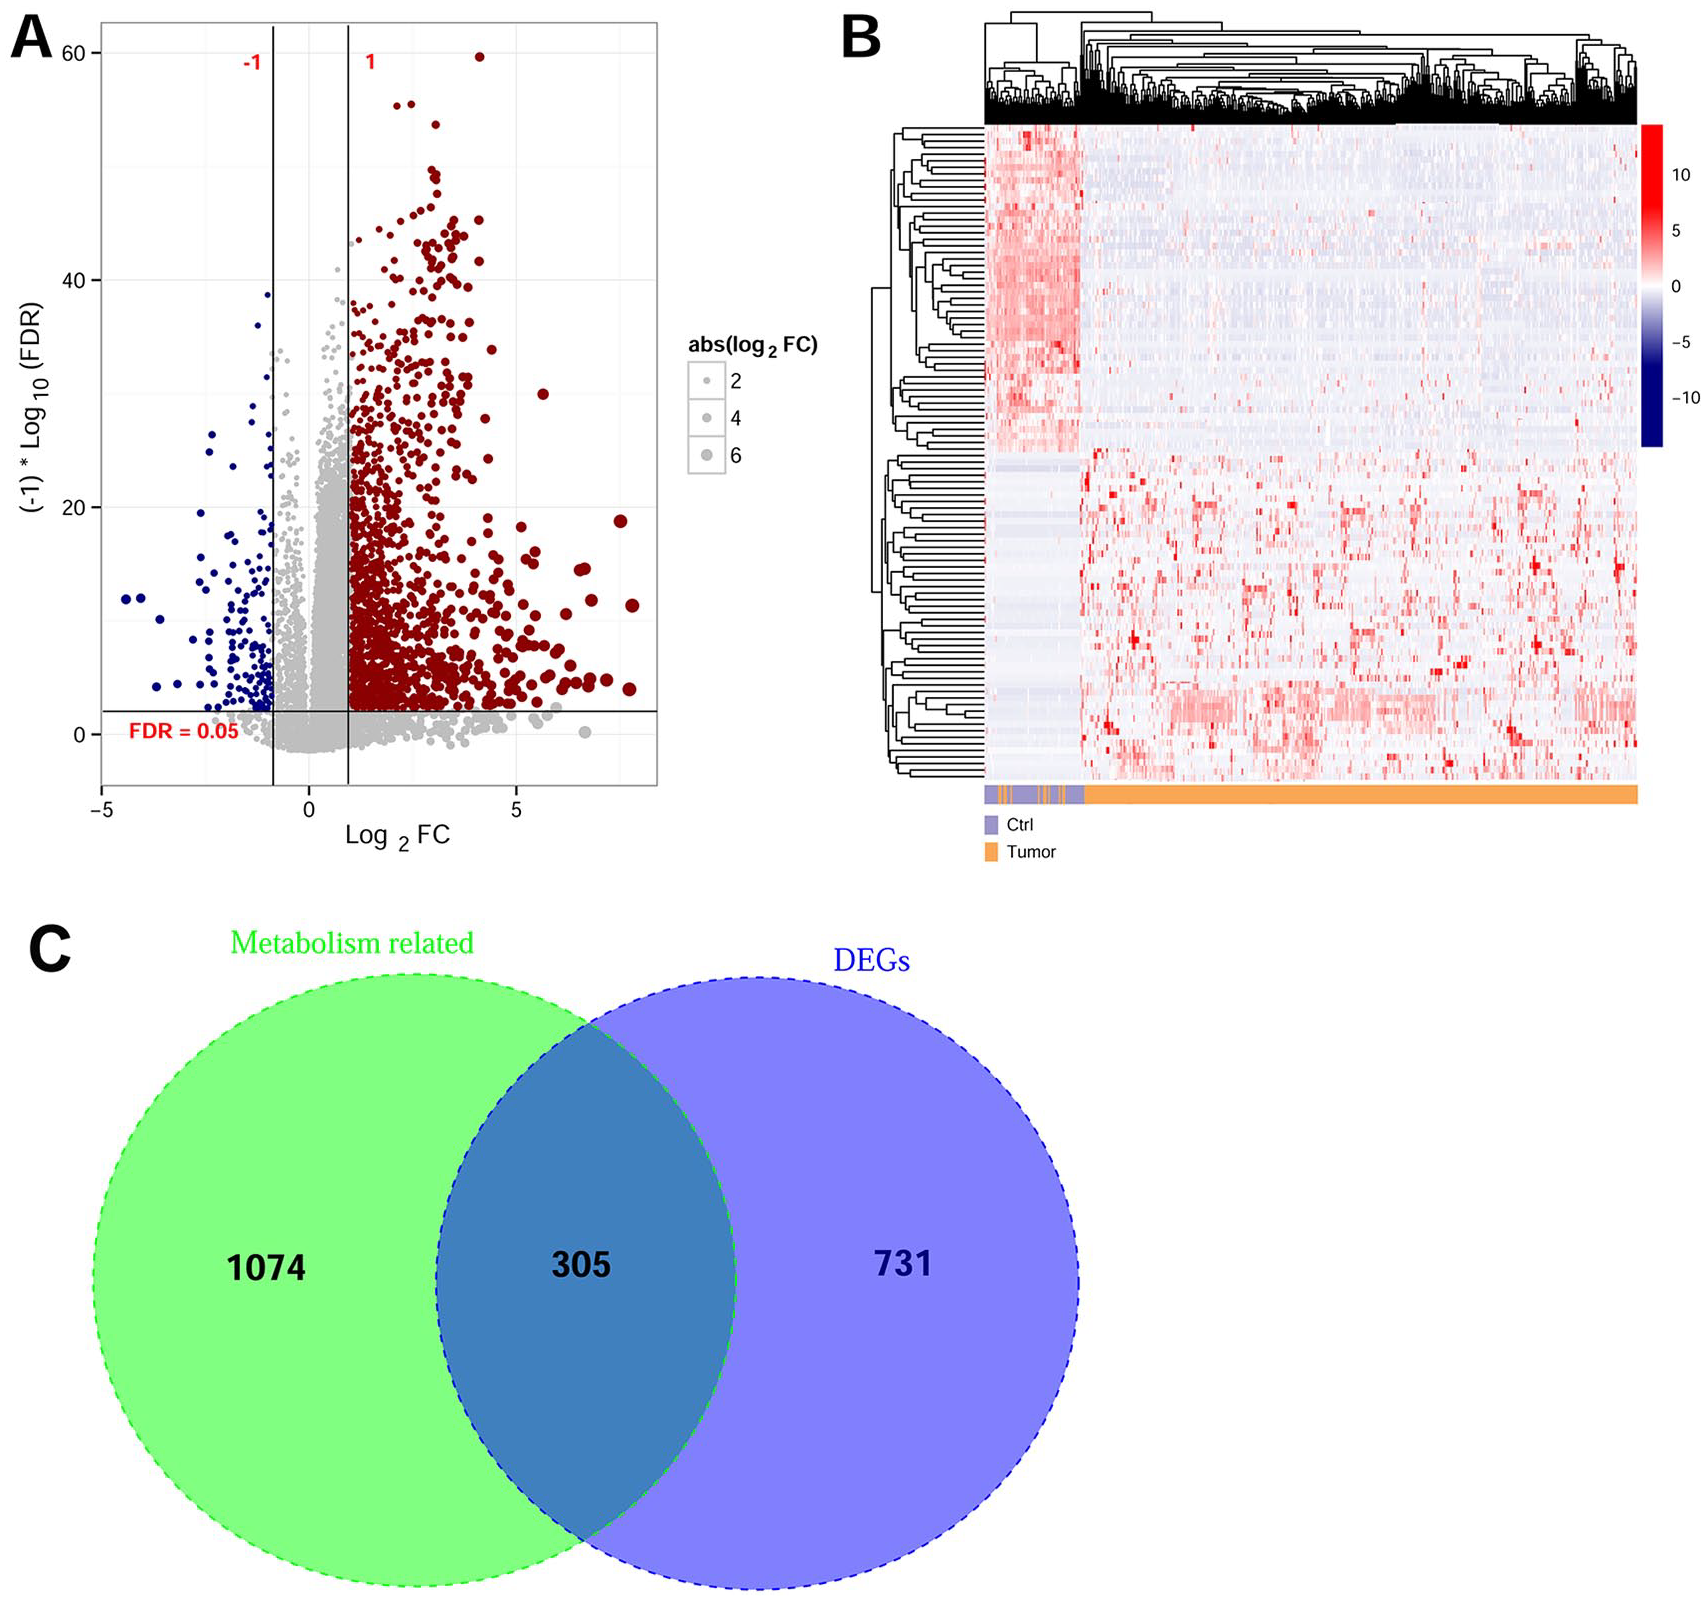
Screening of differentially expressed genes (DEGs) associated with the metabolism of liver cancer patients. (A) Volcano diagram visualizing the DEGs screening from TCGA and EBI Array dataset under FDR < 0.05 and | log2FC | > 1 threshold. The red and blue dots represent upregulated and downregulated DEGs. The line in horizontal axis represents FDR <0.05; while the 2 vertical dotted lines represent |log2FC| > 0.5. The dot size is consistent with absolute value of logFC. (B) Hierarchical clustering analysis results of the top 50 up- and down-regulated DEGs, sorted by increasing logFC values. (C) Venn diagram visualizing the crucial genes associated with liver cancer metabolism by taking the intersection of metabolism-related genes and DEGs of training datasets.
Functional enrichment analysis revealed DEGs were mainly involved in 29 GO terms and 22 KEGG pathways (Figure 2, Table 1). GO terms included “oxidation reduction,” “lipid biosynthetic process,” “fatty acid metabolic process,” “steroid metabolic process,” “carbohydrate biosynthetic process,” among others. The signaling pathway categories were associated with “steroid hormone biosynthesis,” “glycerophospholipid metabolism,” and “linoleic acid metabolism” pathway.

Functional enrichment analysis of Gene Ontology (A) and Kyoto Encyclopedia of Genes and Genomes pathway (B).
Gene Ontology and Kyoto Encyclopedia of Genes and Genomes pathway analysis for intersection genes associated with metabolism of hepatocellular carcinoma.

Prognostic model construction and assessment
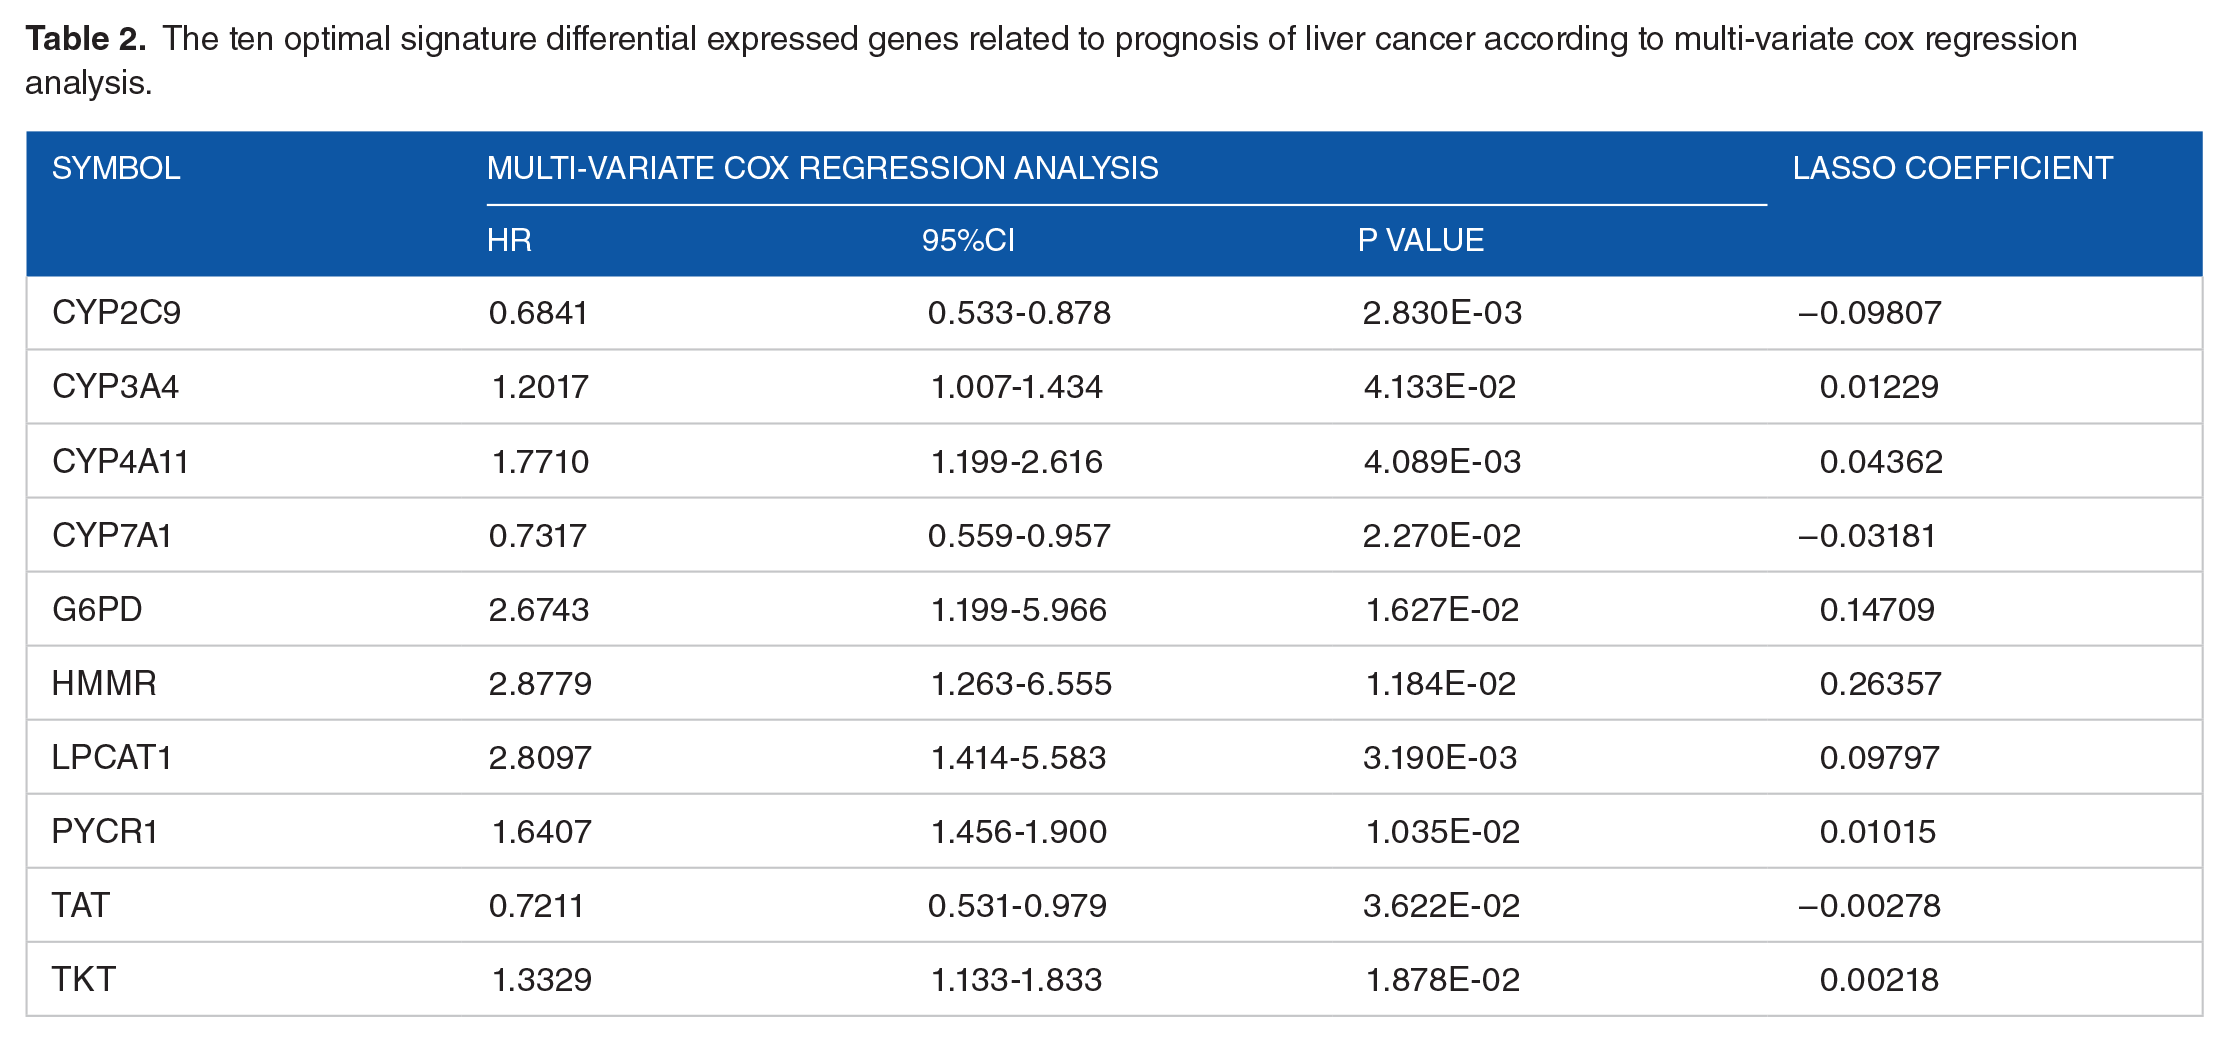
Univariate analysis results showed 146 DEGs were associated with prognosis of liver cancer by criteria of log-rank P value < .05. Further multivariate cox regression analysis revealed 34 genes were identified as prognosis related genes. Based on the Cox-Proportional Hazards model, we screened 10 optimal DEGs for further analysis, such as CYP2C9, CYP3A4, CYP4A11, CYP7A1, G6PD, HMMR, LPCAT1, PYCR1, TAT, and TKT (Table 2).
The ten optimal signature differential expressed genes related to prognosis of liver cancer according to multi-variate cox regression analysis.
In addition, we constructed the PS model according to the prognostic coefficient of each pre and expression level of DEGs in training set samples. All samples from the TCGA training set (n = 367) and E-TABM-36 validation set (n = 44) were divided into high- and low-risk based on median PS value. Significant survival differences were shown in Kaplan-Meier curves (Figure 3). Patients in low risk groups exhibit a longer overall survival time than those in high risk groups, and the result were consistent between both training datasets (P = 8.301e-08, HR:2.598 [1.809-3.730]) and validation datasets (P = 1.183e-02; HR:2.524 [1.197-5.324]). The results indicated that PS model-based risk grouping were significant correlated with actual prognosis for HCC patients. The AUC value of receiver operating characteristic curve (ROC) was 0.837 and 0.795 in the training set and validation set, which represented a high predictive probability.

Kaplan-Meier curves for liver cancer patients in TCGA (A) and E-TABM-36 dataset (B).
Independent prognostic factors for HCC patients by univariate and multivariate analysis
Univariate analysis of clinical factors showed that pathologic T(T1-T4/-, P = 7.867E-09), pathologic stage (I-IV /-, P = 4.468E-07) and PS status (High/Low, P = 8.301E-08) were significantly correlated with overall survival time (Table 3). A multivariate regression analysis was conducted and results indicated that only pathologic stage (I / II / III / IV /-, HR: 1.512 [1.219-1.875], P = 1.680E-04) and PS status (High/Low, HR: 2.259 [1.522-3.354], P = 5.250E-05) were independent prognostic predictors. KM curve in Figure 4A revealed patients with a lower pathologic stage could obtain a better prognosis, which was consistent with their actual prognosis.
Univariate and multivariate analysis result to identify independent prognostic clinical factors for liver cancer patients.

Construction and assessment of nomogram model for 2 independent clinical factors, pathologic stage, and prognostic model status. (A) Nomogram model estimating the 3- and 5-year survival probability of independent prognostic factors. (B) The calibration curve for comparison of the nomogram-predicted probability of overall survival time (OS) and actual OS. The horizontal axis represents the predicted OS survival rate and the vertical axis referred to the actual OS survival rate. Red and black represent the 3- and 5-year predicted line charts, respectively. (C) Receiver operating characteristic (ROC) curve for the accuracy assessment of the differential prognostic models. Black, red and blue, respectively, represent the mRNA model, Stage model, and the mRNA-stage model.
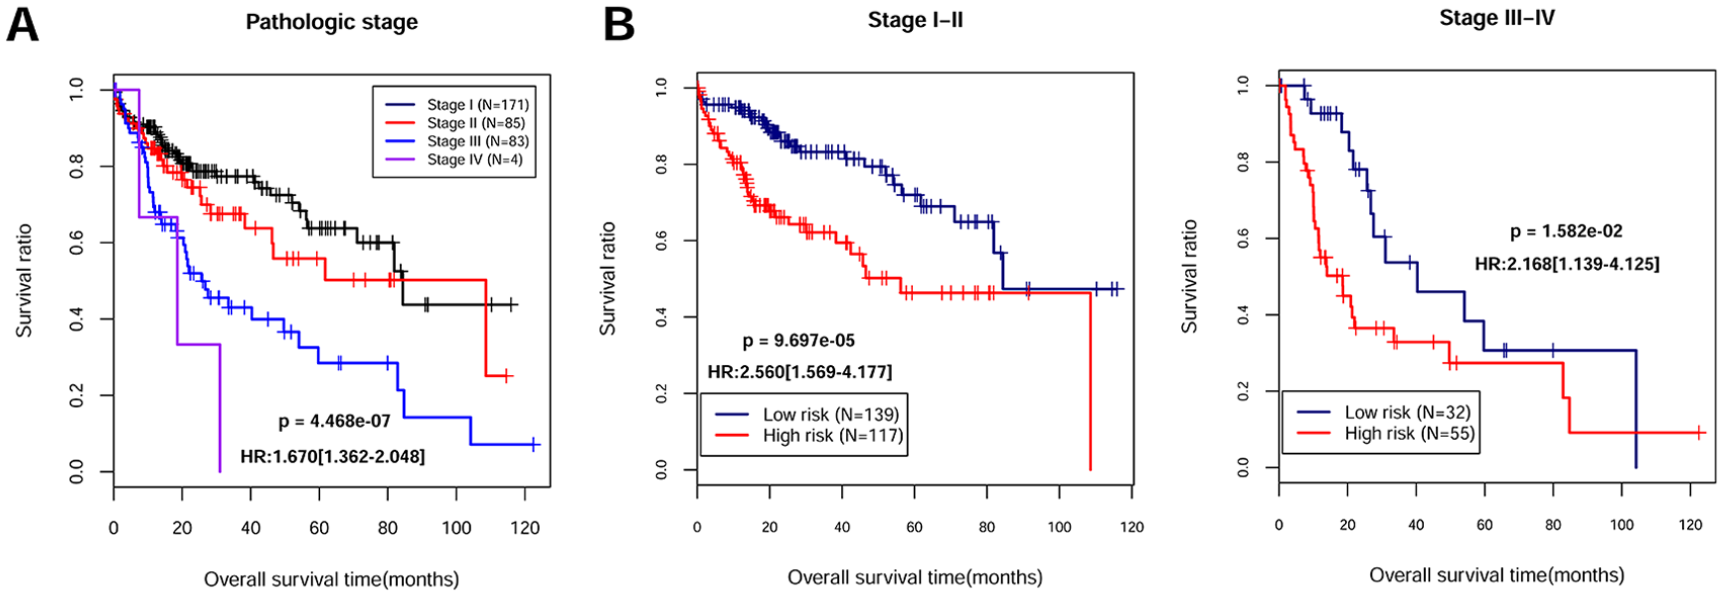
Moreover, stratified analysis was conducted for patients in differential pathologic stage, stage I-II, and stage III-IV. After risk grouping, KM curve analysis showed (Figure 5) patients in low-risk group exhibited a better prognosis than high-risk group individuals (Stage I-II, P = 9.697e-05, HR:2.560 [1.569-4.177]; Stage III-IV, P = 1.582e-02, HR:2.168 [1.139-4.125])

Stratified analysis results of liver cancer patients in different pathologic stage, including Stage I-IV patients. (A) Kaplan Meier curve shows the overall survival time of TCGA samples in different pathology stages. Black, red, blue, and purple color represent Stage I-IV group samples, respectively. (B) Kaplan Meier curve shows the overall survival time of differential pathologic stage patients sorted by prognostic score model. Blue and red color indicate low- and high-risk samples.
In the nomogram model, 4 clinical factors were included, pathologic stage I -IV, PS status, and 3- and 5-year survival times. As shown in Figure 4A, total points in nomograms integrated clinical factors to predict survival probability of each individual at 3-and 5-year times. The diagnostic value of the nomogram model was performed by comparison of the nomogram-predicted probability of OS and actual OS. The C-index value of 3- and 5-year survival time was 0.6869 and 0.7075, respectively (Figure 4B). ROC curve showed the predictive performance for liver cancer by using 2 models, stage model and mRNA model (Figure 4C). The AUC value of ROC curve was 0.837, indicating high accuracy of the prognostic model.
Protein expression of crucial target genes associated with liver cancer
We investigated the protein expression data of target genes in different cancer tissues and cell types from the HPA analysis. The expression status of 7 proteins was frequently altered in normal compared with tumor tissues, such as liver cancer and stomach cancer samples (Figure 6A and C). Three genes (CYP4A11, CYP7A1, and TAT) were not identified in the HPA database. Subcellular location data from the HPA analysis is also shown (Figure 6B) to visualize the expression status of these target genes.

Data mining to explore the protein expression of target genes in various cancer types and cell types.
Discussion
We have screened numerous DEGs between tumor tissue samples and normal specimens from TCGA dataset. After integration with metabolism-related genes from GSEA, we finally identified 305 overlapped genes associated with liver cancer metabolism. Functional analysis showed that these genes were enriched in several biological processes and signaling pathways, such as “steroid hormone biosynthesis,” “arachidonic acid metabolism,” and “linoleic acid metabolism.” Based on the PS model, we obtained ten optimal signature DEGs with prognostic value, including CYP2C9, CYP3A4, and TKT.
Among these genes, CYP2C9, CYP3A4, CYP4A11, and CYP7A1 belong to the Cytochrome P450 (CYPs) superfamily. CYPs enzymes metabolize nearly 60% of prescribed drugs; CYP3A4 is responsible for half of these drug interactions. 32 Although CYP3A4 is mainly expressed in the liver (adult hepatocytes) and small intestine, it also could be transcriptionally induced by multiple xenochemicals.33-35 Regulation of CYP3A4 is complex since numerous transcription factors could interact with the promoter region, and contribute to hepatic-specific expression of this gene, such as C/EBPα-β, CAR and PXR.35,36 Recently, estrogen receptor alpha (ESR1) was also identified as a major transcription factor of CYP3A4, and involved in the regulation of xenobiotics metabolism in human liver. 37 By using immunohistochemistry methods, Fanni et al revealed that CYP3A4 serves as a major metabolic factor of sorafenib, and was present in surrounding hepatocytes in most cases of clinical samples, indicating the potential prognostic predictor roles for HCC management. 38 Furthermore, CYP3A4 was reported as a novel tumor suppressor gene predicted poor prognosis of HCC. 39 Similarly, in this study, our results found CYP3A4 expressed at mostly medium to high level in liver hepatocytes. Based on the PS model, we also identified it as a crucial gene with prognostic prediction value for HCC patients, which is consistent with previous studies. In addition to liver cancer, the dysregulation of CYP3A4 was also found in gastric cancer samples compared with chronic atrophic gastritis cases, which indicates a correlation between CYP3A4 expression and carcinogenic transformation of gastric cancer. 40 Moreover, a similar trend was explored in the influence of CYP2C9 expression. The hepatic CYP2C9 proteins account for nearly 20% of CYP content, and CYP2C9 functions as a major enzyme that participates in the metabolism of various drugs, 41 including warfarin, non-steroidal anti-inflammatory drugs, phenytoin, etc.. This protein was also associated with the bioactivation of carcinogens. 41 A recent study elucidated the mechanism of CYP2C9 regulation; suppression of CYP2C9 by hsa-miR-128-3p was significantly correlated with HCC pathogenesis. 42 By using bioinformatics analysis, another study revealed that CYP2C9 promoted the development of HCC and might serve as a potential prognostic marker for liver cancer. 43 Taken together, these findings suggested CYP3A4 and CYP2C9 protein might be useful and reliable biomarkers for prognosis prediction of HCC.
In addition, metabolism-related genes of TKT were also identified as candidate genes associated with HCC prognosis. The molecular mechanism of TKT remains unclear in liver cancer. It is well known that cancer cells experience increasing oxidative stress and metabolic reprogramming; a previous study reported that TKT-encoded transketolase protein counteracted oxidative stress to drive cancer development by regulating NAPDH production. 44 Qin et al. revealed that TKT can promote HCC progression both in metabolic and a non-metabolic manner through nuclear localization and EGFR signaling pathway. 45 Moreover, in HBV-related HCC, the virus induced higher levels of SH2D5 that are capable of binding to TKT and leading to the promotion of cancer cell proliferation. 46
Univariate and multivariate analysis showed that 2 clinical characteristics (pathologic stage and PS model status) were associated with the prognosis of HCC. To assess the predictive ability of clinical factors, a nomogram model was constructed with 4 variables: pathologic stage, PS model status, and 3- and 5-year survival probability. A previous study reported that a multiple factor-based nomogram combined with prognostic score could predict the survival of gastric cancer patients with adjuvant chemotherapy. 47 The factors included inflammatory, nutritional, and preoperative prognostic markers. Recently, Huang et al. designed a nomogram model consistent with factors of molecular markers and TNM staging, and this model could predict the overall survival of HCC patients. 48 However, the present nomogram in our study showed the AUC value of 2 factor-based ROC was 0.837, which is high specificity and sensitivity. Therefore, the development of a nomogram with 2 clinical factors may facilitate the prediction of overall survival for HCC patients.
There are some limitations in this study. For example, the number of individuals was small, and more patients derived from multiple clinical centers should be used to validate the performance of the prediction model. Second, the molecular mechanisms of optimum DEGs also need to be further explored and experimentally validated.
In summary, this study developed a novel useful prognostic model for the identification of biomarkers and independent clinical factors with prognostic values in HCC. CYP2C9, CYP3A4, and TKT were correlated to the prognosis of liver cancer patients; these genes might be reliable tumor biomarkers for HCC prognosis prediction.
Footnotes
Funding:
The author(s) disclosed receipt of the following financial support for the research, authorship, and/or publication of this article: This study was funded by Ningbo Clinical Research Center for Digestive System Tumors (No.2019A21003), Ningbo Medical Science and Technology Foundation (No.2018A67) and Research Foundation of Hwa Mei Hospital, University of Chinese Academy of Sciences (No.2018HMKY03).
Declaration of conflicting interests:
The author(s) declared no potential conflicts of interest with respect to the research, authorship, and/or publication of this article.
Author contribution
SX, JY and MS designed the research; HY and SC acquired the data; XL, HY and MS analyzed and interpreted data. SX obtained the funding. JY drafted the manuscript. SX revised the manuscript for important content. All authors read and approved the final version of the manuscript.