
Abstract
Many antibacterial drugs have multiple mechanisms of resistance, which are often represented simultaneously by a mixture of resistance mutations (some more frequent than others) in a clinical population. This presents a challenge for Genome-Wide Association Studies (GWAS) methods, making it difficult to detect less prevalent resistance mechanisms purely through (weak) statistical associations. Homoplasy, or the occurrence of multiple independent mutations at the same site, is often observed with drug resistance mutations and can be a strong indicator of positive selection. However, traditional GWAS methods, such as those based on allele counting or linear regression, are not designed to take homoplasy into account. In this article, we present a new method, called ECAT (for Evolutionary Cluster-based Association Test), that extends traditional regression-based GWAS methods with the ability to take advantage of homoplasy. This is achieved through a preprocessing step which identifies hypervariable regions in the genome exhibiting statistically significant clusters of distinct evolutionary changes, to which association testing by a linear mixed model (LMM) is applied using GEMMA (a well-established LMM-based GWAS tool). Thus, the approach can be viewed as extending GEMMA from the usual site- or gene-level analysis to focusing on clustered regions of mutations. This approach was evaluated on a large collection of more than 600 clinical isolates of multidrug-resistant (MDR) Mycobacterium tuberculosis from Lima, Peru. We show that ECAT does a better job of detecting known resistance mutations for several antitubercular drugs (including less prevalent mutations with weaker associations), compared with (site- or gene-based) GEMMA, as representative of existing GWAS methods. The power of the multiphase approach in ECAT comes from focusing association testing on the hypervariable regions of the genome, which reduces complexity in the model and increases statistical power.
Introduction
Several methods have recently been developed for identifying genetic variants (mutations) associated with phenotypic traits in bacteria, such as drug resistance, host specificity, and virulence in bacteria.1,2 This has led to the discovery of new mechanisms of resistance from the analysis of single-nucleotide polymorphisms (SNPs) in collections of genome sequences from drug-resistant clinical isolates of bacterial pathogens.3-5 One approach to inferring the relationship between genotypes and phenotypes is Genome-Wide Association Studies (GWAS). A commonly used GWAS approach tests whether one allele at a polymorphic site is overrepresented in cases than controls using contingency table tests, such as chi-square test or Fisher exact test. 6 Another approach to GWAS uses linear regression to fit a predictive model for phenotypes by regressing against genotypes. The coefficients in the linear model (LM) reflect statistical correlations between the presence of an allele and the occurrence of a particular phenotype. Coefficients in the LM are fit for each SNP and drug combination in parallel, which are then tested for significance, for example, using a Wald test.6,7 The GWAS methods have been adapted for bacteria by incorporating genetic relatedness relationships in the form of a kinship matrix as random effects in a linear mixed model (LMM), to account for the more clonal nature of prokaryotes over eukaryotes (ie, population structure). 8 Similarly, bugwas incorporates lineage-specific effects into an LMM by decomposing the kinship to principal components. 9 The lineage-specific effects could also be estimated by pyseer using multidimensional scaling of a distance matrix as a covariate in a regression model. 10
As an alternative approach to GWAS, phylogeny-based approaches have also been developed, including PhyC, 11 PhyOverlap, 4 and TreeWAS. 12 The advantage of phylogeny-based methods over LMMs is that they look at individual mutation events based on a phylogenetic tree, accounting for the evolutionary relationships among strains, rather than just calculating statistics based on raw proportions (overlap) of strains with a particular allele. PhyC (Phylogenetic Convergence test) uses a permutation test to determine the significance of association of observed nucleotide changes at a site (on branches inferred in a phylogenetic tree) and acquisition of resistance (inferred at internal nodes using maximum parsimony) by computing how likely this observation would occur by chance. 11 Still, another approach that has been proposed is k-mer-based methods,13-15 which analyze the association of short nucleotide fragments (20-30 bp [base pairs] sequences, possibly including SNPs) with phenotypes. Machine Learning algorithms such as random forests and gradient-boosting have been used to identify k-mers that are significantly associated with drug resistance phenotypes and predictive of minimum inhibitory concentrations (MICs), as was applied to identify antibacterial resistance mutations in Salmonella. 15 In addition, rule-based learning models employing decision trees and logical rules are developed for k-mer-based bacterial GWAS. 16
Most of the methods above focus on identifying the strongest effects independently and work best when there is a single (or dominant) well-defined genetic explanation for a given phenotype. However, drug resistance can be multifactorial. There can be multiple mechanisms of resistance (loss of activators, upregulation of efflux pumps or detoxification enzymes, adaptations in the metabolic network, changes in cell wall permeability, etc.),17-19 along with compensatory mutations 20 and epistatic effects, 21 leading to a mixture of resistance-associated sites with weak signals (because, individually, they each are only a partial explanation of the phenotype). Using a “burden test” can help by combining multiple allelic sites within a gene, which are pooled before the association test.22-24 This can strengthen the association by pooling together mutations at several distinct nucleotides (eg, corresponding to multiple amino acids in an active site) that can confer resistance, but a burden test also risks diluting the signal by combining with other nonresistance-related mutations in the gene.
An approach to increasing these signals and improving the detection of genotype-phenotype associations over these prior methods is to take into account homoplasy. Homoplasy occurs when the same mutation arises independently in different lineages (branches of the evolutionary tree). Homoplasy can be a strong indicator of positive selection. 25 For example, it has been widely observed that mutations in catalase (KatG S315T) and RNA polymerase (RpoB S450L) have occurred multiple times independently in Mycobacterium tuberculosis, even within outbreak regions, and are not just inherited through transmission of a single clone.11,26,27 Grandjean et al detected homoplasic polymorphisms across the entire M. tuberculosis genome using a convergence method based on the disruption of a phylogenetic tree. Many well-known drug-resistant loci are observed as being homoplasic among the data set of a high proportion of multidrug-resistant (MDR) M. tuberculosis strains, 28 suggesting they are under selection pressure. Although not all homoplasy is due to drug resistance, we show it can be exploited to enhance association testing.
The LMM-based GWAS methods are not generally designed to take homoplasy into account. The statistical association between alleles and phenotypes is generally assessed without regard to the number of (inferred) mutational events that produced the allele, and hence these methods are not directly sensitive to signals of selection pressure. To identify regions harboring mutations under selection pressure, we propose a method for identifying regions with clusters of mutations as a preprocessing step to association testing. Mutations are treated not just as allelic sites, but as distinct evolutionary changes inferred phylogenetically. The significance assessment of such clusters is based on the assumption that genomes evolve generally under neutral theory, with mutations occurring spontaneously in random locations distributed throughout the chromosome. The null hypothesis is that mutations/nucleotide substitutions occurring within a given span of sites in the DNA sequence follow a Poisson distribution (allowing for variations in the local mutation rate 29 ). If nucleotide substitutions observed in a region (as distinct evolutionary events) are more abundant than expected, then the mutations are unlikely to have occurred by chance within the region, and the clustering of mutations within the region suggests the effects of positive selection. By evaluating the local rate of changes (as opposed to polymorphic sites), homoplasic sites have an advantage, and indeed, even a single site with multiple changes could appear significant compared with other clusters of SNPs spanning larger regions. The significant clusters can then be tested for association with the phenotype by LMM-based GWAS via a burden test. The advantages of this approach over conventional GWAS methods are as follows: (1) the cluster analysis allows association testing to focus on regions of evident variability, rather than testing either all individual sites (typically tens-of-thousands) or all genes (thousands); (2) regions can be of varying size (eg, focusing on just the most variable portions of a gene, rather than requiring a burden test on all SNPs in the whole open reading frame [ORF]); and (3) the identification of a small subset of variable regions throughout the genome for testing increases the statistical power by reducing the total number of genes/regions that have to be analyzed, which affects the sensitivity during post hoc multiple-tests correction (P value adjustment to control the overall false discovery rate [FDR] 30 ).
In this article, we describe a new approach called ECAT (Evolutionary Cluster-based Association Test) that is an adaptation of LMMs to incorporate homoplasy information for enhancing the identification of genes associated with drug resistance. ECAT involves 3 phases. First, the nucleotide changes at each polymorphic site are inferred by mapping them (using maximum parsimony) onto a phylogenetic tree constructed from the genome sequences of a collection of clinical isolates. Second, the changes are clustered to identify a subset of loci exhibiting a local excess of mutations. Here, homoplasy is exploited to increase the detection of clustered (ie, hypervariable) regions. Third, the clustered regions are analyzed for association with a drug resistance phenotype using an LMM (with mutations combined in each clustered region by simple collapsing). We show that this approach is effective in identifying known genes implicated in drug resistance for in a collection of drug-resistant clinical isolates of M. tuberculosis (Mtb). We show that ECAT outperforms traditional LMM-based GWAS approaches (represented by GEMMA) by detecting associations of some drug resistance loci not identified by site-based or gene-based analyses.
Materials and Methods
Genomic data preprocessing for empirical data sets
We start by assembling each genome in the collection using a comparative assembly approach by aligning all reads (.fastq files) to a reference genome using BWA (Burrows-Wheeler Aligner). 31 We exclude mixed, contaminated or low-coverage (<×30) strains. Next, we call genetic variants of polymorphisms (nonsynonymous and synonymous) and short indels (<10 bp, extracted from .sam files) from the assembled genome for each strain using in-house scripts. Then, we obtain a multiple sequence alignment of SNPs and indels, ignoring those that are ambiguous (<70% base-call homogeneity), in repetitive regions, or in regions with large-scale deletions in some strains. Small indels (<10 bp) with the same sequence and coordinates are identified together. Finally, we build a phylogenetic tree based on SNPs using a maximum parsimony method. 32
Three-phase ECAT
The ECAT involves 3 phases, including homoplasy signals inference, clustered region identification, and association testing. It first computes the homoplasy count for each polymorphic site, then identifies the clustered regions based on the homoplasy counts (using the Poisson distribution), and finally tests the associations between the clustered regions and resistance to a drug of interest (using an LMM). Given a data set of t strains of a genome of size n bp and a total of m polymorphic sites, ECAT takes 2 input files that include a multiple sequence alignment of nonsynonymous SNPs or small indels, and a phylogenetic tree built from both synonymous and nonsynonymous SNPs. The details of the 3 phases of ECAT are described as follows.
Phase 1: homoplasy inference
In the first phase of ECAT, we infer the degree of homoplasy for each polymorphic site by calculating a homoplasy index (HI) as the number of evolutionary changes inferred at each site.
33
Homoplasy index (HI) is defined as one plus the difference between the number of actual changes


Phase 2: clustered regions identification
To identify the clustered regions based on homoplasy locally, we use a Poisson distribution for detecting hypervariable clusters proposed by Wagner.
29
Given m mutations occurring in a genome of n nucleotides, the mutation rate
where
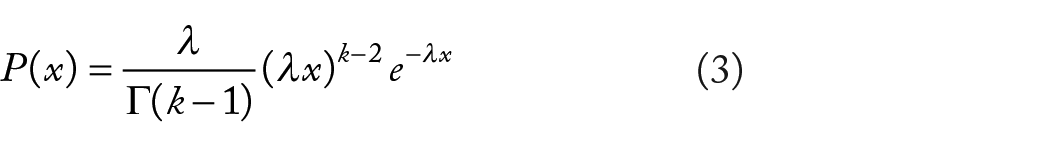
The probability of k mutations occurring within regions smaller than the size of

Here, in the second phase of our model, the probability of k evolutionary changes (sum of homoplasy indices,
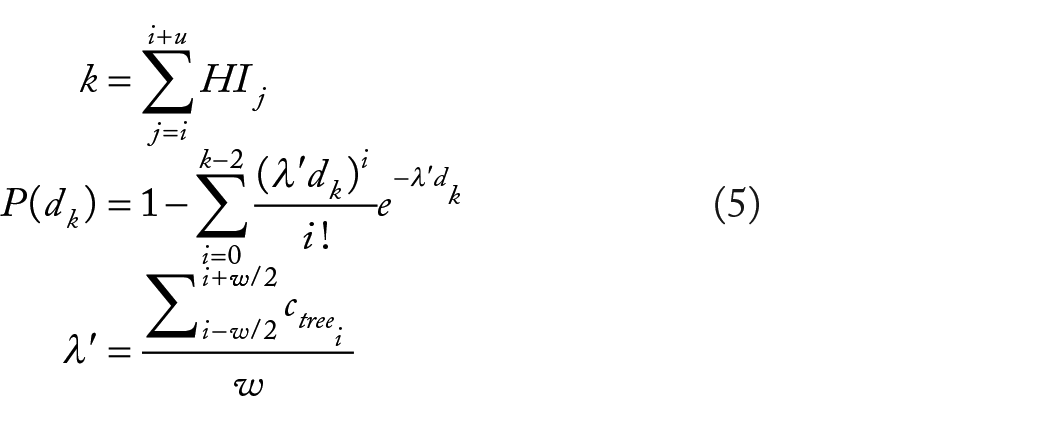
where
For each polymorphic site across the genome, we group adjacent sites up to a given span of SNPs as a region and calculate its probability using equation (5). The maximum size of the sliding window of SNPs, u is determined by the mutation rate and the average size of genes in the data set. We compute the expected number of SNPs in the largest genes in the genome. The size of the largest genes is estimated as the mean size plus 2 standard deviations (to exclude outliers). For example, in M. tuberculosis, given the overall mutation rate and gene-size distribution, we estimate that most genes will have at most 17.2 polymorphic sites on average. (In our experiments below, we test all windows of size 1-20 consecutive SNPs for each site to identify hypervariable regions.) For multiple test correction, the P values are adjusted for a 5% FDR using the Benjamini-Hochberg procedure.
30
We sort all regions by the adjusted P values
The analysis of SNP clusters is illustrated in Figure 1 for a 200 kb region in the M. tuberculosis genome. The green bars represent the local mutation rate in overlapping windows of 10 consecutive SNPs. The black bars stand for the homoplasy indexes (number of evolutionary changes) for all polymorphic sites. The yellow line represents the average mutation rate (smoothed over 100 kb). It increases slightly from the left to the right of the region, which shows the advantage over using a smoothed average over a single, global mutation rate. The dashed red line represents the significance threshold using a P value cutoff of .003125 (

Analysis of single-nucleotide polymorphism (SNP) clusters in a 200 kb region. The green bars represent the local mutation rate and the black bars stand for the homoplasy indexes. Only regions where the local density of nucleotide changes exceeds the significance threshold (dashed red line) based on the Poisson distribution with the average mutation rate (yellow line) would be considered for association testing with drug resistance phenotypes.
Phase 3: association tests
In the third phase of ECAT, we test associations of clustered regions identified from the second phase against phenotypes of antibiotic resistance using an LMM. 7 As both homoplasic and nonhomoplasic polymorphic sites are used to identify hypervariable regions, clusters derived from phase 2 may include several polymorphic sites of HI = 1 within a small span of gene/intergenic region, or an individual site with a relatively high HI (HI > 1), or a region consisting of both sites with HI = 1 and HI > 1. The genotypes of clusters are determined by grouping allelic sites within each cluster using a binary collapsing method (burden test), which is categorized to the allele counting methods. Hence, correcting for the population structure is needed in this phase for association tests to discount mutations shared by genetically similar members of the population.
To correct for population stratification, regression-based methods could employ covariates in the regression models to account for structure effects. Among commonly used regression-based methods, LMMs are able to account for confounders using both fixed effects (covariates) and random effects (kinship/genetic relatedness). Thus, an LMM-based approach was chosen for performing association tests in this phase. The LMM implemented in GEMMA 7 was shown to perform better than the linkage agglomerative clustering approach in PLINK 6 and the dimensionality reduction method in pyseer 10 for controlling cofounders in terms of precision, recall, and F1 scores. 35 Hence, GEMMA is chosen as a foundation for evaluating statistical significance of clustered regions in ECAT.
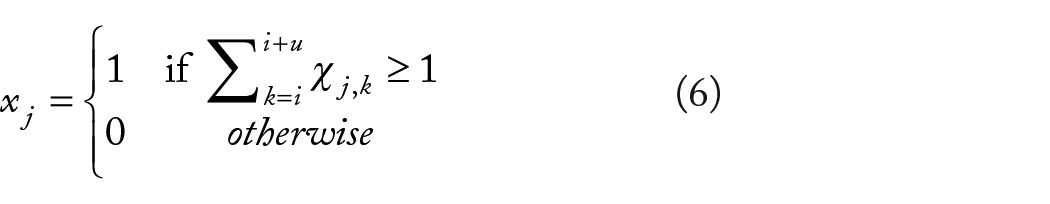
For each clustered region, polymorphic sites are pooled within the region. If a strain that has at least one mutation among the sites within the boundaries of the region, the genotype of the strain within the region will be marked as having a mutation. The character state of strain j at site i
The significance of the association between a clustered region and a particular phenotype of n individuals such as drug resistance is determined by the Wald test using GEMMA. 7 GEMMA solves the following linear equation:
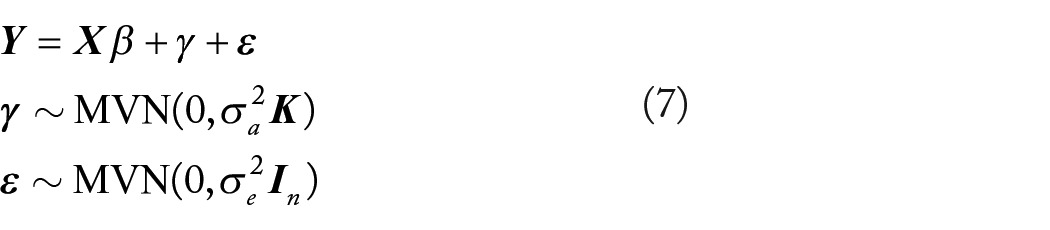
where MVN is a multivariate normal distribution,
Our 3-phase evolutionary cluster-based algorithm is summarized in Figure 2.
ECAT algorithm: 3-phase Evolutionary Cluster-based Association Test.
Results
Mycobacterium tuberculosis
Genetic variants, lineages distribution, and antitubercular drugs
To evaluate the ECAT method, we analyze a data set of 660 clinical isolates of M. tuberculosis with drug susceptibility data for 7 antibiotics.
5
Mycobacterium tuberculosis is the causative agent of tuberculosis (TB) that primarily infects the human lung. The M. tuberculosis genome is about 4.4 Mb in size and is believed to be highly clonal, with little evidence of recombination among isolates
36
and low genetic diversity worldwide.37,38 To treat TB infection, current antitubercular drugs include 5 first-line drugs and several second-line drugs. The 5 first-line drugs are isoniazid (INH), rifampicin (RIF), streptomycin (STR), ethambutol (EMB), and pyrazinamide (PZA). Other second-line drugs include fluoroquinolones (ofloxacin, levofloxacin, moxifloxacin, and ciprofloxacin), ethionamide (ETH),
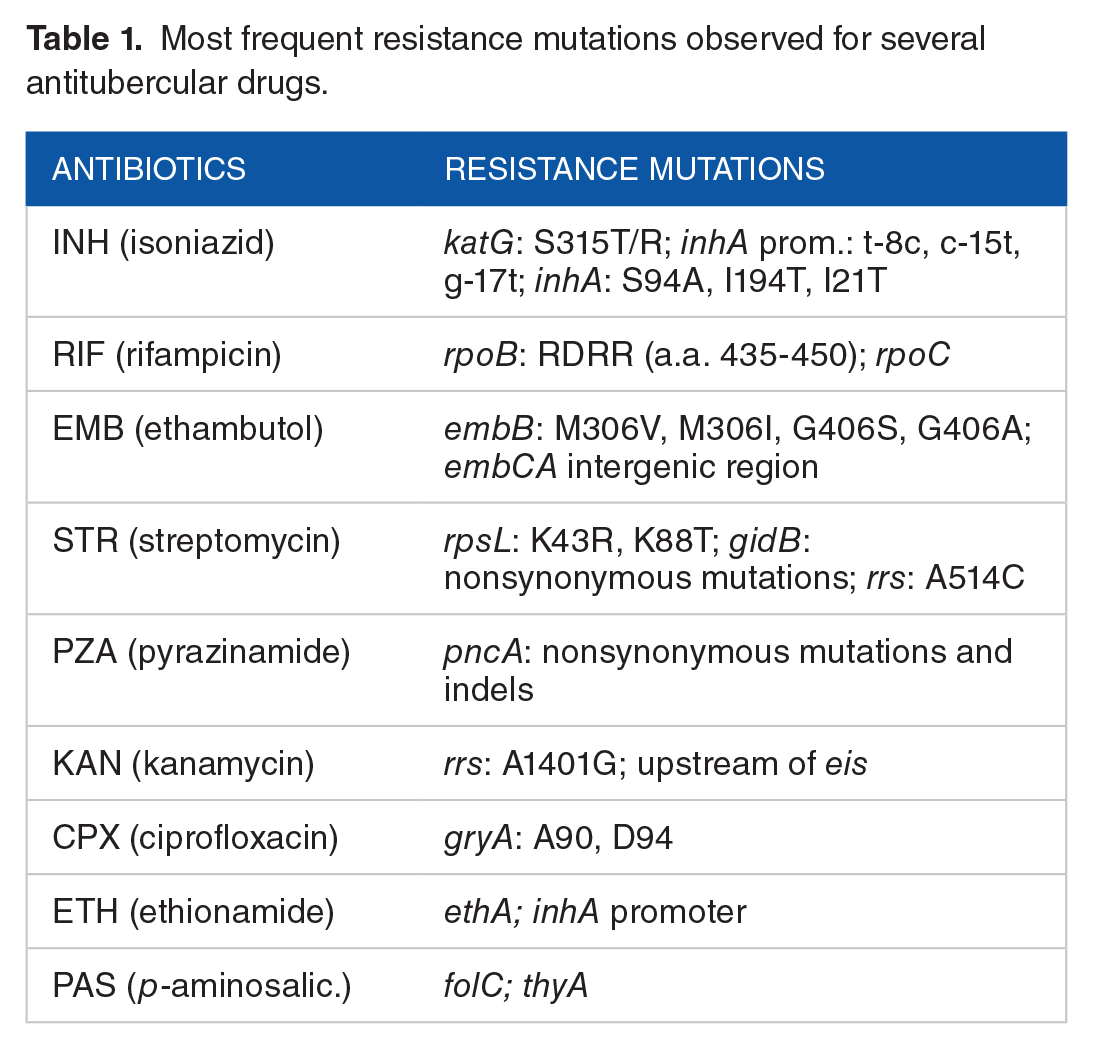
Most frequent resistance mutations observed for several antitubercular drugs.
We ran ECAT on an empirical data set of M. tuberculosis clinical isolates from Lima, Peru (BioProject: PRJNA343736), which includes many MDR strains. 5 An MDR-TB strain is defined as being resistant to both INH and RIF, the 2 first-line antitubercular drugs, and many isolates are resistant to additional drugs. We collected a subset of 660 strains with drug susceptibility data for 7 antibiotics. The proportions of drug susceptibility for INH RIF, EMB, STR, PZA, KAN, and CPX (ciprofloxacin) are shown in Figure 3A. A heatmap of the correlations between pairs of antitubercular drugs is shown in Figure 3B. The correlation coefficients between many pairs of first-line drugs are larger than 0.5, suggesting that they have a high degree of overlap among resistant strains (ie, co-resistance), which is likely due to transmission of several MDR clones in the region. The highest correlation, between INH and RIF resistance, is 87%.

(A) Proportion of drug-resistant strains for 7 antitubercular drugs. The proportion ranges from 18.2% (CPX) to 40.8% (INH). KAN and CPX are available for only a subset of 286 strains. (B) Heatmap plot of pairwise correlations between drugs. Each cell represents the correlation between a pair of drug susceptibilities. Darker green presents stronger co-resistance between drugs for strains. The correlation between INH and RIF is 0.87, suggesting that many strains are resistant to both INH and RIF or sensitive to both of the drugs. CPX indicates ciprofloxacin; EMB, ethambutol; INH, isoniazid, KAN, kanamycin; PZA, pyrazinamide; RIF, rifampicin; STR, streptomycin.
We aligned the genome sequences of the 660 isolates against the reference genome, H37Rv (GenBank: NC_000962.2), using MUMmer. 40 We obtained 22 441 polymorphic sites in the alignment where 15 485 are nonsynonymous, excluding gaps, ambiguous sites, and repetitive regions (including PPE and PE_PGRS genes). The overall mutation rate is 0.0051 per nucleotide (22 441 SNPs/4 411 532 bp). Only 1776 sites are homoplasic throughout the genome. All polymorphic sites, excepting well-known drug-resistant loci (Table 1), were used to estimate the phylogeny by maximum parsimony using PAUP. 32 We determined the family/lineage of each strain by examining lineage-specific biomarkers. 41 The phylogenetic tree labeled with lineages is shown in Figure 4, where most strains are categorized to lineage 2 (Beijing) or lineage 4 (LAM, Haarlem, X-clade, and T-clade).

Phylogenetic tree and the distribution of lineages of 660 clinical isolates from Peru. The number of isolates and labeling color for each lineage is as follows: Red: Beijing (78); green: LAM (255); purple: Haarlem (167); blue: T-clade (82); orange: X-clade (42); yellow: H-clade (2); none: unrecognized (34).
Identification of optimized clusters of SNPs
Mycobacterium tuberculosis exhibits a global mutation rate of approximately 5 SNPs per kilobase (0.005 per nucleotide) in this data set. By applying the Poisson model to the homoplasy indices of nonsynonymous polymorphic sites in sliding windows of 20 SNPs, we obtained 596 clustered regions where the adjusted P values are less than .05 (Supplemental Table S1). The occurrence of clustered regions across the entire genome is shown in Figure 5. The median size of the clustered regions is 11 bp (range: 1-3397 bp, 75th percentile: 81 bp). Several well-known drug-resistant loci are represented by clusters and found to be highly homoplasic, including the genes gyrA, embB, rpoB, rpoC, katG, rpsL, gidB. As an example, rpoB has a region with 111 changes spanning 1066 bp (encompassing the Region Determining Rifampicin Resistance, RDRR), implying a local mutation rate of 0.104 per nucleotide. We also identify some noncoding regions that are homoplasic and involved in antitubercular resistance such as inhA promoter region (Rv1482c-fabG1, coordinate: 1673423-1673432), the upstream of eis (coordinate: 2715340-2715346), and the intergenic region of embC-embA (coordinate: 4243217-4243228). Not all homoplasic sites are associated with drug resistance. For example, the gene lldD2 is also identified as a homoplasic cluster, though it does not have any known relation to drug resistance. 42 These regions have a local excess of changes (phase 2 of ECAT), though they turn out not to be significant when assessed for association with drug-resistant phenotypes (phase 3).

Manhattan plot showing nonoverlapping clustered regions across the genome in Mycobacterium tuberculosis. Clustered regions that involve known loci associated with INH, RIF, EMB, STR, and other drug resistance are labeled in red, blue, green, orange, and black, respectively. If multiple clusters in a gene are identified, only the most significant cluster is shown in the plot. EMB indicates ethambutol; INH, isoniazid, KAN, kanamycin; RIF, rifampicin; STR, streptomycin.
Association test for clustered regions for individual drugs
The third phase of ECAT is to perform association testing on regions against resistance to individual drugs, as not all clustered polymorphic regions are associated with drug resistance (eg, lldD2). We test the association of antibiotic resistance with clustered regions by an LMM, controlling for confounders, using GEMMA. 7 For calculating the genetic relatedness matrix, we exclude SNPs at the canonical drug-resistant loci such as katG, rpoB, embB (loci listed in Table 1). We evaluate the performance of our method by comparing the results with GEMMA using genotypes defined at the individual site or gene levels. To assess the effect of LMM-based stratification corrections, we also apply an LM without controlling for any confounders (an accessory function implemented in GEMMA) on the same data set for association tests, and then compare their performance on correcting population stratifications.
Clustering enhances the detection of compensatory mutations in rpoC associated with RIF resistance
Rifampicin is a first-line antitubercular drug that inhibits DNA-dependent RNA synthesis (transcription). It binds to the
Summary of analyses of loci associated with rifampicin resistance by 3 statistical methods.

Adjusted P values for the highest-ranked region or site with each locus are given, along with rank (in parentheses). Significant associations are boldfaced in red.
Abbreviation: ECAT, Evolutionary Cluster-based Association Test.
Figure 6A shows that there are 35 nonsynonymous polymorphic sites in the rpoB gene from codons P45S to K832E, and 9 SNPs are located in the RDRR region (codons 435-450). Our ECAT test identified 3 clustered regions in rpoB from phase 2, and 2 of them are found to be strongly associated with rifampicin resistance in phase 3, codon S450L by itself, and the group of 12 polymorphic sites from S428R to S450T that covers the RDRR region (see Table 3). S450L is highly homoplasic, with 66 changes. For the second region (S428R-S450T), there are 44 changes over 12 polymorphic sites, which is highly significant by the Poisson distribution. In the site-based analysis, codons D435V and S450L are identified to be associated with RIF resistance

The distributions of homoplasy index for each polymorphic site in the genes (A) rpoB, (B) rpoA, and (C) rpoC. The y-axis presents number homoplasy index and the x-axis represents the amino acid position. A codon exhibiting more than 1 change (homoplasic site) is labeled in text. Clusters are boxed with solid blue borders for significant associations with rifampicin (RIF) resistance and dashed red borders for nonsignificant ones.
Association of RIF resistance and genetic variants in regions identified by ECAT for Mycobacterium tuberculosis.

The dashed line shows the significance threshold for FDR < 0.05.
Mutations known or suspected to be relevant to RIF resistance are bold-faced.
Abbreviations: ECAT, Evolutionary Cluster-based Association Test; FDR, false discovery rate; RIF, rifampicin.
For rpoC, it exhibits 45 nonsynonymous SNPs from codons A17T to V1252L, where 9 SNPs are homoplasic and distributed throughout the gene at codons V483G, I491V, L507V, V517L, L527V, N698S, A734V, P1040A, and V1252L (Figure 6C). Codon V483G has the highest homoplasy, with 10 changes. We identified 5 clustered regions, including regions Q479R-A492P, L507V-L527V, V1039G-P1040R, and 2 sites by itself, N698S and V1252L. The region Q479R-A492P is identified to be strongly associated with RIF resistance (
None of the 3 methods detects the association of mutations in
Thus, for cases such as rpoB, where changes in an individual site are abundant enough to be strongly linked with resistance, our cluster-based method performs as well as other methods in terms of identifying the best grouping of SNPs that maximizes the association. For other cases such as rpoC and rpoA, where changes at an individual site are not enough to be identified from the association test, optimal grouping of SNPs within a clustered region helps identify resistant-related mutations (Table 4).
Summary of analyses of loci associated with ethambutol resistance by 3 statistical methods.

Adjusted P values for the highest-ranked region or site with each locus are given, along with rank (in parentheses). Significant associations are boldfaced in red.
Abbreviation: ECAT, Evolutionary Cluster-based Association Test.
Clustering enhances the detection of secondary resistance mutations associated with ethambutol
Ethambutol is a first-line drug involved in the inhibition of cell wall synthesis by targeting arabinogalactan biosynthesis (a cell wall glycolipid in M. tuberculosis). Mutations in the embB gene (especially codons 306, 406, and 497, which are the most frequent) are primarily responsible for mediating EMB resistance.47,48 Recently, it has been reported that mutations in the embC-embA intergenic region are also associated with EMB resistance with low frequency, and these have been shown to affect expression of genes in the embCAB operon. 49 embA, embB, and embC form a cell wall complex that is involved in transferring lipoarabinomannan (LAM) precursors to the outer membrane. Brossier et al 49 found that about 70% of ethambutol-resistant clinical isolates harbored mutations in embB and 15% of them had mutations in the embC-embA intergenic region (especially positions −8 to −21), affecting expression. Growing evidence suggests that ubiA is also associated with EMB resistance, especially high-level EMB resistance. 50 ubiA encodes a decaprenyl-phosphate 5-phosphoribosyltransferase in the pathway for synthesizing LAM. 51 All 3 GWAS methods detect the association between EMB resistance and embB and ubiA, but only ECAT detects the association with the intergenic region of embC-embA.
There are 31 nonsynonymous SNPs in the embB gene, and SNPs at codons M306 and G406 are highly homoplasic, with 51 changes and 16 changes, respectively (inferred from the tree using Sankoff’s algorithm) (Figure 7A). These 2 residues are each identified by ECAT as separate clustered regions in embB and are found to be strongly associated with EMB resistance (Table 5). They each consist of a pair of adjacent nucleotides with many inferred changes, producing small clusters which are statistically significant due to homoplasy. On testing for association with EMB resistance, the ranks of the regions at codons 306 and 406 are second and sixth with the adjusted P values 1.72 × 10−38 and 1.79 × 10⁻⁹, respectively. The other 2 methods (GEMMA applied to individual sites or collapsing them over the whole gene) capture the association between embB and EMB resistance as well (Table 6).
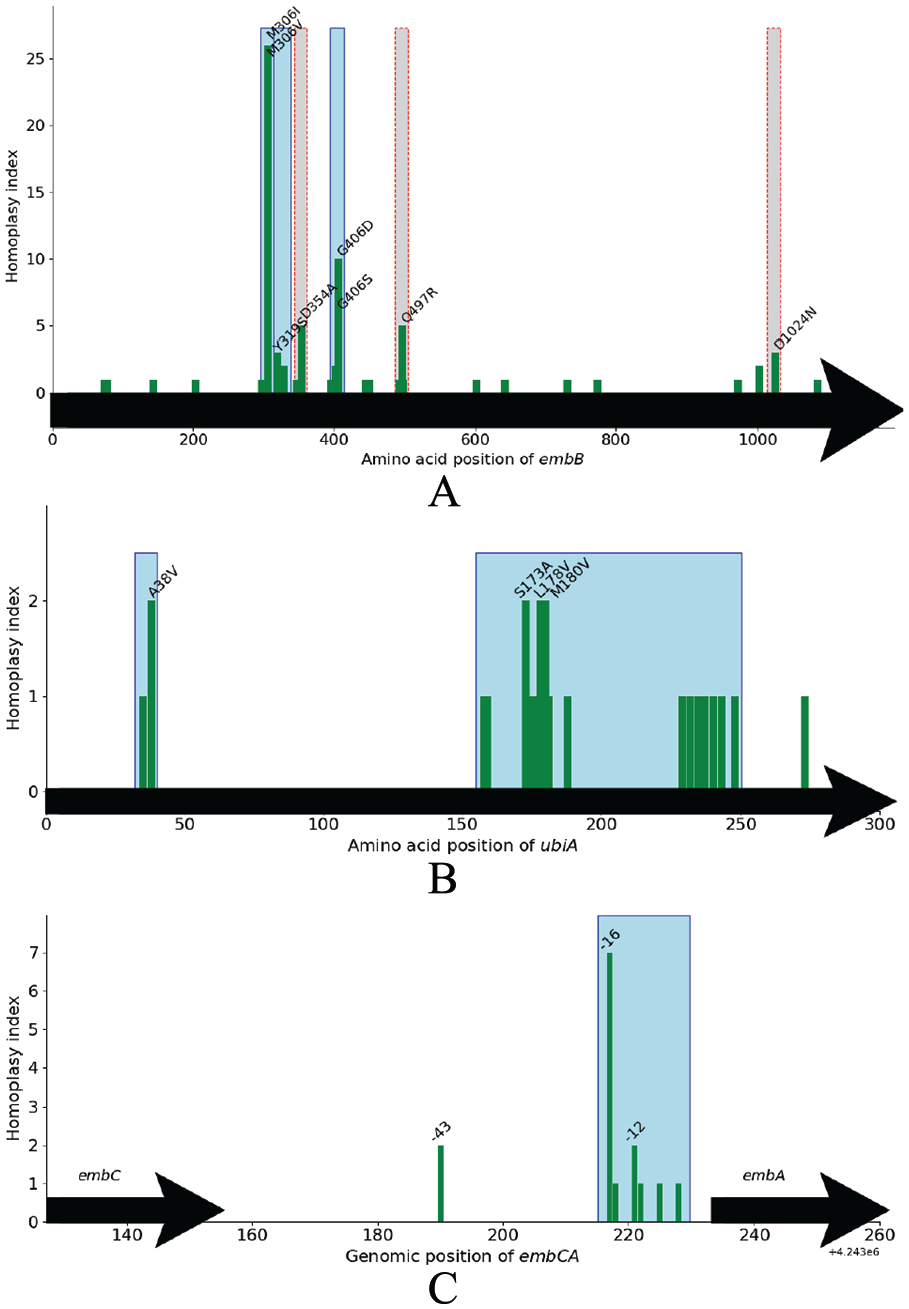
The distributions of homoplasy index for each polymorphic site in the genes (A) embB, (B) ubiA, and the intergenic region (C) embCA. The y-axis presents number homoplasy index and the x-axis represents the amino acid position. A codon exhibiting more than 1 change (homoplasic site) is labeled in text. Clusters are boxed with solid blue borders for significant associations with ethambutol (EMB) resistance and dashed red borders for nonsignificant ones.
Association of EMB resistance and genetic variants in regions identified by ECAT for Mycobacterium tuberculosis.

Mutations known or suspected to be relevant to RIF resistance are bold-faced.
Abbreviations: ECAT, Evolutionary Cluster-based Association Test; EMB, ethambutol.
Summary of analyses of loci associated with streptomycin resistance by 3 statistical methods.

Adjusted P values for the highest-ranked region or site with each locus are given, along with rank (in parentheses). Significant associations are boldfaced in red.
Seven polymorphisms exist within the embC-embA intergenic region spanning 39 bp from coordinates 4 243 190 to 4 243 228 (−43 to −5 bp upstream of embA), and 3 of the SNPs are homoplasic (see Figure 7C). In the second phase of ECAT, a clustered region is obtained consisting of 6 SNPs spanning 12 bp from coordinates 4 243 217 (−16) to 4 243 228 (−5). The region has 13 changes in total and is identified to be significantly associated with EMB resistance (
For the ubiA (Rv3806c) gene, there are 20 nonsynonymous SNPs from A35S to E273D spanning 717 bp, where 4 are homoplasic, including A38V, S173A, L178V, and M180V (Figure 7B). With ECAT, 2 clustered regions within ubiA are found to be associated with EMB resistance. The first region, F248L-L158S, consists of 18 SNPs spanning 272 bp and the second region clusters 2 codons A35S and A38V together. None of the mutations in ubiA is identified to be involved in EMB resistance by the site-based test in GEMMA with 5% FDR. The highest ranked site occurs at A35S with rank = 45 and
Overall, our ECAT method detected associations between EMB resistance and mutations in embB, the intergenic region of embC-embA and ubiA, whereas other methods (site-based and gene-based analyses with GEMMA) failed to identify the association of the embC-embA intergenic region with EMB resistance. The failure of site-based and gene-level GWAS analysis is likely due to low allele frequency, whereas ECAT takes advantage of clustering sites together optimally to enhance significance.
Clustering helps identify the role of gidB in streptomycin resistance
Streptomycin is a first-line anti-TB drug that binds to ribosomal protein S12 and the 16S ribosomal RNA (rrs) to inhibit translation (protein synthesis). Resistance to streptomycin is mediated by nucleotide substitutions of A514C in rrs (16S rRNA) and codons K43R and K88T in rpsL (gene encoding the S12 ribosomal protein).52,53 Also, nonsynonymous mutations at gidB (a 16S rRNA methyltransferase) have been reported to confer streptomycin resistance. 54 The methylation of the ribosome is needed for optimal binding of streptomycin, so loss-of-function mutations in the methyltransferase mediate resistance to STR. While all 3 GWAS methods detect associations between streptomycin resistance and genes rpsL and rrs, gidB is harder to detect because mutations are spread throughout the gene, and are interspersed with nonassociated SNPs, for example, universal mutation S100F (relative to H37Rv) or lineage-specific mutations such as L16R and E92D.55,56 L16R is a marker of LAM strains, whereas E92D is a marker of Beijing family. 55
For rpsL, only 2 nonsynonymous SNPs are observed in the alignment, K43R and K88R/T. Both are homoplasic, with 11 and 6 changes at each site. As these 2 mutations occurring in rpsL are separated from each other by 135 bp, each is locally clustered by itself in the second phase of ECAT. In the third phase, the codon K43R is identified to be associated with STR resistance (rank = 5 and
Association of STR resistance and genetic variants in regions identified by ECAT for Mycobacterium tuberculosis.

The dashed line shows the significance threshold for FDR < 0.05.
Mutations known or suspected to be relevant to RIF resistance are bold-faced.
Abbreviations: ECAT, Evolutionary Cluster-based Association Test; FDR, false discovery rate; STR, streptomycin.
For the 16S rRNA, our ECAT method identifies the association between streptomycin resistance and A514C at rrs within a clustered region of 3 consecutive SNPs (a.a. C513T-C517T; rank = 12 and
Figure 8 shows the distribution of polymorphic sites in gidB, where 55 nonsynonymous mutations are spread out from codons L16R to L196F, spanning 542 bp. In total, 11 sites are homoplasic, where codons L145F and P75S are the top 2, with 5 and 4 changes, respectively. The ECAT detects a strong association of one clustered region within gidB, R96L-V65G (rank = 2 and

The distribution of homoplasy index for each polymorphic site in the gene gidB. The y-axis presents number homoplasy index and the x-axis represents the amino acid position. A codon exhibiting more than 1 change (homoplasic site) is labeled in text. Clusters are boxed with solid blue borders for significant associations with streptomycin (STR) resistance and dashed red borders for nonsignificant ones.
Effect of population stratification corrections
To characterize the effect of population stratification corrections on ECAT (which accounts for kinship relationships in an LMM), we compared it with the effect of an LM-based approach (without random effects) by applying an LM to regress genotypes against phenotype of interests directly without correcting for confounders based on genetic relatedness. This is achieved by running GEMMA in a mode in which it ignores the kinship matrix and does not attempt to estimate random effects. The significant hits estimated from both models using a cutoff of adjusted P values <.05 for associations between 3 types of genotypes and resistance to one of the drugs, RIF, EMF, or STR, are listed in Tables 8 to 10, respectively. When using an LM, the number of significant hits is much higher than the number of hits estimated from an LMM in general, regardless of genotype. The Quantile-Quantile plot (Q-Q plot) of associations between cluster-based genotypes and RIF resistance estimated from an LM is more inflated than the ones from an LMM (shown in Figure 9), suggesting a higher type I error rate. The Q-Q plots for site- and gene-based tests look similar.
Summary of total number of significant hits (adjusted P values < .05) from association tests between RIF resistance and 3 genotypes using LMM and LM models.

Abbreviations: ECAT, Evolutionary Cluster-based Association Test; LM, linear model; LMM, linear mixed model.
Summary of total number of significant hits (adjusted P values < .05) from association tests between EMB resistance and 3 genotypes using LMM and LM models.

Abbreviations: ECAT, Evolutionary Cluster-based Association Test; LM, linear model; LMM, linear mixed model.
Summary of total number of significant hits (adjusted P values < .05) from association tests between STR resistance and 3 genotypes using LMM and LM models.

Abbreviations: ECAT, Evolutionary Cluster-based Association Test; LM, linear model; LMM, linear mixed model.

The Quantile-Quantile plots (QQ plots) of unadjusted P values estimated from a linear model (LM) (labeled in red) and from a linear mixed model (LMM) (labeled in blue) for association tests between rifampicin (RIF) resistance and the cluster-based genotype.
Novel resistance mutations
In our analysis of the collection of MDR-TB clinical isolates from Peru, ECAT identified only 4 other loci potentially associated with resistance to one or more of the antitubercular drugs: spoU, idsA2, ppsA, and Rv2571c (see Table 11). In contrast, many of these associations were not identified by either site-based or gene-based approaches using GEMMA. The homoplasic mutations in spoU occur 20 bp downstream from the stop codon (potentially affecting transcriptional termination). The association is significant for resistance to RIF and EMB, and 20 out of 660 strains have such mutations. This association was also observed in another analysis of the same data set.
57
spoU is a putative tRNA/rRNA-methyltransferase. Currently, its role in drug resistance is not known, though the fact that spoU orthologs in other organisms can methylate the ribosome suggests a possible link to resistance to translation inhibitors.
58
idsA2 is a putative geranylgeranyl pyrophosphate synthetase, which is on the pathway for synthesis of cell wall glycolipids. It might be that these mutations affect cell wall permeability, which could explain how mutations in idsA2 associates with resistance to INH and EMB (though it is important to remember that there is a great deal of co-resistance in this data set, so it is difficult to say with certainty which specific drug idsA2 is associated with). Mutations in ppsA could have a similar effect on permeability, as this gene is involved in synthesis of PDIM (phthiocerol dimycocerosate), another cell wall glycolipid. For example, mutations in PDIM synthesis genes have been shown to confer resistance to pyrazinamide.
59
Perhaps the most intriguing case is Rv2571c, which is most strongly associated with EMB resistance
Summary of analyses of novel loci associated with antitubercular resistance by 3 statistical methods.
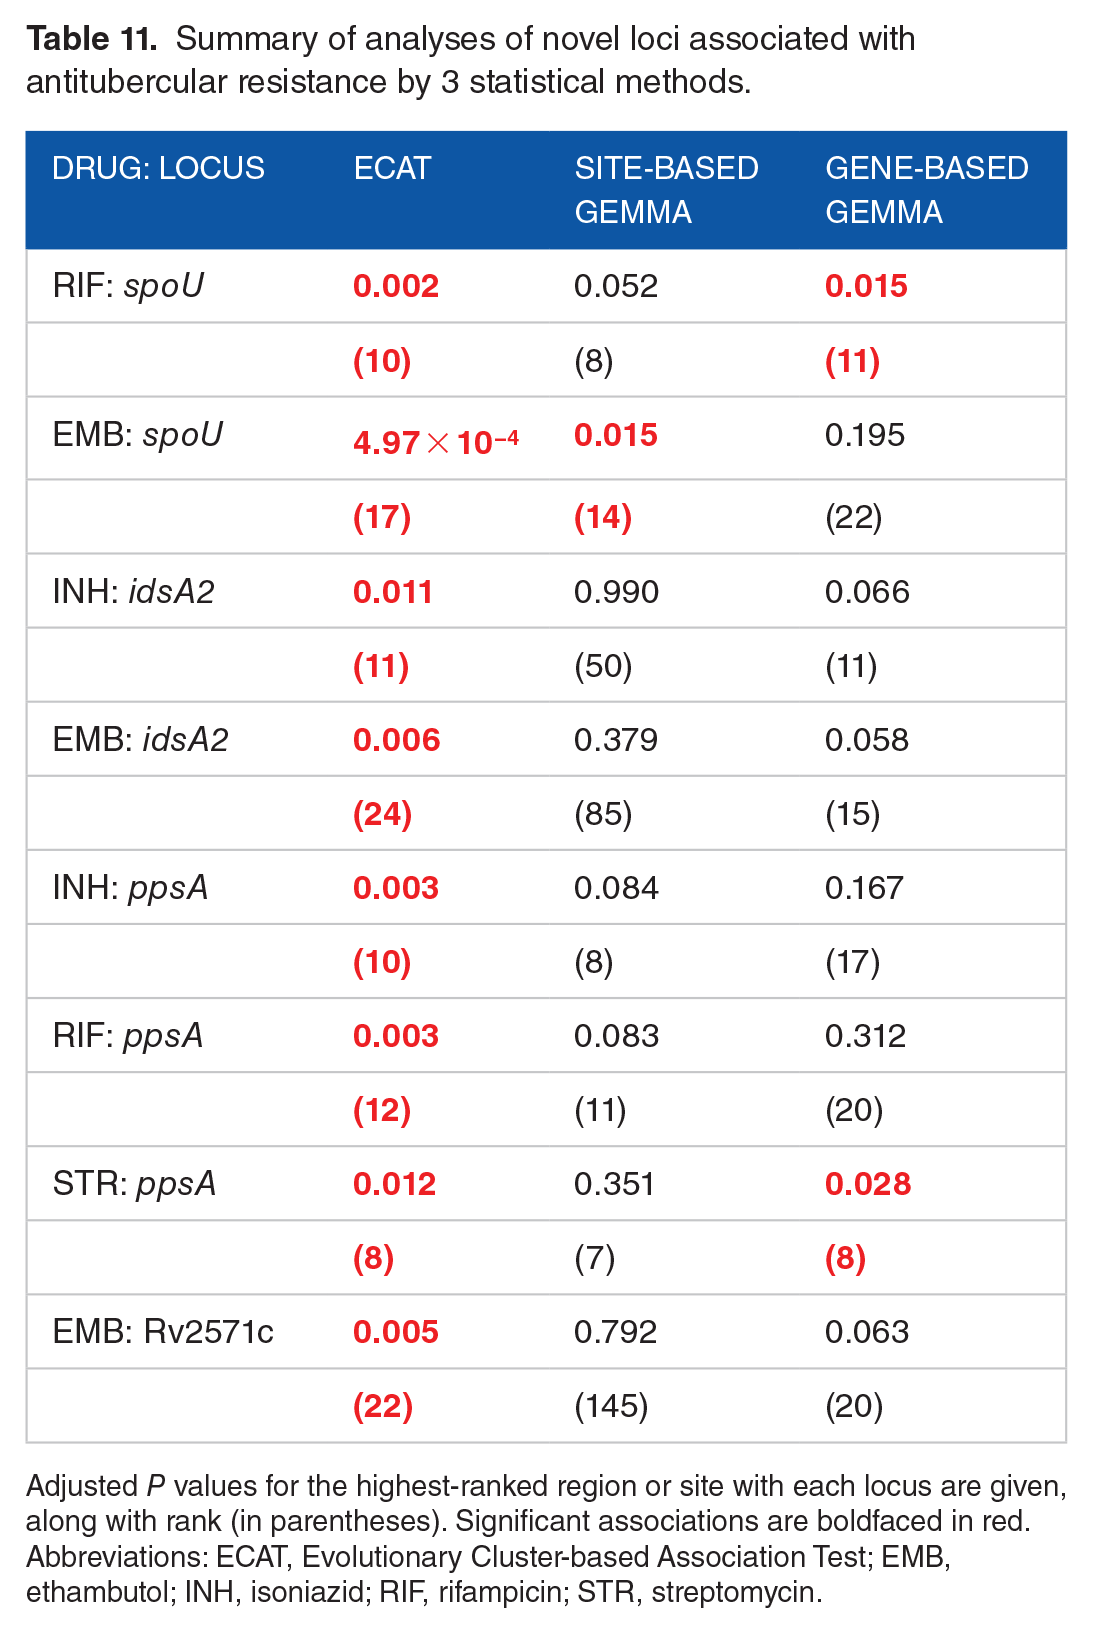
Adjusted P values for the highest-ranked region or site with each locus are given, along with rank (in parentheses). Significant associations are boldfaced in red.
Abbreviations: ECAT, Evolutionary Cluster-based Association Test; EMB, ethambutol; INH, isoniazid; RIF, rifampicin; STR, streptomycin.
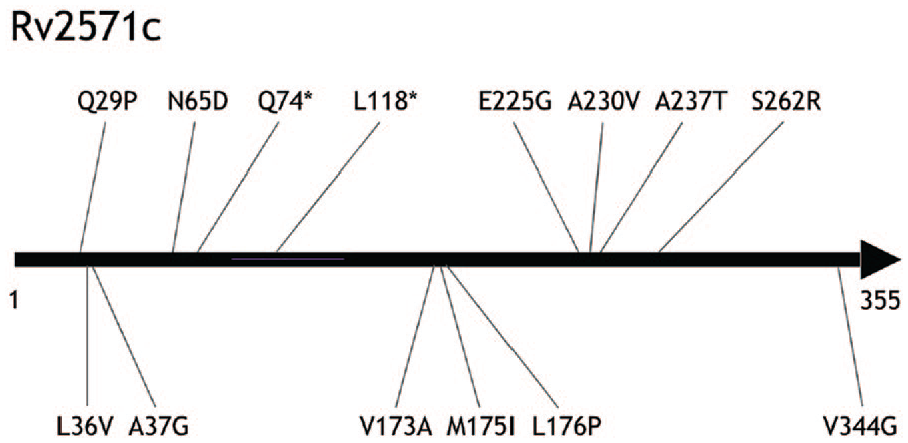
Relative locations of 14 observed changes within the Rv2571c in the data set of 660 strains from Peru. Rv2571c has 355 amino acids. Stop codons are marked with asterisks.
Discussion
We have presented a new method, called ECAT, to extend GWAS with the ability to take advantage of homoplasy. The motivation behind ECAT is that drug resistance mutations are frequently observed to occur multiple times independently in a clinical population, which is a strong indicator of positive selection. As traditional GWAS methods are not sensitive to this information, this was implemented via a preprocessing phase to identify significantly clustered regions of mutations (evolutionary changes), which are then subjected to association testing using an LMM. Importantly, the clustering step assesses the clustering of distinct evolutionary changes (inferred from a phylogenetic tree using maximum parsimony) rather than just polymorphic sites, so homoplasic sites (with multiple changes) are counted with higher weight. The boundaries of clusters are optimized to focus on just the most variable parts of genes, without limiting analysis to either individual SNPs or entire ORFs. In fact, some genes might not have any significant clusters, and hence do not need to included in association testing.
This approach has several advantages. First, the preprocessing step focuses the association testing on variable regions of the genome, which is where drug resistance mutations are expected to occur (at least in a collection of drug-resistant clinical isolates). It is more computationally efficient to evaluate only statistically significant clusters, rather than the naive approach of doing association testing on all sliding windows of SNPs throughout the genome. In our case, there were >20 000 allelic sites (and hence >400 000 possible overlapping windows of size 1-20), but only 596 regions were selected as significantly clustered (using the Poisson model). Filtering out regions without significant clusters of mutations also helps maintain sensitivity during the multiple-tests (FDR) correction at the end, as the association testing is only done on a small subset of hypervariable regions.
Second, the clustered regions can be of varying size. Traditionally, GWAS has been applied to individual sites (SNPs) or entire genes (ie, collapsing all SNPs together in an ORF, as often done with burden tests 22 ). However, resistance mutations for many drugs are often clustered within the target ORFs, such as in active sites. Often, there are only a handful of prevalent mutations in drug targets (such as the RDRR in RpoB [residues 435-450], and the Ala90-Gly94 region of GyrA), and the rest of the mutations in the ORF are not relevant to drug resistance (eg, lineage-specific mutations, like GyrA:S95A). The clustering approach we describe (second phase of ECAT) allows optimized local variable regions within ORFs to be singled out and tested for association, which can strengthen the signal.
Finally, because the clustering is based on distinct evolutionary changes, homoplasic sites have an advantage. A site with multiple changes (spanning just 1 bp) can often be significant on its own or can seed a cluster combined with other nearby changes (based on the Poisson distribution). This contrasts with traditional GWAS methods, such as those based on allele counting or LMs, which do not take into account the number of changes that led to an allelic site, and hence are insensitive to homoplasy.
The results obtained by ECAT on the M. tuberculosis data set from Peru show that most of the major known drug resistance mechanisms can be detected, including less prevalent ones not detected by GEMMA. In some cases, individual sites with high homoplasy are identified, such as KatG:S315T and EmbB:M306V/I. Similarly, RpsL:K43R and K88R/T are individually detected as significant for streptomycin resistance. In other cases, larger clusters of mutations are identified, such as the RDRR region in RpoB, as well as in RpoC. Mutations in the latter have been shown to be able to compensate for fitness costs of mutations in RpoB, though they are less frequent, making the statistical association harder to detect. The ECAT also detects an association of the intergenic region between embA and embC with resistance to ethambutol, which involves 6 allelic sites spanning 12 nucleotides (2 of which are homoplasic, representing a total of 13 distinct changes in this locus). Although substitutions in the embC-embA intergenic region are less prevalent than missense mutations in EmbB, they have also been shown to increase resistance to ethambutol through upregulating expression. 49 In still other cases, clusters of mutations can be spread throughout a gene, such as in PncA (activator of pyrazinamide) 62 and GidB (ribosome methyltransferase, which influences the binding of streptomycin). In such genes, resistance is typically conferred through disruption, that is, loss-of-function mutations, which can occur at many different positions in the ORF, making them difficult to detect through site-based analysis because; individually, they often occur at low allele frequencies and might be interspersed with other polymorphisms not relevant to resistance. However, gene-level analysis by tools like GEMMA force all mutations to be pooled in a burden test, even though not all mutations in such genes necessarily cause loss-of-function, diluting the signal.
The fact that, aside from these known resistance-associated mutations for TB drugs, only 4 other loci ( spoU, idsA2, ppsA, and Rv2571c) were identified as significantly associated with one of the 7 drugs in our data set suggests that the false-positive rate for ECAT is very low, which is a consequence of combining rigorous statistical filtering at both stages, clustering and association testing.
The ECAT method has several limitations. First, high levels of co-resistance among multiple drugs can cause ambiguity over which polymorphisms are associated with which drugs. In our MDR-TB data set from Peru, the overlap in resistance to drugs such as rifampicin and isoniazid was as high as 87%. This resulted in cases where SNPs like RpoB:S450L (which confers resistance to rifampicin) showed up on the list of significant loci for isoniazid resistance, and KatG:S315T (confers resistance to isoniazid) showed up on the list of hits for rifampicin resistance. An expanded data set with more independent clinical isolates would be needed to correctly deconvolve these genotype-phenotype associations. Co-resistance is a well-known problem for traditional GWAS as well. 5
Second, our method does not specifically address epistatic interactions. Similar to traditional GWAS, our method assesses the statistical association of each locus independently from all the others. However, in some cases, resistance (or the level of resistance) can be determined by alleles at multiple positions in the genome.
63
For example, mutations related to toxin production were found to influence the growth rate of mupirocin-resistant strains of methicillin-resistant Staphylococcus aureus (MRSA) with mutations in ileS.
64
Vogwill et al
65
found that the fitness cost for nearly 50% of rifampicin resistance mutations in rpoB differed among strains of Pseudomonas, implying the influence of other (lineage-specific) mutations. And, Knopp and Andersson
66
demonstrated an interaction among resistance mutations to different antibiotics in Salmonella; in some cases, the fitness effects of different combinations of mutations were strain-dependent, including dependence on mutations at other loci, such as lon (protease), ompR (porin), and marR (regulator). As typically applied, LMMs do not account for interactions where the association at one site is dependent on an allele at another site, and instead, other analytical methods targeted at identifying linkage disequilibrium6,67 are required. A common form of epistasis is compensatory mutations. The ECAT was fortunately able to detect the weak association of compensatory mutations in RpoC with rifampicin resistance in our data set without explicitly taking RpoB mutations into account. However, there may well be other cases where interactions among genomic loci (exemplified by
Third, an accurate phylogenetic tree is required for estimating the homoplasy counts for SNPs. However, it remains challenging to reconstruct a global phylogeny for recombinant species such as Streptococcus pneumoniae 68 and Klebsiella pneumoniae. 69 Without a reliable phylogeny, sites located within the recombined regions may tend to look more homoplasic with respect to a global phylogeny based on SNPs across the whole genome, resulting in more false positives. Recent methods for locating chromosomal boundaries where recombination events occur during evolution may allow us to obtain more reliable trees accounting for the recombined regions 70 or to build up separate local trees for the recombined regions based on inferred recombination breakpoints. 71
Finally, as ECAT is designed for analyzing the association between chromosomal mutations and drug resistance, it is not expected to work for cases where resistance is acquired through lateral transfer of plasmid-borne resistance genes or other mobile genes. For example, the presence or absence of a plasmid carrying the
Conclusions
We presented a new method, called ECAT, that extends traditional regression-based GWAS methods with the ability to take advantage of homoplasy, which is an important signal of positive selection. This is achieved through a preprocessing step which identifies hypervariable regions in the genome consisting of statistically significant clusters of evolutionary changes, which are then subjected to association testing by an LMM. The efficacy of this approach was demonstrated by showing that it outperforms simple site-based and gene-based GWAS analysis (using GEMMA) in identifying known resistance mutations associated with drug resistance in a collection of MDR clinical isolates of M. tuberculosis. The improved sensitivity is attributed to focusing the analysis on optimized clusters of SNPs.
Supplemental Material
TableS1_for_review_xyz427580042c85e – Supplemental material for Exploiting Homoplasy in Genome-Wide Association Studies to Enhance Identification of Antibiotic-Resistance Mutations in Bacterial Genomes
Supplemental material, TableS1_for_review_xyz427580042c85e for Exploiting Homoplasy in Genome-Wide Association Studies to Enhance Identification of Antibiotic-Resistance Mutations in Bacterial Genomes by Yi-Pin Lai and Thomas R Ioerger in Evolutionary Bioinformatics
Footnotes
Funding:
The author(s) disclosed receipt of the following financial support for the research, authorship, and/or publication of this article: This work was supported in part by a U19 CETR grant (AI109755) from NIH/NIAID.
Declaration of Conflicting Interests:
The author(s) declared no potential conflicts of interest with respect to the research, authorship, and/or publication of this article.
Author Contributions
Y-PL developed the method, implemented the scripts, and performed the experiments. Y-PL and TRI wrote the paper.
Availability of Data and Materials
Supplemental Material
Supplemental material for this article is available online.
References
Supplementary Material
Please find the following supplemental material available below.
For Open Access articles published under a Creative Commons License, all supplemental material carries the same license as the article it is associated with.
For non-Open Access articles published, all supplemental material carries a non-exclusive license, and permission requests for re-use of supplemental material or any part of supplemental material shall be sent directly to the copyright owner as specified in the copyright notice associated with the article.