
Abstract
Modern phylogenetic studies may benefit from the analysis of complete genome sequences of various microorganisms. Evolutionary inferences based on genome-scale analysis are believed to be more accurate than the gene-based alternative. However, the computational complexity of current phylogenomic procedures, inappropriateness of standard phylogenetic tools to process genome-wide data, and lack of reliable substitution models which correlates with alignment-free phylogenomic approaches deter microbiologists from using these opportunities. For example, the super-matrix and super-tree approaches of phylogenomics use multiple integrated genomic loci or individual gene-based trees to infer an overall consensus tree. However, these approaches potentially multiply errors of gene annotation and sequence alignment not mentioning the computational complexity and laboriousness of the methods. In this article, we demonstrate that the annotation- and alignment-free comparison of genome-wide tetranucleotide frequencies, termed oligonucleotide usage patterns (OUPs), allowed a fast and reliable inference of phylogenetic trees. These were congruent to the corresponding whole genome super-matrix trees in terms of tree topology when compared with other known approaches including 16S ribosomal RNA and GyrA protein sequence comparison, complete genome-based MAUVE, and CVTree methods. A Web-based program to perform the alignment-free OUP-based phylogenomic inferences was implemented at http://swphylo.bi.up.ac.za/. Applicability of the tool was tested on different taxa from subspecies to intergeneric levels. Distinguishing between closely related taxonomic units may be enforced by providing the program with alignments of marker protein sequences, eg, GyrA.
Keywords
Introduction
Complete genome sequences of multiple bacteria became readily available for analysis after the advancement of next-generation sequencing (NGS) technologies. Ambitious projects were set forth to sequence prokaryotic genomes in more depth and in a broader spectrum. 1 With a plethora of genome sequences, it is of interest to study evolutionary relationships based on comparative analysis on the genomic scale termed phylogenomics. 2 Phylogenomics, being an intersection between genomic and evolutionary studies, has generated novel biological hypotheses by comparing numerous homologous sequences identified in multiple genomes to search for phylogenetic relationships and to resolve discrepancies between evolutionary scenarios of individual genes, entire genomes, and corresponding taxonomic units.3,4 Phylogenomics has broadened the horizon of evolutionary studies with the advancement of new techniques to conquer the myriad of sequencing data produced by NGS 5 including multi-locus sequence typing 6 and average nucleotide identity 7 approaches used for genotyping and measuring genomic relatedness between genomes and/or metagenomic DNA fragments. The principal idea of using whole genome sequences instead of alignments of individual marker genes was that the comparison of multiple homologues genomic regions would resolve possible disagreements between the evolution scenarios of individual genes and thus allow reconstruction of more reliable phylogenetic relationships between organisms. The super-matrix and super-tree approaches were exploited for integration of all genome data either by combining multiple alignments of homologous genes into a super-matrix or by finding a consensus for multiple gene-based trees. 8 Techniques for identification of orthologous genes have been proposed by a reciprocal BLASTP alignment of translated CDS, complete genome alignment, or by combinatorial approaches. 9 In practice, however, orthology identification is not a trivial task due to many complications such as gene paralogy resulting from gene duplication and horizontal gene transfer events, which can lead to false phylogenetic inferences. 10 Orthology prediction in diverse organisms may be problematic due to accumulation of multiple mutations in homologous sequences preventing proper alignments. Another main limitation of sequence-based methods applied to complete genomes is computational time, which is sensitive to the size of data sets. Heuristic approaches were used instead with a trade-off in terms of accuracy of resulting inferences. 11 Quality and reliability of alignments of multiple genomic loci are other issues of concern.12,13 Several studies have proposed other potential approaches to overcome these problems using various techniques of species identification and binning of metagenomic reads.3,6,7,14–17 An attractive alternative was to avoid sequence annotation, orthology prediction, and alignment steps in phylogenomic inferences using genome linguistic approaches. 18 These approaches were explored and tested in many areas of research such as metagenomics,17,19 evolutionary partitioning, 20 branch length estimations, 21 and phylogenomics,14,22 with promising yet sometimes controversial results. Unfortunately, the lack of a gold standard for phylogenetic inferences makes it cumbersome to perform benchmarking of different approaches for the reconstruction of phylogenetic relations between organisms.
In this study, we attempt to compare and integrate algorithms of traditional phylogenomic methods based on alignments of orthologous genes and those based on comparison of oligonucleotide usage patterns (OUPs), an alignment- and annotation-free metric. An effort was also made to reconcile possible discrepancies between these 2 approaches. The OUP is a statistical metric representing frequency of oligonucleotides, also known as k-mers or words, counted in complete genome sequences. It has been demonstrated that OUP, particularly tetranucleotide patterns, could serve as genome signatures of microorganisms18,23,24 and hence comparison of OUP between organisms creates a relative measure of how distantly related they are. This novel approach also allows identification of possible outliers with abnormal genomic signatures and divergence of sequence composition on a genomic scale without any annotation or alignment information needed.25,26 Statistical approaches estimating phylogenetic distances between genomes by comparison of k-mer patterns were reviewed by Fan et al 27 and it was demonstrated that the calculated distances were congruent to those estimated by traditional phylogenetic methods. However, due to the lack of sensible evolutionary models of OUP diversification, the question still remains as to how appropriate is the conversion of OUP dissimilarity values into phylogenetic distances. Therefore, this research was aimed at validating the applicability of OUP measures for phylogenomic inference and to discover possible driving forces of evolutionary changes in OUP. This work also attempted to explore possible integration of alignment-based marker gene comparison with the alignment-free method based on OUP comparison to resolve discrepancies between phylogenetic and phylogenomic approaches.
To perform a case study, several groups of microorganisms representing different phylogenetic branches and various taxonomic levels were selected, which included subspecies of Prochlorococcus marinus; representatives of genera Bacillus, Corynebacterium, Lactobacillus, Mycobacterium, and Pseudomonas and representatives of different genera of Enterobacteriaceae and Thermotogaceae. The OUP-based trees were compared with other commonly used and several innovative phylogenetic approaches such as the super-matrix concatenation of alignments of orthologous gene sequences, 16S ribosomal RNA (rRNA) phylogenetics, MAUVE whole genome alignment, 28 and CVTree oligopeptide profiling. 29 Sequenced strains of Prochlorococcus marinus, of which phylogenetic relations have been discussed before, 30 were used as a case study to test consistency of the OUP phylogenomic inferences. Another test of consistency for OUP phylogenomics was done on artificial DNA sequences simulated by the SimBac program. 31 An online tool, SeqWord Phylogenomics (SWPhylo), to perform the OUP-based phylogenomics was implemented at http://swphylo.bi.up.ac.za/.
Materials and Methods
Sequences of bacterial genomes used in this study
Various groups of microorganisms were selected for this study to represent different bacterial provenances by taxonomically well-characterized species. Complete genome sequences of different taxonomic groups of microorganisms were obtained from GenBank (Supplementary Table 1). In total, 11 species of the genus Bacillus, 13 species of the genus Corynebacterium, 11 species of the family Enterobacteriaceae, 22 species of the genus Lactobacillus, 16 species of the genus Mycobacterium, 12 species of the genus Pseudomonas, and 9 archaeal species of genera Thermotoga/Thermovibrio were chosen. For comparison with a set of closely related organisms with well-established phylogenetic relations, a phylogenetic study of 12 isolates of Prochlorococcus marinus performed by Prabha et al 30 was used. Simulated data sets with different numbers of isolates (10, 20, 30, 40, and 50) were created using the program SimBac with default parameters as stated in the Web site https://github.com/tbrown91/SimBac. 31 For each data set, 10 simulations were produced.
Genome sequence alignment, phylogenetic inferences, and comparisons
Identification of clusters of orthologous genes (COGs) in each taxonomic group was performed by an in-house python pipeline running a reciprocal local BLASTP alignment of all protein-coding genes of a genome against protein-coding genes of other genomes within the same taxonomic group. Pairs of genes showing a reciprocal sequence similarity with e values ≤0.0001 were considered orthologous.
All COGs were aligned using the MUSCLE algorithm. 32 Alignment ambiguities were removed by the program Gblocks. 33 Evolutionary distances between proteins were estimated by the Jones-Taylor-Thornton (JTT) substitution model implemented in the program protdist. For alignments of 16S rRNA sequences, the Felsenstein F84 substitution model implemented in the program dnadist of the PHYLIP package 34 was used. Phylogenetic inferences were performed based on the JTT/F84 distance tables using the program neighbour of the PHYLIP package. Neighbour joining (NJ) trees were inferred for every COG including the alignments of 16S rRNA. Whole genome super-matrix (WGS) trees were inferred based on concatenated alignments of all COG translated into protein sequences (excluding 16S rRNA). Finally, 3 types of annotation- and alignment-free trees were calculated using whole genome sequence data. The OUP comparison was performed using the program LingvoCom 1.0 (http://www.bi.up.ac.za/SeqWord/lingvocom/index.html); phylogenomic inference by whole genome sequence alignment was executed by the program MAUVE 10. 28 Finally, the CVTree alignment-free algorithm based on genome-scale oligo-protein k-string vector comparison was used to estimate phylogenomic distances between microorganisms. 35
In addition, sets of artificial DNA sequences of 1 Mb simulating phylogenetic relationships were generated by the SimBac program 31 to test the performance of the SWPhylo program.
Topologies of phylogenetic trees were compared using the Symmetric and Branch Score Distance (BSD) algorithms implemented in the program treedist of the PHYLIP package. 36 The symmetric algorithm compares the topologies of trees only, whereas the BSD algorithm accounts for the branch lengths. 34
Oligonucleotide usage statistics and mathematical modelling
The concept of OUP has been defined in previous publications.23–25 Shortly, k-mers (tetranucleotides in this work) were ordered by descending frequency of occurrence in the genome and then ranked respectively. The patterns of oligonucleotides were compared by the ranks assigned to the same k-mers. Another oligonucleotide usage statistical parameter termed oligonucleotide usage variance (OUV) was used in this study to identify possible outlier genomes. This metric has been shown to reflect the stringency of selection of specific oligonucleotides in a genome. Random sequences or sequences with a high rate of mutations were characterized with lowered OUV values. 18
The OUP calculation and comparison were implemented as a GUI program MetaLingvo 1.0 written on python 2.5, which is available for download from the project Web site (www.bi.up.ac.za/SeqWord/metalingvo/index.html). A command line version of the program named LingvoCom 1.0 is also available at www.bi.up.ac.za/SeqWord/lingvocom/index.html. These Web sites provide users with detailed guidelines. The programs analyse input genome-scale DNA sequences and return PHYLIP format distance tables, which then can be processed by PHYLIP package programs such as neighbour. The NJ algorithm was chosen for this study due to (1) high performance allowing analysis of big data sets, (2) universality of the distance matrix–based phylogenetic inferences, and (3) simplicity of the algorithm that is free from any evolutionary pre-assumptions used in maximum likelihood and minimal parsimony algorithms, which may not be applicable for genome-scale sequences.
Fitting of different mathematical models was performed by MATLAB version R2015a. 37 Logistic curve fitting was done using a python module lmfit. The best fit was chosen based on the χ2 goodness of the fit test. 38 SWPhylo is written in Python 3.4 and accessible at http://swphylo.bi.up.ac.za/. The program modules calculating cladograms were based on a publicly available module tree.py written by Jason Pell that implements the NJ algorithm. 39
Results
Comparison of genome-based and gene-based phylogenetic inferences
Phylogenetic trees based on alignments of individual COG and on alignment-free methods were compared with both the WGS- and GyrA-based trees using the PHYLIP treedist algorithm to identify the level of congruence between their tree topologies. The symmetric algorithm of treedist calculates the distance between tree topologies by counting the number of rearrangements between clades defined in different tree topologies. Relocation of one end-node element between clades in compared trees will give a distance of 2. Distributions of symmetric distances calculated for gene trees and alignment-free trees compared with the WGS- and GyrA-based trees used as references are shown in Figure 1. Remarkably, in almost all taxonomic groups, the OUP tree topologies were identical or very similar to those of WGS trees, whereas the topologies of the gene trees were generally dissimilar to those of the WGS trees and to each other. For example, the trees based on GyrA protein alignments, which are generally recognized as phylogenetic markers, 40 shared topological similarities with only a few gene-based trees and were dissimilar to the WGS and OUP trees (Figure 1). For a better visualization of the relationships between the phylogenetic trees created using the various methods including 16S rRNA alignments, WGS, OUP, MAUVE, GyrA protein sequence alignments, and CVTree; dendrograms of tree topology similarities are shown in Figure 2. These dendrograms were inferred using the NJ algorithm based on matrices of symmetric distances calculated between respective phylogenetic trees by the program treedist. The OUP trees were usually the most congruent with the respective WGS trees except for the groups of lactobacilli and Prochlorococcus. The trees based on alignments of marker genes/proteins were often grouped together with the CVTree cladograms, whereas the grouping of the Mauve trees was rather controversial. GyrA and 16S rRNA trees were mostly dissimilar to the WGS trees, although these genes are generally considered as universal phylogenetic markers.41,42
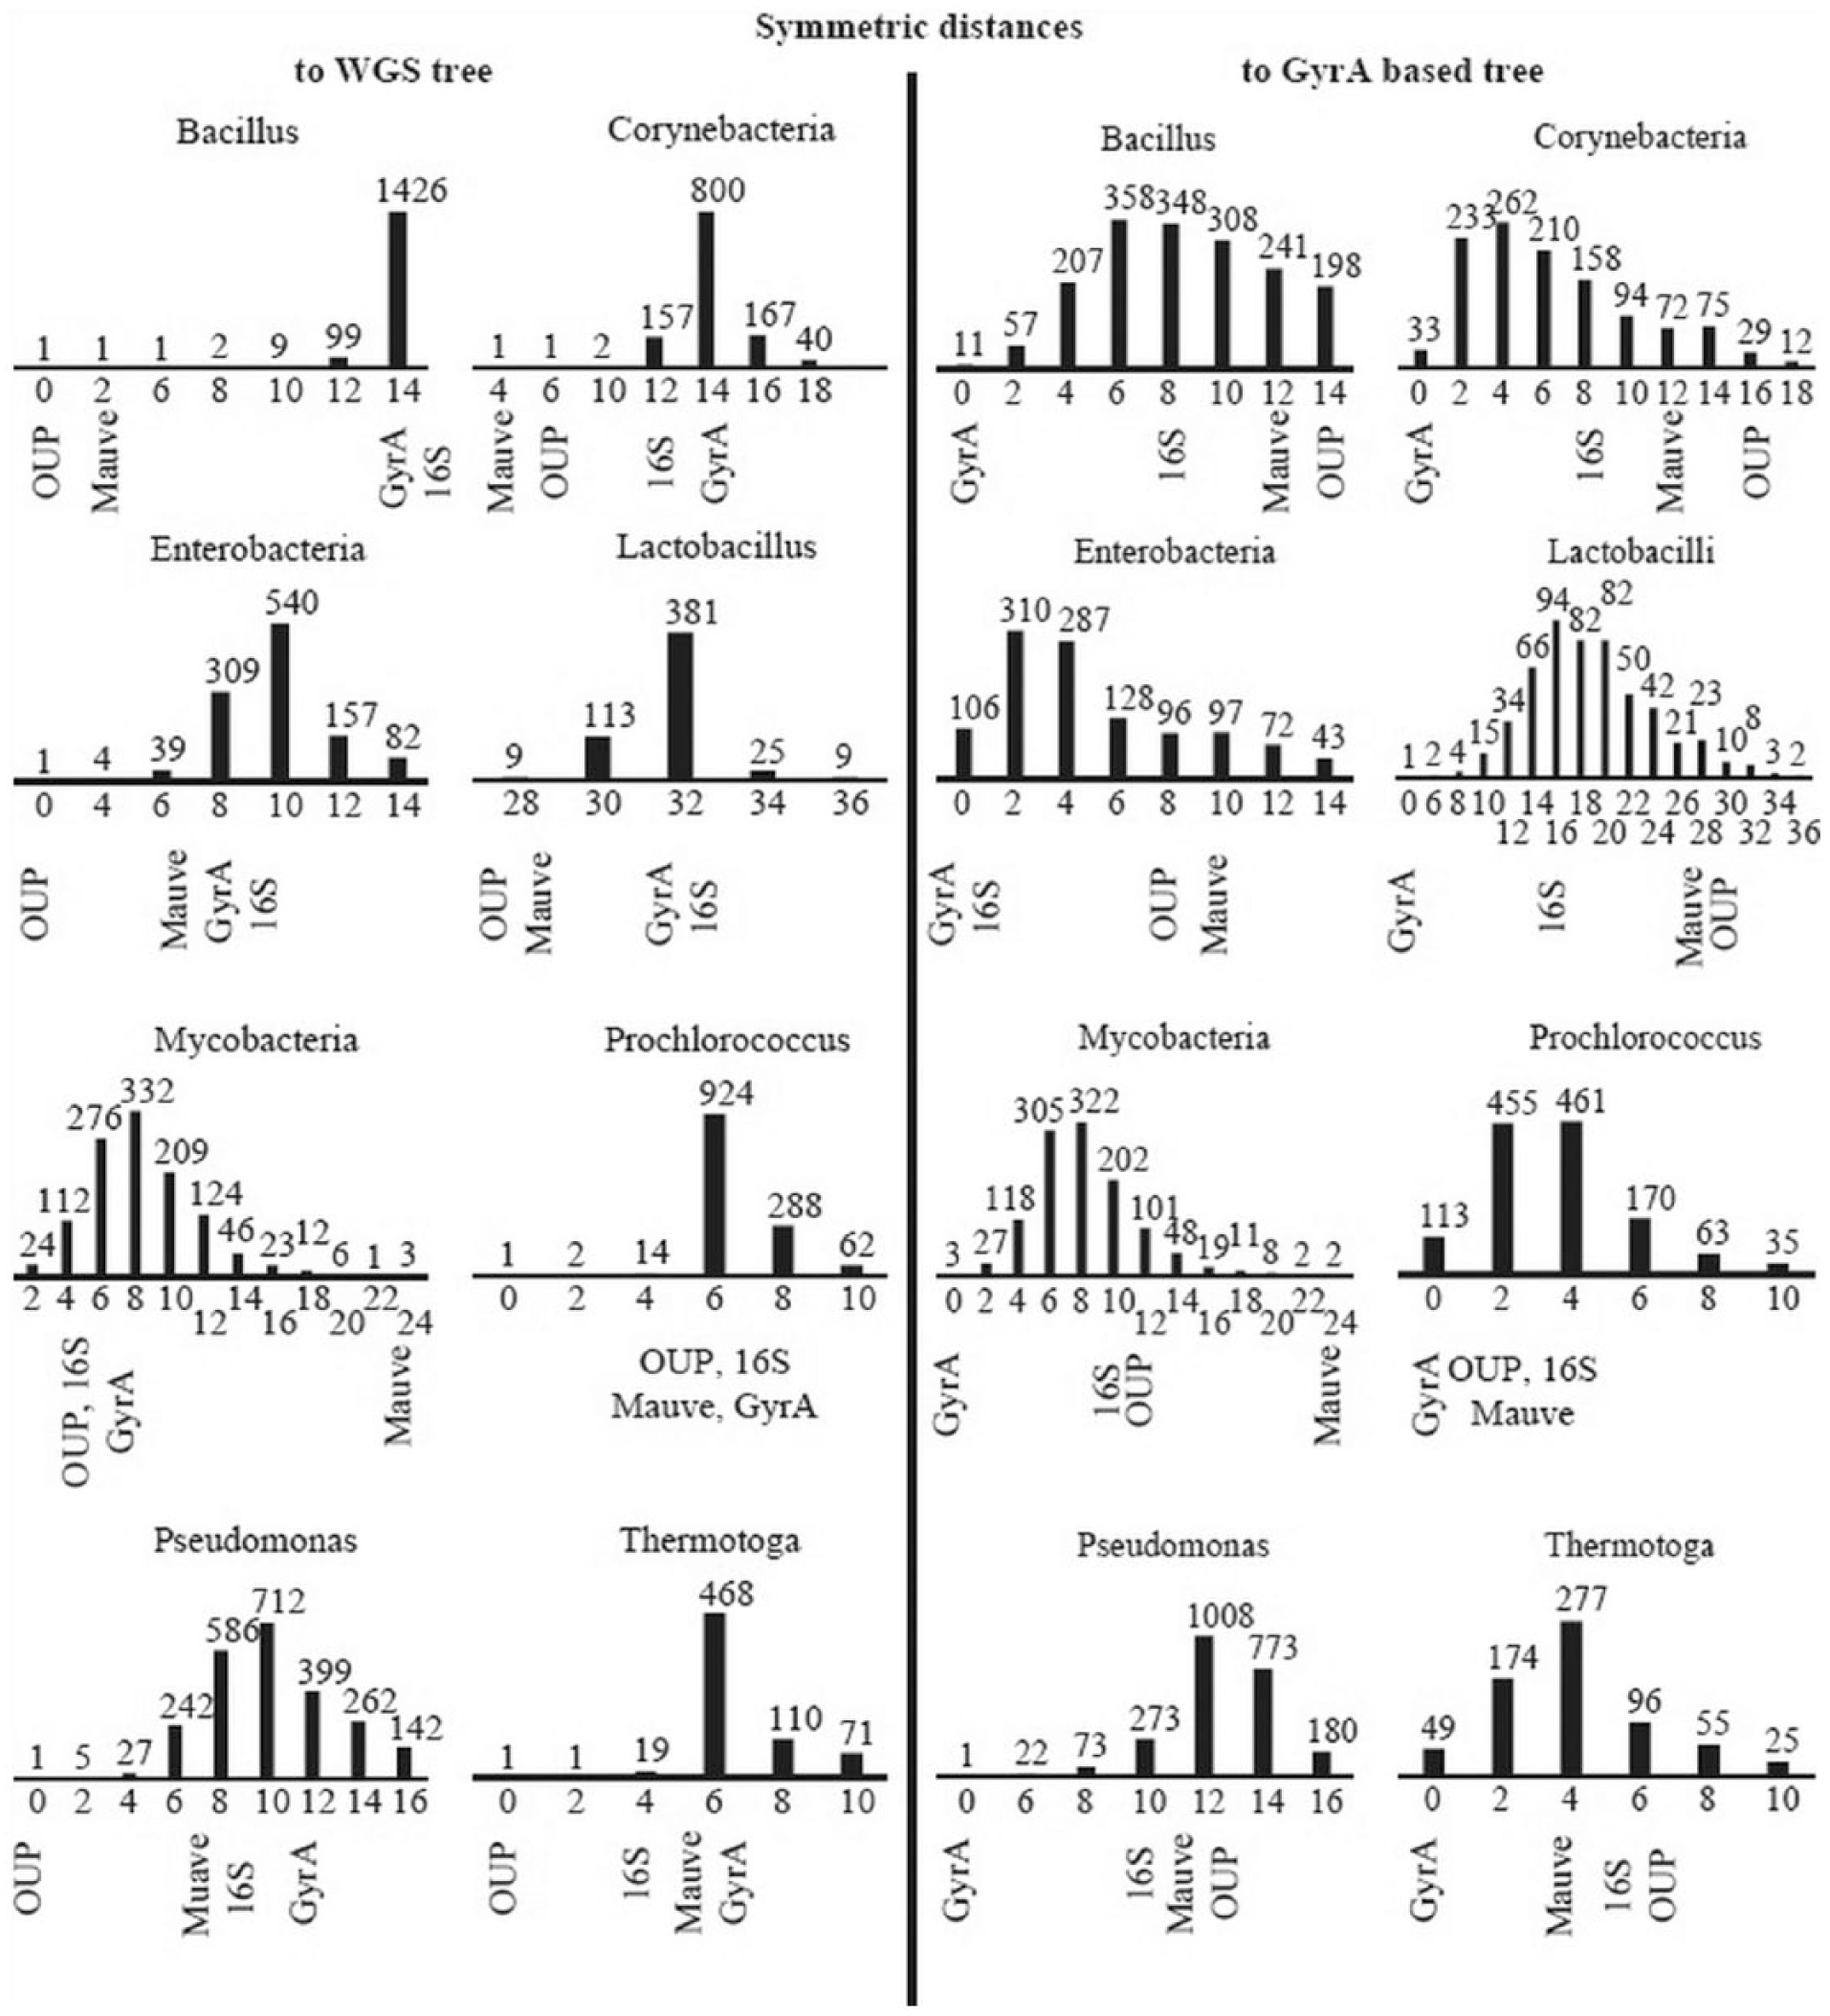
Distribution of symmetric distances between COG-based and genome-based trees compared with the reference trees: WGS (left part of the figure) and GyrA (right part of the figure). Columns in the histograms depict numbers of trees equally distant from the reference trees. The columns containing the OUP-, Mauve-, GyrA-, and 16S rRNA-based trees are marked in the graphs, respectively. COG indicates clusters of orthologous genes; OUP, oligonucleotide usage pattern; rRNA, ribosomal RNA; WGS, whole genome sequence.

Topological similarity based on symmetrical distances between the trees calculated for the selected taxonomic groups by different algorithms: GyrA protein distances, 16S rRNA distances (depicted as 16S), OUP distances, whole genome sequence alignment distances (WGS), MAUVE, and CVTree. Dendrograms were constructed by Neighbour Joining algorithm based on the matrix of distances between the trees calculated by the treedist symmetric approach. (A) Bacillus, (B) corynebacteria, (C) enterobacteria, (D) lactobacilli, (E) Pseudomonas, and (F) mycobacteria. OUP indicates oligonucleotide usage pattern; rRNA, ribosomal RNA; WGS, whole genome sequence.
The advance in sequencing technologies has created a new paradigm of evolutionary reconstructions based on complete genome sequence data.3,7 Several case studies were designed for this research to assess the reliability of different phylogenetic and phylogenomic approaches. However, it has to be admitted that the lack of experimentally proven models of species evolution does not allow performing any formal statistical validation or benchmarking of available phylogenetic approaches. An indirect indication giving extra credits towards the genome-based approaches is that in 4 out of 8 inferences shown in Figure 2, the WGS and OUP trees shared identical topologies. All other trees were algorithm-specific except for one case of congruency between the Mauve and CVTree trees calculated for the Thermotoga group.
The BSD algorithm accounts for branch length differences between phylogenetic trees calculated by different methods. All the phylogenetic methods mentioned above were ordered ascendingly by BSD values in comparison with the respective WGS trees. All the phylogenetic inference algorithms used in this study estimate lengths of tree branches. However, the program CVTree was excluded from this comparison as it calculates the distances between taxonomic units, which are known to be incomparable with the distance values produced by all other methods. Again, it became evident that branch lengths calculated by the OUP approach in many cases were congruent to those produced by the WGS algorithm (Table 1).
Ranks of congruence for several gene-based and alignment-free trees with the reference WGS trees calculated for different groups of microorganisms.

Abbreviations: OUP, oligonucleotide usage pattern; rRNA, ribosomal RNA; WGS, whole genome sequence.
The trees constructed by Mauve, based on genome sequence alignments, also shared similarity with the corresponding WGS trees, but the OUP approach usually outperformed the Mauve trees in this regard (Figures 1 and 2 and Table 1). It may be concluded that OUP comparison is a promising approach for phylogenomics as this procedure produce trees congruent to WGS trees but is more efficient compared with the latter approach. To visualize differences and similarities of tree topologies, several examples of WGS-, OUP-, and GyrA-based trees inferred for the taxonomic groups of Bacillus and corynebacteria are shown in Supplementary Figure 1.
Comparison of OUP inference with a previously published phylogeny
As discussed above, OUP trees were often congruent to the corresponding WGS trees (Figure 2), but some topological differences were observed between OUP and WGS trees calculated for the group Prochlorococcus. We hypothesized that these misalignments between OUP and WGS trees may result from errors in the multistep procedure of WGS inferences, which includes genome annotation, identification of orthologous genes, multiple sequence alignment, and concatenation, whereas the OUP approach is in comparison more straightforward. To validate this hypothesis, the OUP tree calculated for the group Prochlorococcus was compared with a published phylogenetic tree calculated for the same organisms by the whole genome alignment algorithm. 30 The authors of this publication claimed that the whole genome phylogenetic tree fitted much better to known phylogenetic relationships between ecotypes of this species, ie, the tightly clustered high light (HL)-adapted and divergent low light (LL)-adapted strains than the 16S rRNA-based tree. The OUP tree designed in this study was consistent with the delineation of the HL and LL ecotypes of P marinus (Figure 3).
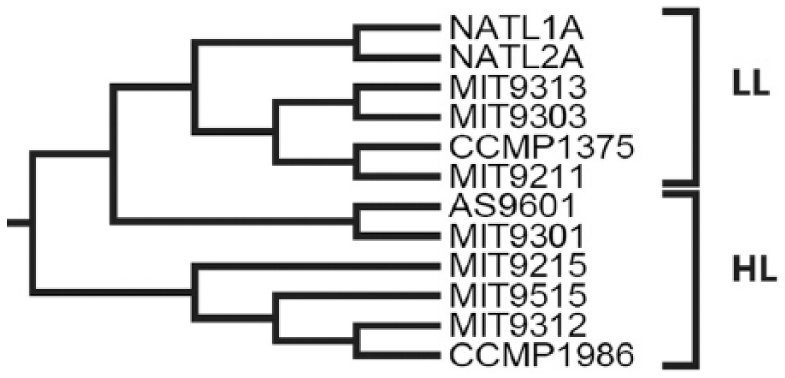
Oligonucleotide usage pattern phylogenetic tree using the Prochlorococcus marinus subspecies data set. The inferred tree clearly separated the different light-adapted strains (LL, low light; HL, high light) as reported elsewhere. 30
OUP performance on artificial sequences simulating phylogenetic relationships
To ascertain the accuracy of OUP-based algorithms proposed in this research, we used the program SimBac to simulate sets of artificial DNA sequences of 1 Mb length as a case study with preliminary assigned phylogenetic relationships. In total, 5 sets of sequences were generated with sample sizes of 10, 20, 30, 40, and 50 sequences of which every set was repeated 10 times. The OUP algorithm was used to construct phylogenetic trees based on the generated sets of sequences, which then were compared with the reference trees produced by the SimBac program using the treedist symmetric algorithm. Maximal and minimal numbers of taxonomic units producing topological mismatches were normalized by the sample sizes as displayed in Figure 4.

Plot showing the percentage of relocations of operational taxonomic units between clades in the trees inferred by OUP compared with the reference trees for the artificial data set produced by SimBac. Axis X depicts the different sample sizes of the generated sets of sequences of which each sample size contained 10 data sets. Axis Y shows the percentages of relocations in the corresponding trees. Borders of the grey area depict the maximal and minimal percentages of relocations identified for the sets of sequences of the same sample size. The average value of percentage of relocations calculated for all sets of sequences is shown by the bold line.
The average number of relocations of a taxonomic unit was around 27% (SD = 9.6%) with the variation in these numbers decreasing with an increase in sample size. Topology of the OUP trees was moderately consistent with the reference trees. Relatively high levels of topological mismatches in the trees may be related to the fact that the SimBac program generates random sequences, which do not represent evolutionary forces of speciation such as positive selection of mutations or codon adaptation focusing more on recombination events. 31 Unfortunately, it was not possible to use these data sets to produce trees by other methods to compare their performance with that of the OUP algorithm.
Reconciliation of OUP- and protein alignment–based trees
Non-linear dependence was observed between the distances calculated by the OUP approach and GyrA protein comparison. It explains the incongruence of OUP- and GyrA-based trees (Figure 2). An example of a distribution plot calculated for the taxonomic group mycobacteria is shown in Figure 5. At the beginning of speciation, a higher rate of substitutions in protein sequences may be expected due to the positive selection of beneficial mutations. Accumulation of amino acid substitutions then comes to a saturation point when the purifying selection takes over allowing only sporadic neutral mutations in non-conserved regions. This concept is in agreement with the hypothesis of gene fixation in ecological niches proposed by Shapiro et al 42 as the Stable Ecotype Model. On the plots in Figure 5, dots of pairs of OUP/GyrA distances form a series of s-shaped curves fitting to the logistic growth curve. The logistic dependence implies a distribution of the time variable parameter which is the rate of mutations in household proteins, over a constant in time parameter represented by the rate of changes in OUP patterns. It may be concluded from this observation that the diversification of OUP may better reflect the time span of evolutionary events. Another conclusion is that in terms of taxonomy, both measures have their advantages and limitations. The fast rate of amino acid substitutions in the household genes at the early stages of speciation allows for better distinguishing between closely related taxonomic units. However, the evolutionary distances between diverse organisms may be significantly underestimated by the protein sequence comparison. In contrast, OUP of closely related organisms may be indistinguishable and is better suited for comparisons between distantly related organisms due to a larger difference in composition. The result in the previous section supports this hypothesis where 16S rRNA resolves the evolutionary relationship of tightly clustered HL-adapted strains better, whereas OUP could more appropriately distinguish between the divergent LL-adapted ecotype strains.
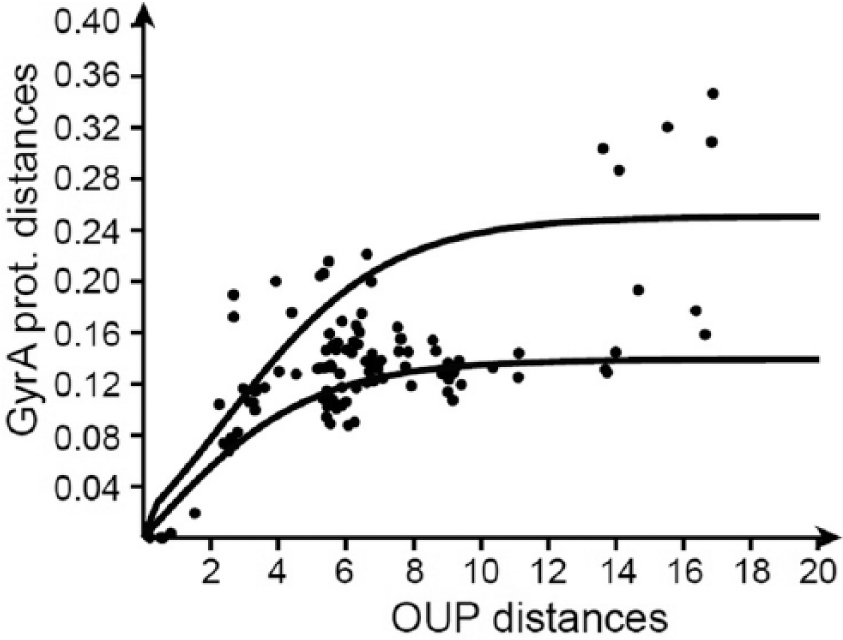
Pairwise distance plot of oligonucleotide usage pattern distances (axis X) against GyrA sequence distances (axis Y) calculated for pairs of organisms of the taxonomic group mycobacteria. Each pair of organisms on the plots is depicted by a dot. Distribution of dots fitted to 2 logistic curves reflecting different rates of genomic evolutionary changes.
The inverse logistic function (equation (1)) showed the best fit to the distribution of the distance values calculated for GyrA protein alignments and OUP (Figure 5). The logistic equation is characterized by 2 parameters K and g. Parameter g (gradient) correlates to the rate of amino acid substitutions in the marker protein, whereas parameter K (capacity) defines the boundary line of deviation of protein sequences limited by functional constraints of coding proteins and the purifying selection:

An approach to integrate OUP and GyrA evolutionary distances is shown in equation (2):

If n = 1, equation (2) returns an average value of the actual OUP distance and the distance calculated by GyrA protein comparison. As the value of n increases, greater weight is given to protein distance values, which allows for better resolution between closely related organisms.
Possible mechanisms and dynamics of evolutionary changes in OUP
It was hypothesized that the driving forces of OUP diversification could be identified by an analysis of frequencies of context-dependent nucleotide substitution emissions in tetramers. Emission was denoted as a likelihood for a given nucleotide in a sequence to be substituted by one of the 3 other nucleotides, if the states preceding and/or the following nucleotide(s) are known. Several alternative hypotheses were considered: (1) the pattern of substitutions (emissions) depends only on the state of the residue to be mutated but does not depend on the states of any neighbouring nucleotides, (2) the pattern of emissions depends on the context of all surrounding nucleotides, and (3) the pattern of emissions depends on the context and also on the location of the mutating residue within the corresponding codon.
To perform this study, the following analytical procedure was designed. Nucleotide sequences of homologous genes in different organisms were pairwise aligned and the number of substitutions calculated. Then, subsets of substitutions taking place at given conditions (position within the codon and/or the states of preceding or following nucleotides) were compared against the general emission pattern using vector arithmetic. For example, a comparison of the homologous sequences of Corynebacterium jeikeium K411 [NC_007164] and Corynebacterium kroppenstedtii DSM 44385 [NC_012704] revealed that the mutated adenosine residue (A) in protein-coding sequences of NC_007164 were substituted by C, G, and T in NC_012704 with frequencies of 0.5, 0.36, and 0.14, respectively. Taking a subset of these substitutions when residue A was located only at the second codon position (location factor) and preceded by another A (context factor), the corresponding likelihood values became 0.45, 0.5, and 0.05. Based on these 2 emission patterns, the vector distance was calculated as follows:

Vector distances were calculated for all possible combinations of the mutated (location factor) and context nucleotides in a range of 10 residues upstream to 10 residues downstream from the mutating residue in an attempt to identify possible forces influencing the nucleotide substitutions within the 10-base flanking regions. Then, the values were summarized by the codon positions of the mutating residues (Figure 6). Average values (AVR) and SD (STD) were calculated.
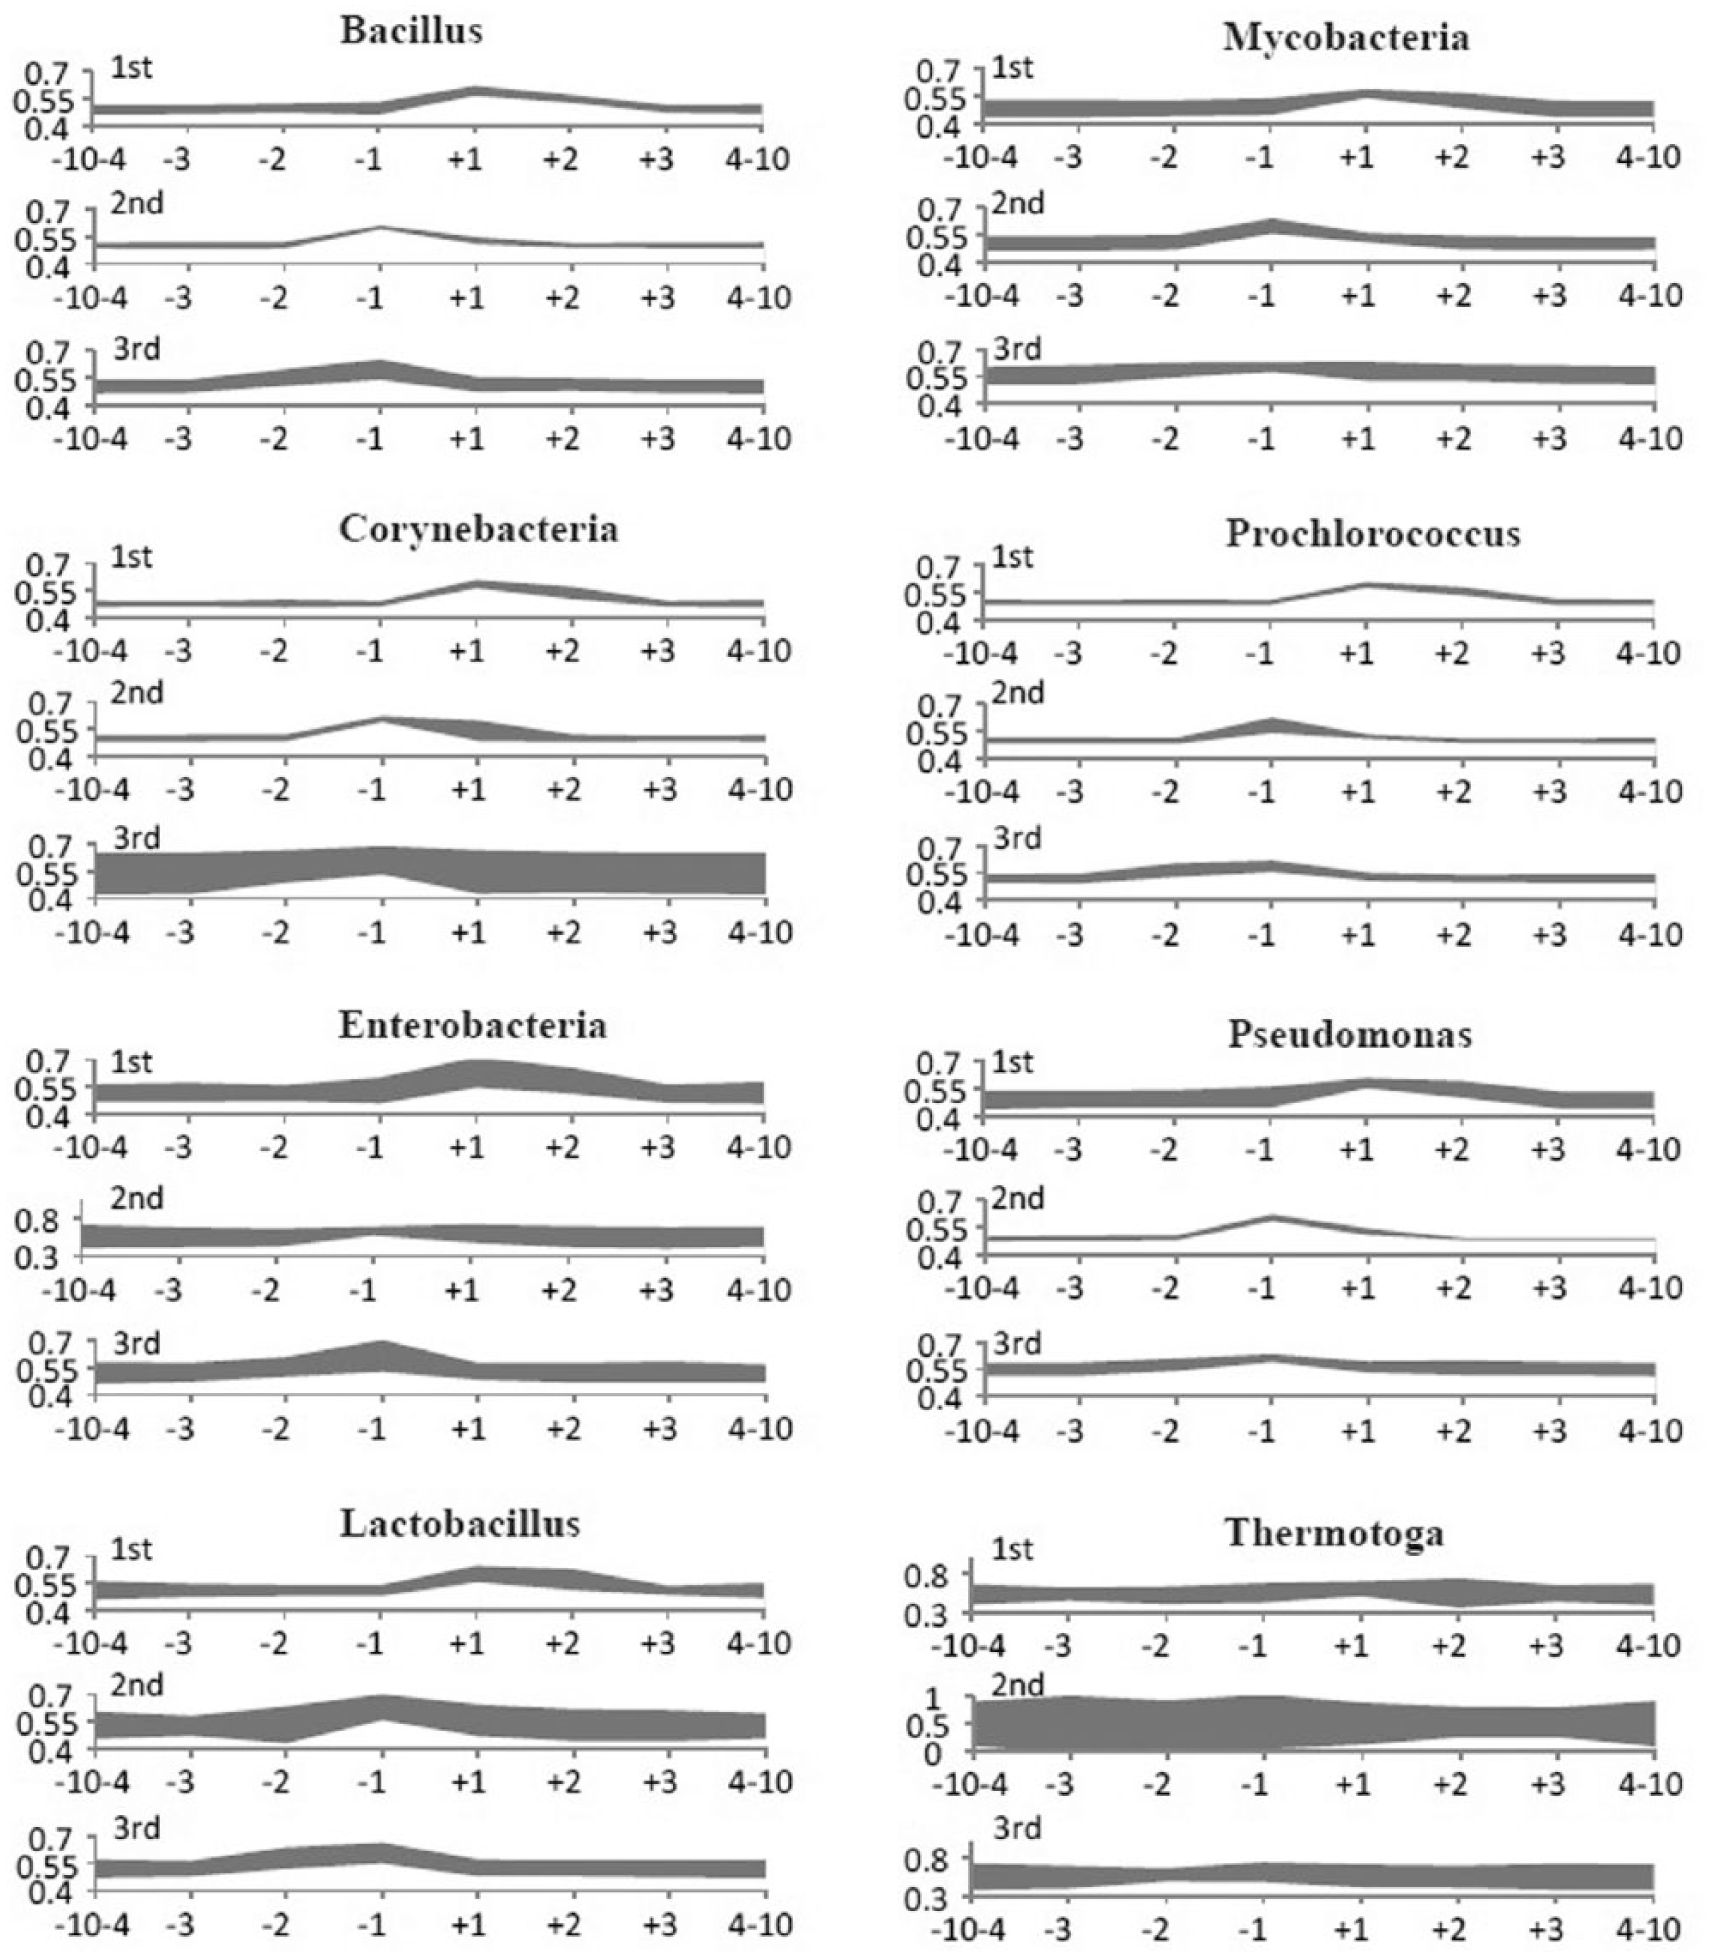
Emission patterns of the codon-specific residues influenced by the states of the context residues. The diagrams of the emission pattern deviations were organized by location of the mutating residue at the first, second, and third codon positions. X axes depict the positions of the context residues relatively to the mutating residues. Data for the preceding and posterior 10 to 4 residues were summed up in the 2 outermost categories. Y axes depict vector distances between the global emission pattern and the patterns calculated for each category. Bandwidth depicts the values AVR ± 2.5 × STD.
Diagrams in Figure 6 represent distributions of AVR ± 2.5 × STD calculated for the first, second, and third codon positions. An assumption was that the higher vector distances with a smaller STD range should be an indication of stronger specificity of the emission pattern, in other words, a stronger selective pressure on nucleotide substitutions. Inspection of the diagrams in Figure 6 showed that the emission pattern constraints were predominantly codon specific in all taxonomic groups. Thus, the emission patterns of residues at the first codon position were influenced by the states of the second and third residues in the same codon. Similarly, for the second and third nucleotides in codons, their substitution patterns were influenced by the states of other nucleotides in the same codon. And in contrast, the emission patterns were generally not influenced at all by the states of neighbour residues from the other codons. These signals were recognizable in all the taxonomic groups of eubacteria; however, the differences between the emission patterns calculated for several groups were statistically unreliable due to a strong background noise (see enterobacteria, Lactobacillus, and Thermotoga in Figure 6).
It can be concluded that OUP evolution in bacteria was driven mostly by codon selection. Biased codon usage reflects unequal concentrations of transfer RNA (tRNA) molecules in the cytoplasm of bacterial cells. 43 Indeed, abundance of different tRNAs depends on the number of allelic copies of the corresponding genes and unequal gene expression from different loci. 44 Fluctuations of tRNA concentrations in bacterial species can engender a steady rate of directed mutations adjusting the codon usage and thereby influencing the global OUP.
SWPhylo interface and output
SWPhylo is a python program integrated in a Web-based user interface shown in Figure 7. The program allows submitting complete genome sequences or large genomic fragments either in FASTA or in GenBank formats. Multiple genome sequences may be stored in a single FASTA file. If the genomic sequences are represented by individual GenBank files, they must be compressed into a single archive file (.zip) before uploading.

SWPhylo Web-based user interface at http://swphylo.bi.up.ac.za/.
Optionally, the program allows submission of an additional FASTA file with an alignment of GyrA protein sequences in FASTA format. The number of sequences in this file must be the same as the number of the submitted genomes and they must be given the same identifiers. Users may explore the functionality of the program using example files available from the Web page. If a protein alignment file is provided (GyrA), the program will combine the input data sets in the resulted tree by equation (2). Alternatively, the program will infer a phylogenetic tree solely by OUP comparison.
Contribution of protein sequence distances to the resulting tree may be controlled by the parameter ‘Protein distance contribution’ (Figure 7) in accordance with equation (2). By default, this value is 1, but may be changed to either 2 or 3. We recommend using the value 2 when closely related species are compared and the value 3 to distinguish between subspecies of the same species.
Another useful parameter is a checkbox forcing the program to use the default values of the coefficients g and K (g = 0.0775; K = 1.3379, see equation (1)) estimated for a joined set of all the taxonomic groups used in this study. When the checkbox is unchecked, the program recalculates these parameters for the given data set to reflect the group specific rate of evolution. A drawback of this approach is that the resulting tree will be dependent on the sample content. The usage of the default g and K parameters ensures results to be sample independent.
We did not explore the possibility of using alignments of housekeeping genes other than GyrA in this study. Potentially there should be no problem in using other popular genetic markers such as ribosomal proteins, for example.45,46 If alternative protein sequences are submitted, the checkbox of the default g and K parameters must be unchecked to allow the program to calculate these values for the given data set.
Output of the program SWPhylo is a simple cladogram representing only the phylogenetic tree topology. Users may download the actual distance table in standard PHYLIP format to analyse the phylogenetic relationships using more sophisticated tools, such as the programs neighbour, fitch, and kitch from the PHYLIP package, MEGA6, 47 or SplitsTree4. 48
When the protein sequences (GyrA) file is provided, the program returns 2 additional figures (Figure 8): a logistic cluster plot and a dendrogram plot. In many cases, fitting OUP to protein distances achieved the best results when pairs of organisms were split into several clusters, each fitting to an individual logistic curve (Figure 8A and see also Figure 5). Clustering reflects either different evolutionary rates in tree branches or evolutionary leaps towards occupation of new niches and/or habitats during speciation. These leaps may be associated with an abrupt burst of positively selected mutations in housekeeping genes. The program performs clustering of the taxonomic operational units (ie, genomes in this study) around different logistic curves. The number of clusters by default is determined by the program automatically but may be set by users in the counter field ‘Number of clusters’ (Figure 8). An example of the downloadable figure is shown in Figure 8B (for more details, see the user guide on http://swphylo.bi.up.ac.za/).

SWPhylo output graphs visualize clustering of the sampled genomes (the taxonomic group lactobacilli in this example) along different logistic curves that may reflect different rates of evolutionary changes in their genomes. (A) fitting of oligonucleotide usage pattern to protein distance distribution to 3 logistic curves. Each line represents one logistic cluster. Goodness of the fit test is reported by VG (very good), Good, Mod (moderate), Bad, and VB (very bad) notations. (B) Assignments of the tested genomes to different logistic clusters (zones). Evolution of the microorganisms may be explained by a series of evolutionary leaps (non-graduate increases in mutation rates in household proteins), the number of which corresponds to the number of intermediate zones on the plot.
It was concluded from this research that the deviation of genomic OUP is constant regarding time which is in contrast to the rates of substitutions in individual genes. This makes OUP comparison a promising approach to estimate the relative time of evolution of organisms. However, readers should be informed that there may be exclusions from this assumption. In a paper by Reva and Tummler, 18 several bacterial genomes were noted in which the global OUP experienced a drastic demolition due to unknown reasons. One of these organisms is Xylella fastidiosa 9a5c. The OUP of this genome is characterized by an unprecedented increase in the DNA strand asymmetry and decrease in OUV implicating a mutator phenotype. The reason for these dramatic changes was assumed to be associated with an acquisition of a large genomic island of Pseudomonas origin comprising several active phage integrases, which caused this degenerative effect on the whole chromosome. 49 Interestingly, protein sequences of X fastidiosa 9a5c remained very similar to those of X fastidiosa Temecula1 in contrast to their differing OUP. The separation of X fastidiosa 9a5c from X fastidiosa Temecula1 in an OUP-based phylogenetic tree will therefore be an overestimation. Another example of a problematic organism is Mycobacterium leprae. The OUV of this genome is significantly lower than in other mycobacteria which implies a higher rate of mutations or weaker conservation of OUP. Relaxed codon bias could be beneficial to this pathogen causing a long lasting chronic infection to slow down the growth rate. On the OUP-based tree, this bacterium seems more distant to the tuberculosis cluster than may be estimated by protein sequence comparison. To warn users that the phylogeny of a specific organism may not have been identified correctly, the program uses deviations in OUV values. 18 One asterisk displayed on an output phylogenetic tree marks the organisms with a genomic OUV 2.5 × STD larger than the average OUV of the data set. Two asterisks depict genomes characterized by an OUV 2.5 × STD lower than the average. Another example in the P marinus case study where the resulted OUP inference identified 2 potential outliers were the strains MIT9303 and MIT9313. This result is in agreement with the paper by Prabha et al 30 reporting that these 2 strains were divergent from the other 10 strains used in the test data set.
Discussion
This study demonstrated that OUPs are reliable phylogenetic signatures, which can be easily calculated for non-annotated DNA sequences of complete bacterial chromosomes and/or large genomic fragments. Theoretically it was predicted that even a 5 kb DNA sequence could be sufficient for a statistically reliable OUP estimation. 18 However, to avoid the influence of horizontally transferred genomic islands and other genomic loci with alternative OUP, we recommend the genomic fragments subjected for phylogenomic inferences to be 50 kb or longer. Phylogenetic trees based on OUP comparison were generally more congruent to the corresponding WGS trees when compared with the other methods (Figures 1 and 2 and Table 1). In cases when the congruence was ambiguous, a likely factor might be the numerous error prone steps of the WGS tree inference such as genome annotation, orthology prediction, and sequence alignment. Moreover, the discriminative power of the selected COG may vary in different groups of organisms assuming different prevalence of horizontal gene transfer events influencing the quality of WGS trees. Horizontal gene transfers in many cases will not be a problem for OUP comparison as the DNA of genomic islands gain OUP features of the host chromosome in the amelioration process. 50
It was hypothesized that the evolutionary changes in OUP of bacterial genomes most likely were driven by a global adaptation of codon usage to fluctuating concentrations of tRNA molecules in the cytoplasm. This hypothesis is consistent with previous publications.51,52 It was shown that the patterns of nucleotide substitution emissions were influenced exclusively by the neighbour residues affiliated with the same codon (Figure 6). However, codon adaptation as a single driving force cannot explain the fact that non-coding intragenic regions of bacterial genomes also conform to the same OUP characteristic of the whole genome. In a paper by Reva and Tummler, 18 it was shown that coding and non-coding regions of bacterial genomes share the same abundant oligonucleotides characterized by similar stereo-chemical properties such as base stacking energy, propeller twist angle, and bendability of DNA strings. It was hypothesized that the bacterial DNA reparation system could allow more mutations in the DNA fragments with alternative OUP by recognizing an alternative conformation of these DNA loci. However, this driving force of OUP diversification is probably weaker than codon usage adaptation and it requires a longer period of evolution. This assumption is supported by the fact that the horizontally transferred genomic islands comprising important protein-coding genes rapidly gain the host specific OUP, whereas insertions of prophages comprising non-coding sequences and selfish genes may be identified by their specific OUP even in several related bacterial species implying that they were inherited by them from one common ancestor a long time ago without losing the OUP specificity of these loci. 53
The program SWPhylo introduced in this article was designed to resolve phylogenetic relationships between microorganisms on taxonomic levels from species to related genera. It should be noted that the OUP signatures may gain random similarity when calculated for diverse microorganisms. For example, OUPs of Pseudomonas and Mycobacterium are very similar, and in an OUP-based phylogenetic tree, these organisms would create polyphyletic clades (data not shown). This problem is known as the long-branch attraction. Hence, the integration of the OUP-based approach of phylogenomics with sequence-based methods (ie, GyrA protein alignment and comparison) may improve resolution of closely related organisms’ evolutionary relationships and also brings forth an interesting prospective of integrating different aspects of evolutionary changes in bacterial genomes by grouping the organism along estimated logistic curves (Figure 8A and see also Figure 5). The GyrA protein may potentially be replaced by other genetic markers to better suit a specific set of studied organisms. In this work, the possibility of calculating evolutionary distances based on OUP patterns for phylogenomic analysis was investigated. The distance-based approach has its own limitations and optimally should be supplemented in future with a likelihood model of OUP evolution.
Footnotes
Acknowledgements
The authors thank Dr Rian Pierneef for his assistance in the project.
Funding:
The author(s) disclosed receipt of the following financial support for the research, authorship, and/or publication of this article: This work was funded by the grant #93664 provided by the National Research Foundation (NRF) of South Africa.
Declaration of conflicting interests:
The author(s) declared no potential conflicts of interest with respect to the research, authorship, and/or publication of this article.
Author Contributions
XY and ONR contributed equally to all aspects of this study and manuscript preparation.
References
Supplementary Material
Please find the following supplemental material available below.
For Open Access articles published under a Creative Commons License, all supplemental material carries the same license as the article it is associated with.
For non-Open Access articles published, all supplemental material carries a non-exclusive license, and permission requests for re-use of supplemental material or any part of supplemental material shall be sent directly to the copyright owner as specified in the copyright notice associated with the article.