
Abstract
Jeju Black cattle is one of the aboriginal Korean cattle breeds that has been isolated in Jeju island for a long time, while Yellow Hanwoo cattle has been extensively selected for beef production traits for the last several decades. Aiming to investigate broader patterns of selection, we genotyped 352 Yellow Hanwoo and 169 Jeju Black cattle using a customized 150 K bovine chip. Our composite selection signals’ analysis to identify selection signatures (cross-population extended haplotype homozygosity [XP-EHH], ΔSAF, and FST) identified recent and strong signature of selection near many loci with mutations affecting the traits under strong selection as outlier in Yellow Hanwoo, including SCP2 (P = 8.41 × 10⁻¹⁰) that may be involved in the meat quality. We found nine candidate regions with significant clusters of selection signals, and further bioinformatics analyses of the genes located within these regions revealed mainly genes involved in G-protein coupled receptor signaling pathway (GO:0007186) or olfactory transduction (bta04740), which may be due to adaptation to natural environments in Jeju island. Based on the stronger correlation of Ne10/Ne100 ratio between Yellow Hanwoo (0.61) and Jeju Black (0.66) cattle, our results suggest that the difference of chromosomal regions of selection signature between the 2 cattle breeds was due to a consequence of selection processes to adapt to environmental differences between Jeju island and the main inland, Korean peninsula.
Introduction
Recent evidence of selection on standing genetic variations is even more probable in domesticated cattle than in other natural outbred populations.1,2 The bovine genome contains hundreds of regions whose patterns of genetic variation indicate adaptation for important traits, which might be due to strong selection pressures either by artificial selection programs or natural selection for adaptation in a specific environment. 3 These regions are broadly referred as signatures of selection, which has been focused on many recent studies with several cattle breeds. Their main goal was to unravel the causal mechanisms related to traits of interest in the genome.4,5 The classic interpretation is that these genetic variations conferred differential adaptations to the cattle, causing many beneficial alleles of such genes to rapidly accumulate and fix within a population over time. 6
Korean cattle are native taurine (Bos primigenius taurus) breeds that have been adapted to Korean peninsula long time ago. 7 In Korea, there are 3 native taurine-type cattle breeds, namely, Yellow Hanwoo, Chikso, and Jeju Black. These independent breeds mainly differ from each other in the coat colors and levels of nose darkness. Geographically, a large of Yellow Hanwoo live in the mainland while Chikso and Jeju Black exist on small areas on the mainland as well as 2 islands. While one of these breeds, Yellow Hanwoo, is a part of the national breeding and selection program for beef production purpose (carcass weight and marbling) and therefore undergoing artificial selection, the Chikso and Jeju Black are given little attention and adapted to the natural environment of their island. In the recent decades, the South Korean government took initiative for conservation and genetic improvement of Jeju Black in light of the need of improving the lineage and disease control measures, as well as raising awareness about the historical significance of the breed.8–10
With the rapid development of large-scale catalogs of genetic variation, uncovering the genetic footprints of this strong recent artificial selection could provide an insight into the mechanisms of selection in general and could, moreover, facilitate functional annotation of the genes related to important physiological and economical traits. The Korean government has selected Yellow Hanwoo for meat yield and quality using modern reproduction techniques; a completely different breeding history against Jeju Black remained isolated from the effects of artificial selection and will reveal the greatest selection pressure. Therefore, this study explores the selection signal by applying Randhawa composite selection signals (CSS) 11 statistics combining with all 3 single statistics (cross-population extended haplotype homozygosity [XP-EHH], ΔSAF, FST) using a custom-made single-nucleotide polymorphism (SNP) chip (147 792 SNPs) genotyping data of the Yellow Hanwoo and Jeju Black populations. Furthermore, we estimate the effective population size at the between-population level. Our study aimed to advance our understanding of mechanisms underlying Yellow Hanwoo and elucidate the signatures of selection that have contributed to phenotypic appearances.
Materials and Methods
Studied samples, quality control, and population structure
A total of 352 Yellow Hanwoo and 169 Jeju Black cattle were genotyped using a customized 150K bovine chip, which was constructed by combining (1) the 55 491 SNPs that were already in Illumina BovineSNP50 BeadChip (version 3); (2) the 49 710 SNPs among the 648K SNPs in commercial Affymetrix bovine 648 K chips; (3) the 2603 SNPs in the hair or skin color genes including MC1R that were related to hair color specific in Hanwoo and Black cattle; (4) the 4665 SNPs in the candidate genes that were previously reported to be associated with economic traits in Hanwoo; (5) the 40 134 SNPs that were evenly positioned to cover the whole bovine chromosomes, which was selected after whole genome sequencing of 10 Jeju Black cattle sires. This array includes a total of 147 792 SNPs located throughout the genome with known mapping positions on the UMD 3.1 bovine reference genome, 12 which may alleviate ascertainment bias of genome analysis due to nonrandom distribution of SNPs across genomes, compared with the Illumina BovineSNP50 BeadChip. Genomic DNA purification and genotyping were accomplished by DNALink, a commercial genome analysis service provider in Korea. Single-nucleotide polymorphisms quality filtering was performed for each population using PLINK v1.9. 13 Only autosomal markers with unique genomic coordinates presenting call rates of at least 95%, minor allele frequency greater than 5%, and Fisher exact test for Hardy-Weinberg equilibrium greater than 0.001 were considered for linkage disequilibrium (LD) analyses. This left SNPs passing quality control (QC) across the breeds were then overlapped. To detect relatedness or duplicates in the dataset, individuals were further filtered using PLINK v1.9. Inferring the haplotype phase and imputing missing alleles were performed for the whole set of cattle populations with BEAGLE v5.0 using default options. 14
Population stratification study was performed to assess the between breeds genetic differentiation using principal component (PC) analysis. Principal component uses SNP data generated by the R package argyle. The output files were graphically displayed using R script.
Estimation of effective population size
The prediction of Ne was calculated based on calculated LD, measured by r2, using Corbin et al, 15 approach. The relevant formula is
where
Analysis of signatures of positive selection
Three single-test statistics (XP-EHH, ΔSAF, FST), which capture the augmentation in haplotype homozygosity, or the transformation in the allele frequency spectrum (ΔSAF), or the population differentiation (FST), were identified genome-wide selection signatures on Yellow Hanwoo cattle.
Haplotype-based method
Across population, EHH (XP-EHH) analysis was used to compare the extent of haplotype homozygosity between Yellow Hanwoo with Jeju Black cattle using the software rehh v2.0. 18 The integrated site-specific EHH of each SNP in each population was computed based on Sabeti et al. 19 The natural logarithm of the ratio between iESpop1 and iESpop2 was used to compute the unstandardized XP-EHH score, which was then normalized by using median and standard deviation values. One-sided P values were derived as –log10(1-2|φ[XP-EHH]| – 0.5), where φ(XP-EHH) denotes the Gaussian distribution function.
Allele frequency spectrum-based method
ΔSAF was calculated as the directional change in the selected allele frequency between populations, so that ΔSAF = fAi − fAj, where fAi is the major allele frequency in the assumed selected Yellow Hanwoo i; likewise, fAj is the A allele frequency in the control Jeju Black j. ΔSAF scores were standardized to Z~N(0,1). The ΔSAF statistic 11 is similar to ΔDAF 20 except that the information about the ancestral and derived status of alleles at the focal SNP is not needed. Randhawa et al 11 reported on ΔDAF and ΔSAF and have found a very close relation (r2 > 0.8) in cattle data with genome-wide population analysis.
Allelic frequency differentiation-based methods
The fixation index (FST) is a widely used approach for detecting highly differentiated loci between populations. The FST employed the unbiased estimator of Weir and Cockerham 21 using PLINK v1.9 program. Smaragdov et al 22 found FST assessment obtained using PLINK program appears to be unbiased.
Composite selection signals
As all applied methodologies (XP-EHH, ΔSAF, FST) are confined to test a small limit of selective hypotheses, a combination of multiple statistics is to detect sites bring into correspondence with rejection of the neutral locus among the different approaches and can be a robust test in detecting causal variants of positive selection.
23
Therefore, identifying such selection signals will be expected to be enrichment for highly frequent long-range haplotypes, derived alleles, and population differentiation. The following process was used to compute CSS from integrating the 3 single test using Randhawa et al
11
method. For each test statistic i calculated at SNPj, to get the order of each observed test all the SNPs, the respective Rij was transformed to a fractional ranking by scaling them into the interval between 0 and 1,
Genomic regions and genes under selection
The identification of locus was performed by the selection pressure on neighboring alleles owing to hitchhiking; thus, these loci are detected to get together. 24 To reduce the noise from single tests to cause false-positives results, scan statistic was used to identify the selective regions harboring a greater than expected number of SNPs. Different from the moving window approaches, scan statistics overcome the weakness include subjective selection of the moving window size and arise naturally detecting clusters of events. In this study, the ChromoScan software (version 1.0) 25 was used to obtain statistical evidence of both a clustering of the SNP locations and clustering of extreme CSS P values for each chromosome. Consecutive clusters separated by less than 1 Mb were combined into a single cluster.
The selected regions of genomic features were then assessed on the Ensembl Genes 81 using software BioMart. 26 Genes were mapped to each genomic region under selection using its gene start and stop positions based on their Ensembl ID and associated gene name. Enrichment of genes (Ensembl gene ID) on biological processes and molecular pathways were then detected based on DAVID software 6.8. 27 Only pathways or annotations with Bonferroni-adjusted P < 10−2 were retained.
Known Quantitative Trait Loci (QTLs) that overlapped with each identified selective regions were obtained from the CattleQTL release 35 from the Animal Quantitative Trait Loci Database. Trait QTL were regarded as a trait class of “Meat and Carcass,” “Production,” “Health,” and “Reproduction,” which consisted of 64 515 QTLs. 28
Results and Discussion
Data description
After SNP QC and filtering across the Yellow Hanwoo and Jeju Black populations, there were 92 922 autosomal SNPs from 260 Yellow Hanwoo cattles and 79 849 autosomal SNPs from 132 Jeju Black cattles. The mean of estimated genomic inbreeding coefficients were 0.02 ± 0.02 for Yellow Hanwoo (ranging from 0.0001 to 0.1529) and 0.06 ± 0.04 for Jeju Black (ranging from 0.0007 to 0.2577). Overlaps of the 2 SNP data sets obtained the final set of 73 489 markers for further analysis. The inter-marker distance mean was 34.05 kb, overlapping the average interval of 70.57 kb reported on the BovineSNP50K BeadChip. 29 These results suggested that the SNPs coverage would be satisfactory.
As shown in Figure 1, PC analysis was performed. The first PC tended to separate Jeju Black from Hanwoo and explained 6% of the total variance. The genetic evidence further confirmed that Hanwoo cattle were traditionally considered to be distinct from Jeju Black cattle and shown some level of genetic difference in accordance with their geographic origin.9,30 Based on PC analysis results, all 392 animals from the 2 populations were used in the subsequent analysis.

Principal component analysis between Hanwoo (red circles) and Jeju Black (blue circles) cattle breeds, 392 animals plotted.
Historical effective population size
The Ne trends of Yellow Hanwoo and Jeju Black cattle were calculated for an SNP interval of 0.05 to 50 Mb corresponding to the last 1000 generations. The “demographic fingerprints” 17 estimated by Ne of the 2 cattle populations are shown in Figure 2. Values of Ne for both populations showed decreasing trend over the last 1000 generations, with an increasingly steeper slope since approximately 100 generations ago but a special period of increase from 950 to 850 generations ago (Figure 2), which is similar to the past Ne trends of other cattle breeds (Kerry, Belted Galloway, Angus, Jersey, and Holstein) reported by Browett et al. 31 These concordant patterns suggest that these cattle breeds might share similar demographic histories and that the evolution of these cattle was strongly affected by severe climate exchange. The estimated effective population size in the most recent generation varied from 86 for Jeju Black cattle to 374 for Yellow Hanwoo cattle. The Ne of Hanwoo was consistent with previous findings of Li and Kim. 29 To better understand different histories of migration, genetic drift, and artificial selection on the formation of cattle breeds, both Ne10/Ne100 ratio and the Ne100/Ne1000 ratio were estimated in each breed. Generally, Ne10/Ne100, representing the recent decline in Ne from ~100 to ~10 generations ago, shows the breed formation and artificial breeding period. Strucken et al 30 stated that Korea settle a cattle breeding program in the 1930s, whereas the Ne100/Ne1000 ratio denoted the past decline in Ne from ~1000 to ~100 generations ago, which indicates an intensification of population isolation. 32 Strucken et al 30 reported that progenitors of Jeju Black settled the island 1100-2000 years ago. The stronger correlation with Ne10/Ne100 ratio between Yellow Hanwoo (0.61) and Jeju Black (0.66) cattle may indicate a similar effect of artificial selection in each breed. In contrast, the Ne100/Ne1000 ratio for Yellow Hanwoo (0.21) is approximately 3 times lower than Jeju Black (0.57), which may correspond to environmental differences in these breeds. These findings indicate the impact of environmental changes like bottlenecks, migration, and introgression, rather than artificial selection pressures on the selection signatures signals, owing to the different history of the cattle breeds detected here.
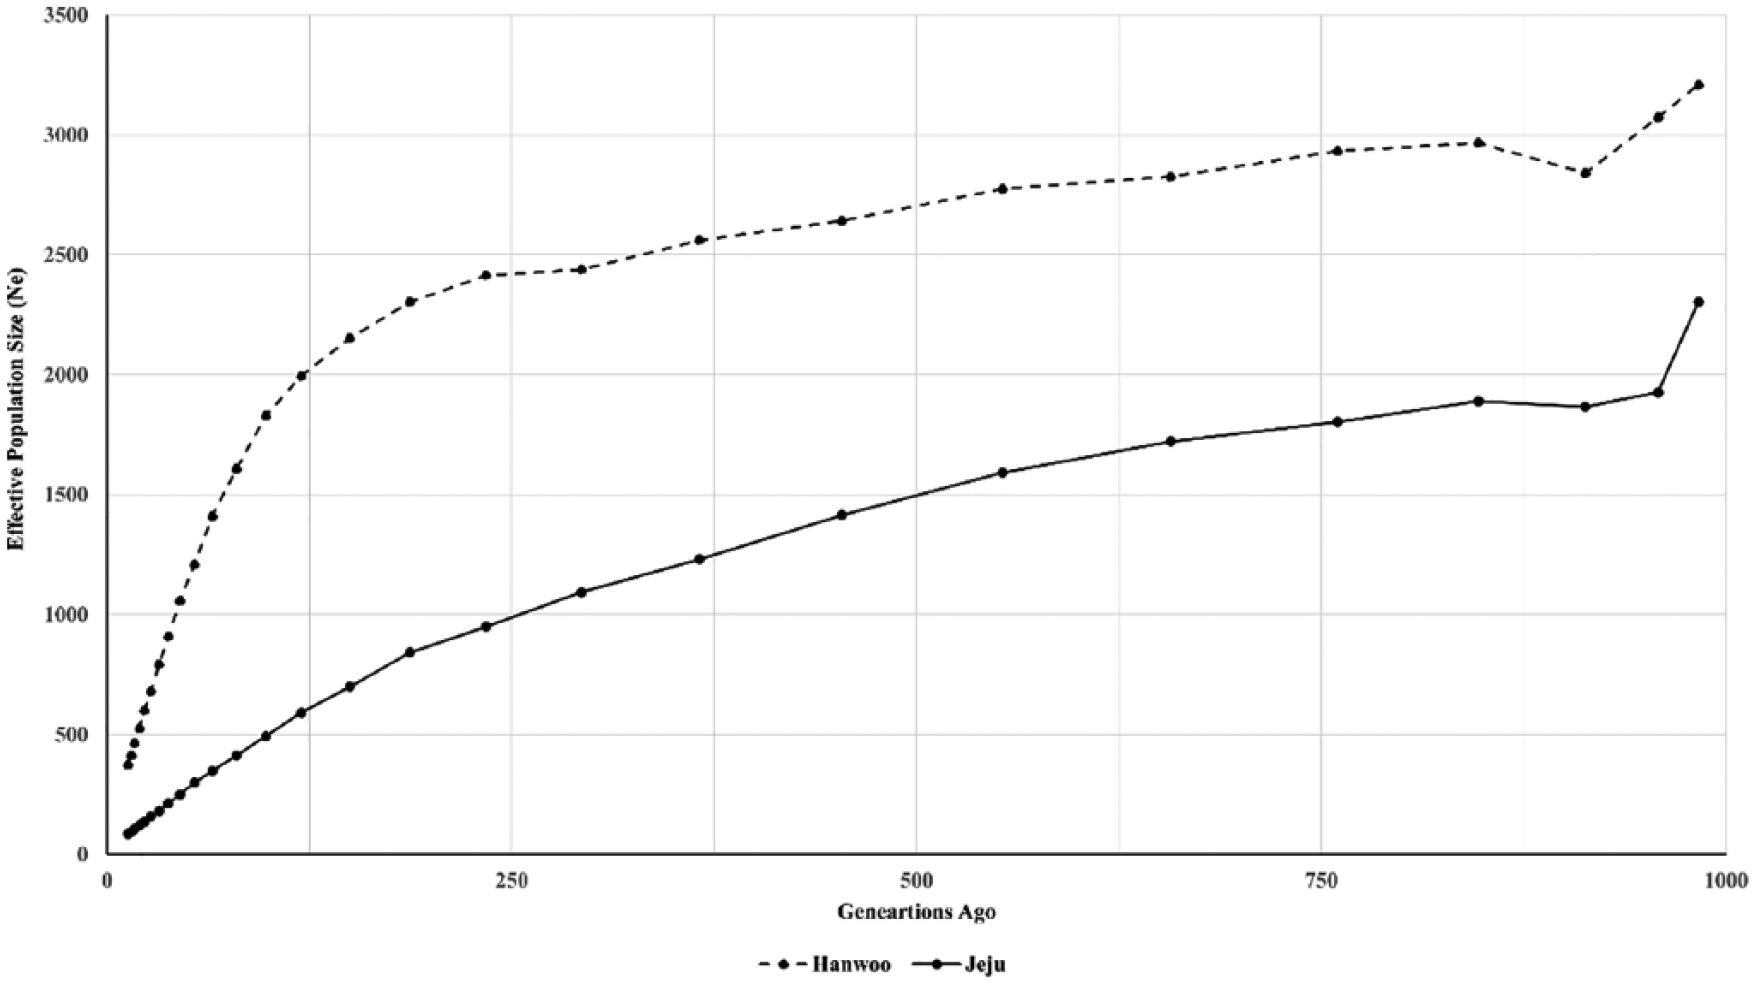
Genetic effective population size trends for Hanwoo and Jeju Black cattle in the last 1000 generations.
Genome-wide signatures of selection in the Yellow Hanwoo
The CSS findings using genome-wide scan results in the Yellow Hanwoo are illustrated in Figure 3; 24 distinct SNP crossing the genome-wide significance threshold (P < 6.28 × 10⁻⁷) were detected on 15 Bos Taurus chromosomes (ie, BTA 1, 2, 3, 4, 5, 6, 7, 8, 14, 16, 17, 18, 20, 23, and 29). The most significant SNP was found (P = 3.52 × 10⁻¹⁰) in transmembrane protein 225 (TMEM225, ENSBTAG00000033502) gene, which is located at position BTA29: 27749740. Supplementary Table S1 provides detailed information for the selective signals. One gene detected by 2 significant SNPs is a sterol carrier protein (SCP2, ENSBTAG00000003746), which is known to be an intracellular protein potentially including lipid transfer in organs involved in lipid metabolism, including mammary tissue (Figure 4). Qin et al 33 reported that the SCP2 gene may participate in the regulation and control of intramuscular fatty acid metabolism in cattle. Because intramuscular fat content is a key factor affecting meat quality, intramuscular fat content is the most important breeding goals in the national Hanwoo breeding progam.4,8 Consequently, selective breeding might lead to some genomic footprint, which could show up as the CSS value. Unsurprisingly, SCP2 was detected to overlap with QTL for myristoleic acid content. 34 The detailed functions of genes in the positive selection are outside the scope of this study, notwithstanding our study present availability of genomic information in the further studies to elucidate genetic mechanisms underlying economical traits in cattle.
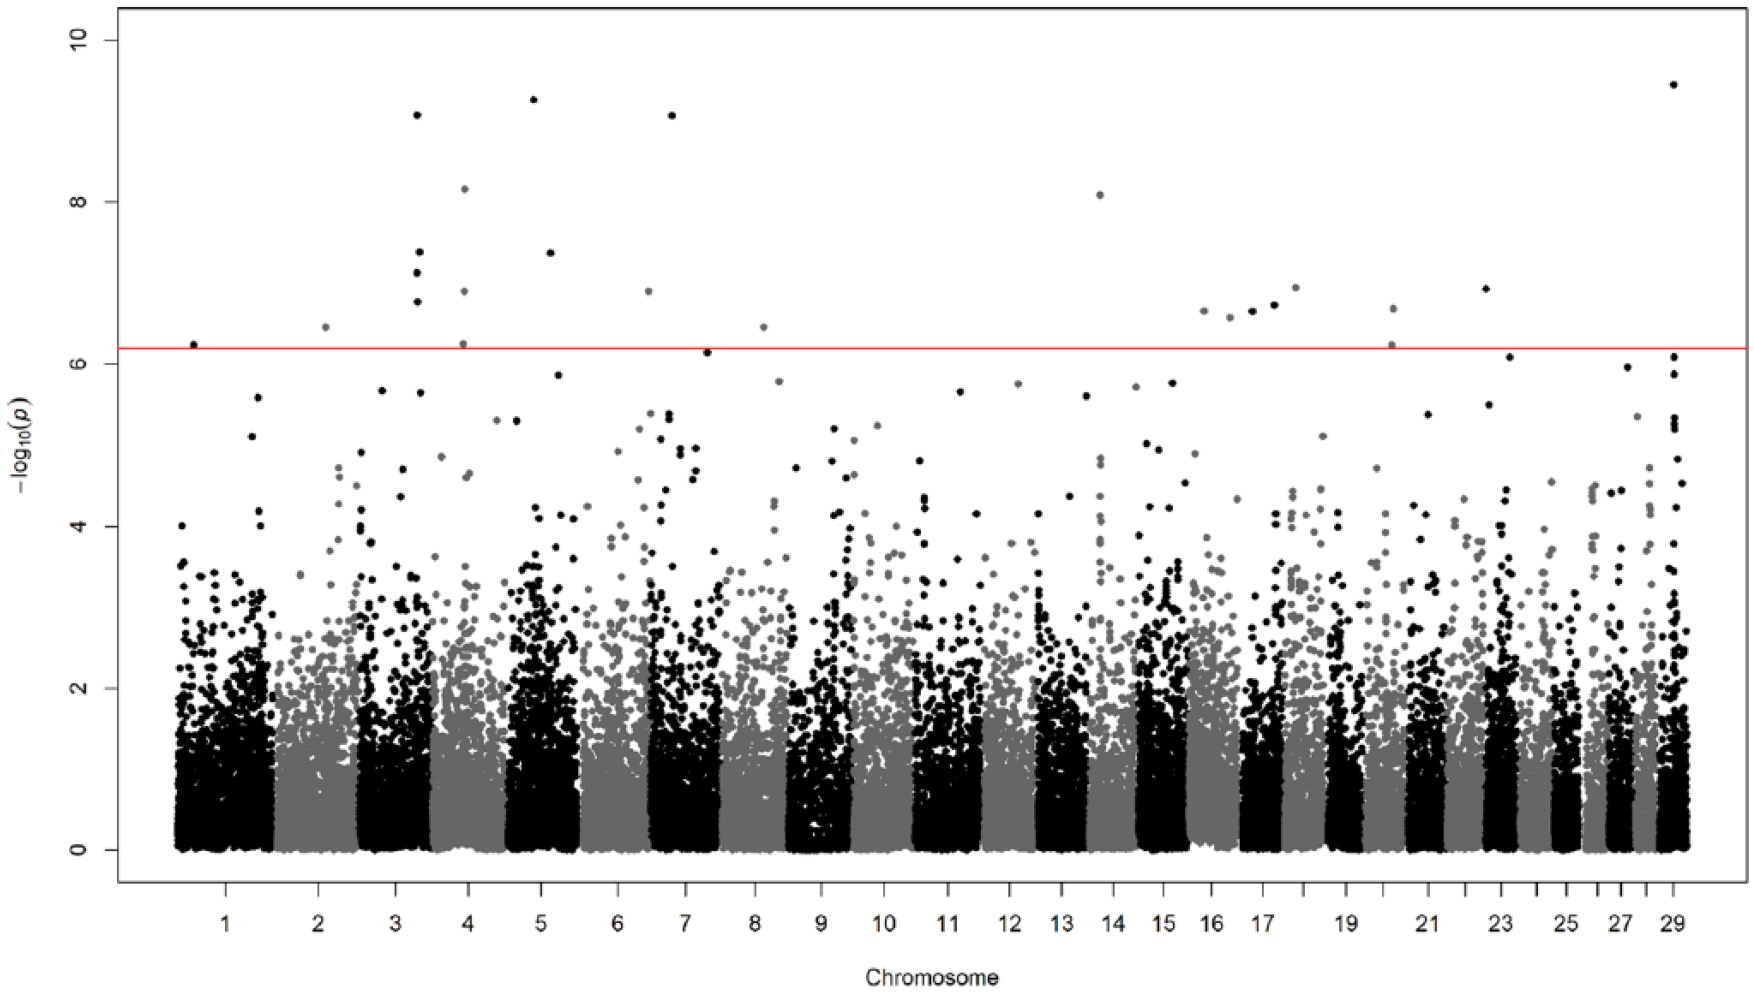
Manhattan plot of genome-wide autosomal composite selection signal (CSS) analyses of Hanwoo cattle. Red line in the CSS plots represents the genome-wide 0.5% thresholds based on the Bonferroni threshold correction.
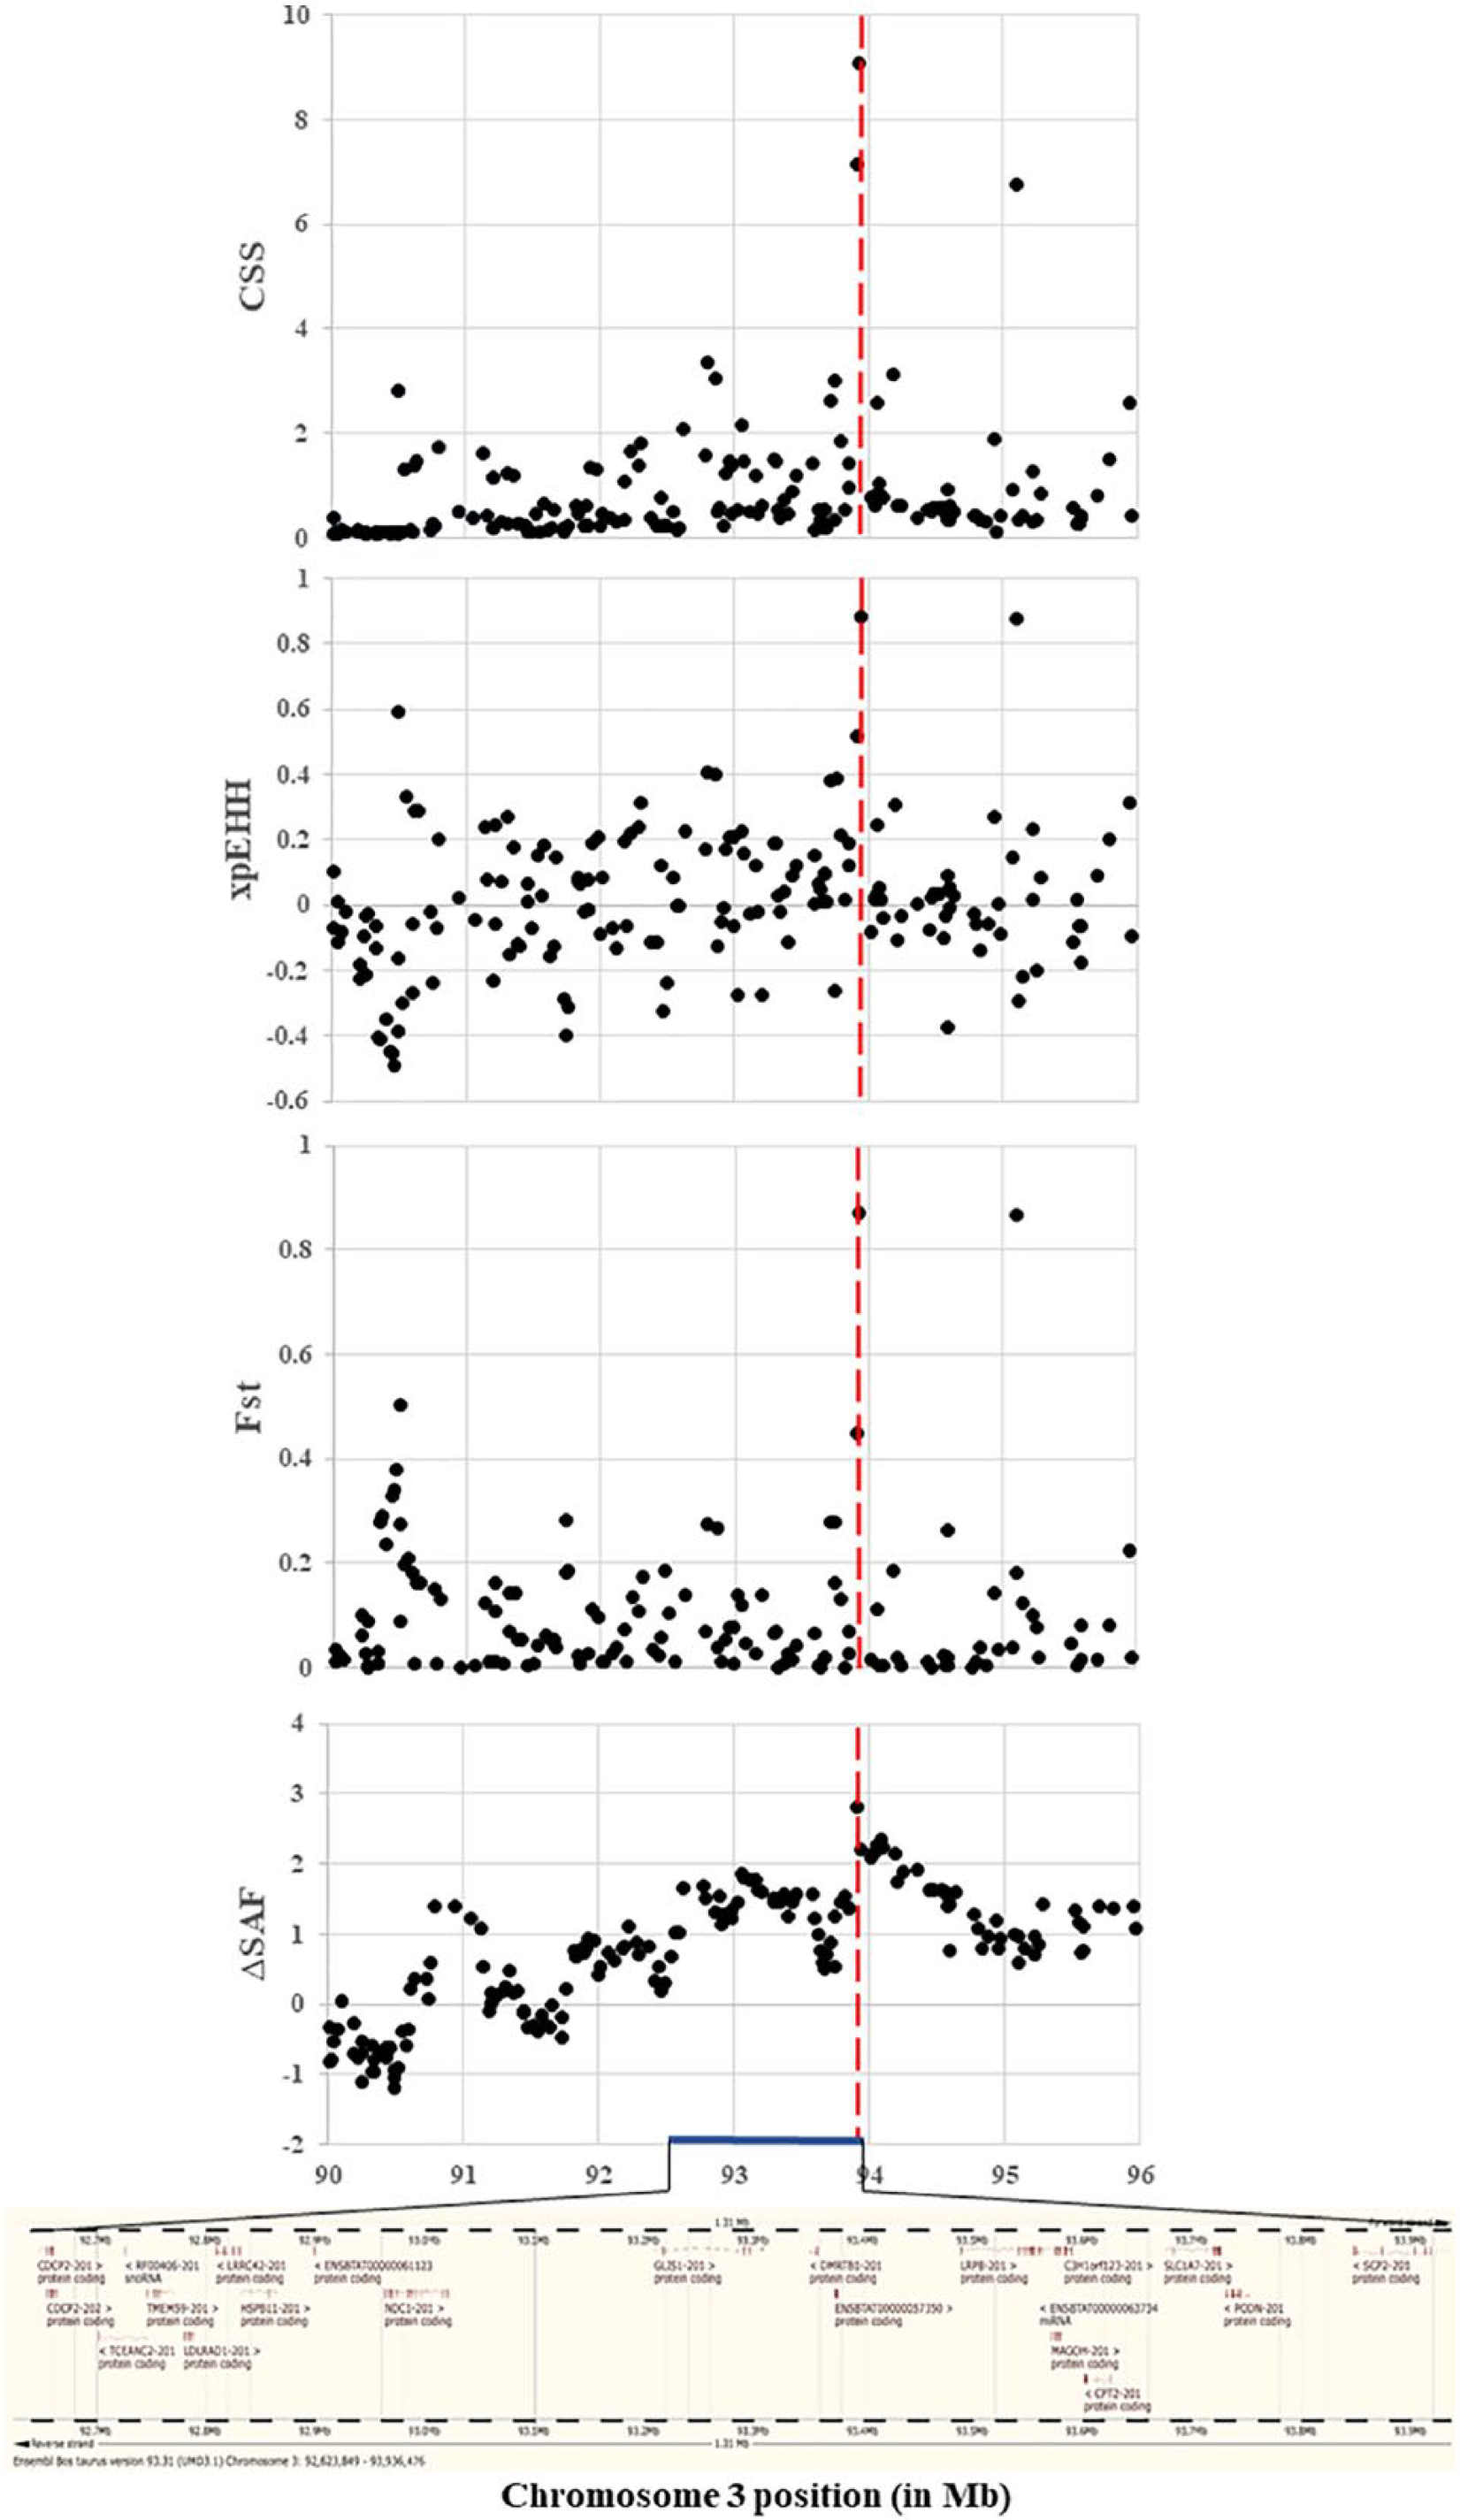
Composite selection signals, XP-EHH, ΔSAF, and FST in Hanwoo. Vertical dashed red lines represent the position of the SNP detected as highly significant in Hanwoo (Chr3: 93936476 bp, P = 8.41 × 10⁻¹⁰). The horizontal blue line marks the selective region (Chr3: 92.62-93.94 Mb).
In the interest of explaining the CSS results from different tests, a selective regional (Chr3: 92.62-93.94 Mb) plot of P values for each individual test in Yellow Hanwoo is present in Figure 4. On the same position, 3 extra figures were performed: XP-EHH, FST, and ΔSAF analyses. The selective signals that overlap among the different approaches could be the convincing result that the site has signatures of selection. Besides, this study illustrates the relevance of combining signals, which might improve the resolution of quite extended signatures and the statistical power for identifying footprints of selection.11,20 To further identify signals displaying strong footprints of selection, scan statistics were used to identify chromosomal selective regions harboring a greater than expected number of signals. 24 A total of nine statistically significant selective regions were detected (Table 1 and Table S2), which led to a list of 138 candidate genes. These genes may be an outcome of selection that is closely related to traits of interest, presenting availability of genomic information to be applied on examination of the phenotypic differences between Yellow Hanwoo and Jeju Black. To test this further, the CattleQTL database was employed and a total of 339 QTL intersecting with the selective regions advanced the understanding of the mechanisms underlying Yellow Hanwoo characteristics. These QTLs are related to several traits, for instance, meat and carcass (13 traits), production (9 traits), health (4 traits), and reproduction (12 traits). Interestingly, all the selective regions detected here overlap with the QTL identified in previously published genetic study for cattle breeds (Table 1). This may be an outcome of selection processes to encourage adaptation to environmental change, which is coincident with the aims of the formation of the Yellow Hanwoo.
Genomic regions under selection in Yello Hanwoo cattle.
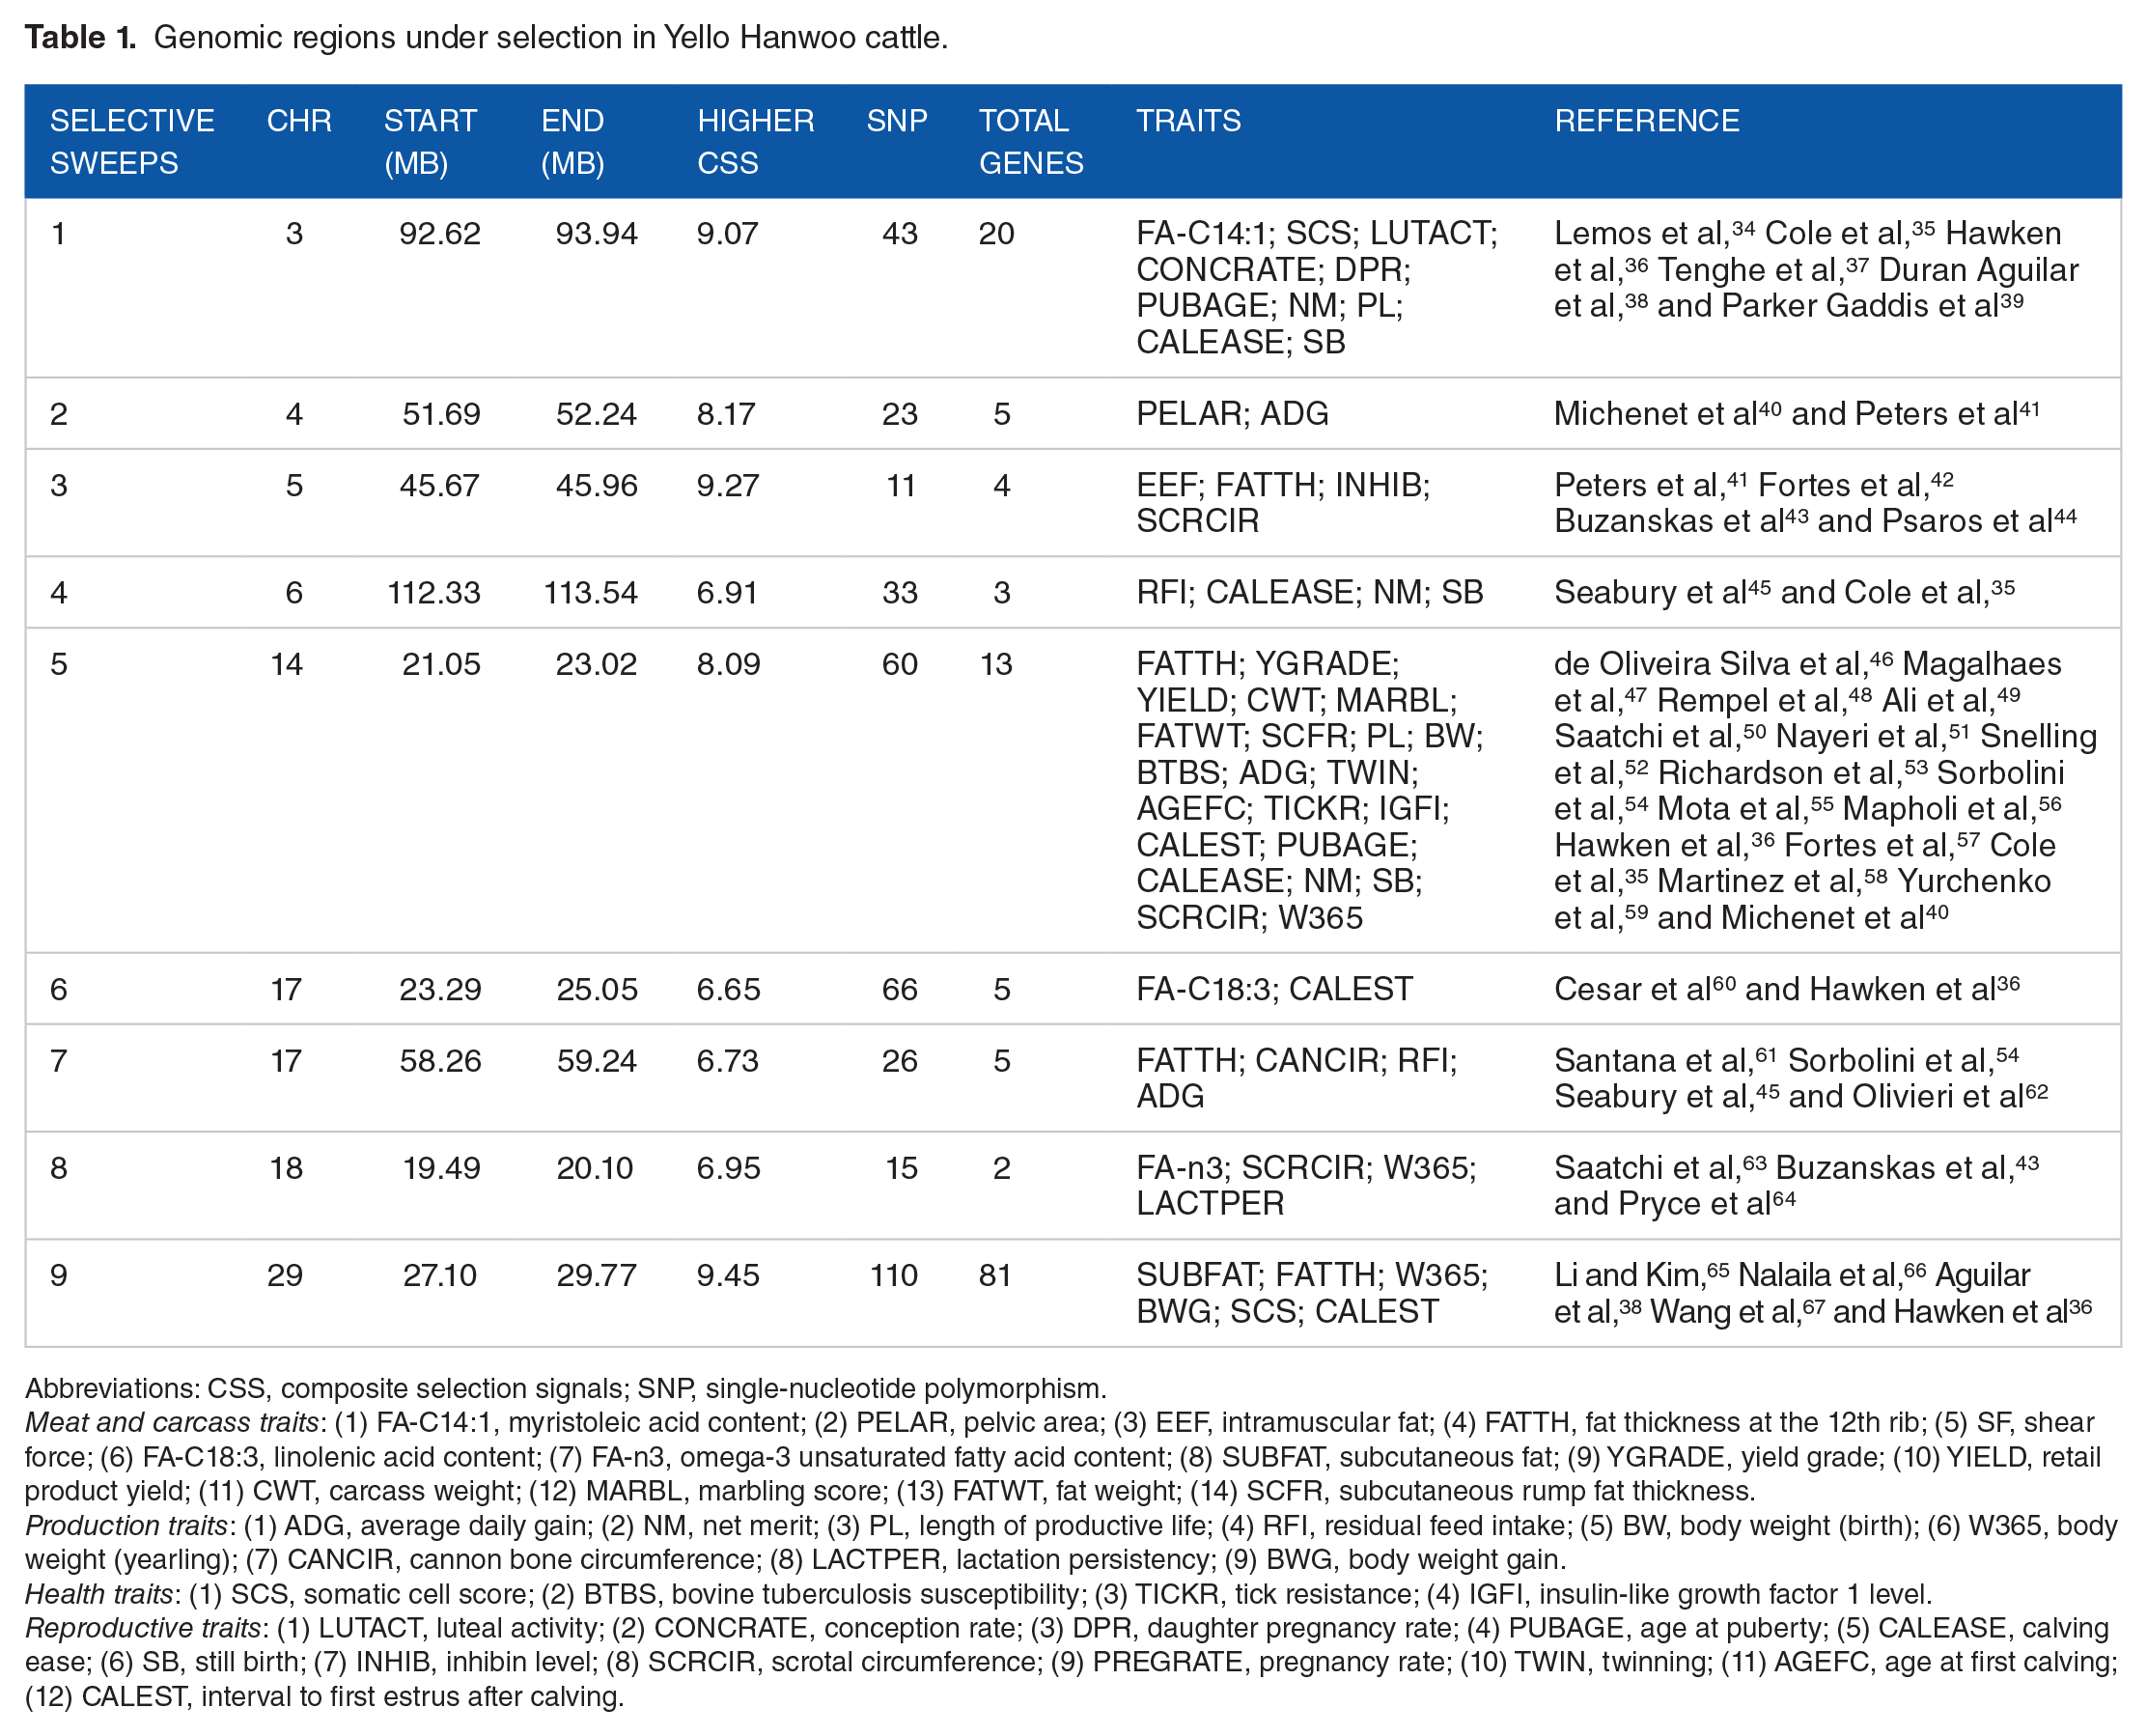
Abbreviations: CSS, composite selection signals; SNP, single-nucleotide polymorphism.
Meat and carcass traits: (1) FA-C14:1, myristoleic acid content; (2) PELAR, pelvic area; (3) EEF, intramuscular fat; (4) FATTH, fat thickness at the 12th rib; (5) SF, shear force; (6) FA-C18:3, linolenic acid content; (7) FA-n3, omega-3 unsaturated fatty acid content; (8) SUBFAT, subcutaneous fat; (9) YGRADE, yield grade; (10) YIELD, retail product yield; (11) CWT, carcass weight; (12) MARBL, marbling score; (13) FATWT, fat weight; (14) SCFR, subcutaneous rump fat thickness.
Production traits: (1) ADG, average daily gain; (2) NM, net merit; (3) PL, length of productive life; (4) RFI, residual feed intake; (5) BW, body weight (birth); (6) W365, body weight (yearling); (7) CANCIR, cannon bone circumference; (8) LACTPER, lactation persistency; (9) BWG, body weight gain.
Health traits: (1) SCS, somatic cell score; (2) BTBS, bovine tuberculosis susceptibility; (3) TICKR, tick resistance; (4) IGFI, insulin-like growth factor 1 level.
Reproductive traits: (1) LUTACT, luteal activity; (2) CONCRATE, conception rate; (3) DPR, daughter pregnancy rate; (4) PUBAGE, age at puberty; (5) CALEASE, calving ease; (6) SB, still birth; (7) INHIB, inhibin level; (8) SCRCIR, scrotal circumference; (9) PREGRATE, pregnancy rate; (10) TWIN, twinning; (11) AGEFC, age at first calving; (12) CALEST, interval to first estrus after calving.
For providing a whole view of the types of genes or pathways that were performed among the 138 candidate Ensembl Genes (Table S2), the DAVID tool was used for their Gene Ontology (GO) categories and Kyoto Encyclopedia of Genes and Genomes (KEGG) pathways (Table 2). The KEGG pathway study found a major enrichment of genes (eg, OR10D3, OR8D2, OR8D4, and OR8D8) gathered in sensory perception (bta04740, olfactory transduction; Bonferroni-corrected P < .01; Table 1). The olfactory receptor interacts with odor molecules in the nose, initiating a neuronal response that triggers olfactory perception. For cattle, olfactory receptors are necessary to forage and to avoid eating toxic food.68,69 Jeju Black were formatted in the absence of food and graze in the field. Yellow Hanwoo, however, have been artificially selected for intensive production. The cause of olfactory genes might therefore to adapt to these environments.
Summary of the results from the enrichment analysis.

Abbreviations: GO, gene ontology; KEGG, Kyoto Encyclopedia of Genes and Genomes.
The GO and KEGG analysis performed with DAVID 6.8.
P values are Bonferroni-corrected P values ⩽10−2.
The GO study detected a significant over-representation of genes list involved in the G-protein-coupled receptor signaling pathway (GO:0007186). G-protein-coupled receptors (GPCR), also referred as free fatty acid receptors (FFAR), potentially affect immune response in cattle. 70 Moreover, we found SNP frequency differences between Yellow Hanwoo and Black Jeju cattle, which might be the reasonable cause to the superior resistance to metabolic disorders via an immune system response. Thus, these gene sets represent availability of genomic information to further study how these genes are genetically related to immune response in Yellow Hanwoo.
Supplemental Material
sj-pdf-1-evb-10.1177_1176934319859001 – Supplemental material for Identifying Loci Under Positive Selection in Yellow Korean Cattle (Hanwoo)
Supplemental material, sj-pdf-1-evb-10.1177_1176934319859001 for Identifying Loci Under Positive Selection in Yellow Korean Cattle (Hanwoo) by Yi Li, Yun-Mi Lee, You-Sam Kim, Se-Pil Park and Jong-Joo Kim in Evolutionary Bioinformatics
Supplemental Material
sj-pdf-2-evb-10.1177_1176934319859001 – Supplemental material for Identifying Loci Under Positive Selection in Yellow Korean Cattle (Hanwoo)
Supplemental material, sj-pdf-2-evb-10.1177_1176934319859001 for Identifying Loci Under Positive Selection in Yellow Korean Cattle (Hanwoo) by Yi Li, Yun-Mi Lee, You-Sam Kim, Se-Pil Park and Jong-Joo Kim in Evolutionary Bioinformatics
Footnotes
Acknowledgements
The authors gratefully acknowledge Imtiaz Randhawa for providing the R script of composite selection signals method.
Funding:
The author(s) disclosed receipt of the following financial support for the research, authorship, and/or publication of this article: This work was supported by Program for the Outstanding Innovative Teams of Higher Learning Institutions of Shanxi (Yi Li), the National Natural Science Foundation of China (31501002; Yi Li), and the Fund for Shanxi “1331 Project” Key Innovative Research Team (Yi Li). Jong-Joo Kim was financially supported by a grant (715003-07) from the Research Center for Production Management and Technical Development for High-Quality Livestock Products through Agriculture, Food and Rural Affairs Research Center Program, Ministry of Agriculture, Food and Rural Affairs)
Declaration of conflicting interests:
The author(s) declared no potential conflicts of interest with respect to the research, authorship, and/or publication of this article.
Author Contributions
YL and JJK conceived and designed the experiment; YL, YML, and YSK analyzed the data; YL and JJK drafted and polished the paper; SPP provided the genotype data and samples of Jeju Black cattle. All contributing authors have reviewed the manuscript and approved the submitting of final manuscript.
Supplemental Material
Supplemental material for this article is available online.
References
Supplementary Material
Please find the following supplemental material available below.
For Open Access articles published under a Creative Commons License, all supplemental material carries the same license as the article it is associated with.
For non-Open Access articles published, all supplemental material carries a non-exclusive license, and permission requests for re-use of supplemental material or any part of supplemental material shall be sent directly to the copyright owner as specified in the copyright notice associated with the article.