
Abstract
Protozoa parasites are responsible for several diseases in tropical countries, such as malaria, sleeping sickness, Chagas disease, leishmaniasis, amebiasis, and giardiasis, which together threaten millions of people around the world. In addition, most of the classic parasitic diseases due to protozoa are zoonotic. Understanding the biology of these organisms plays a relevant role in combating these diseases. Using homology inference and comparative genomics, this study targeted 3 protozoan species from different Phyla: Cryptosporidium muris (Apicomplexa), Entamoeba invadens (Amoebozoa), and Trypanosoma grayi (Euglenozoa). In this study, we propose a new approach for the identification of homologs, based on the reconciliation of the results of 2 different homology inference software programs. Our results showed that 46.1% (59/128) of the groups inferred by our reconciliation approach could be validated using this methodology. These validated groups are here called homologous Supergroups and were compared with SUPERFAMILY and Pfam Clans.
Introduction
Protozoa are unicellular eukaryotes that have a wide variety of structural complexity. 1 There are about 200 000 named species of protozoan of which nearly 10 000 are parasitic. 2 According to the Centers for Disease Control and Prevention, protozoan parasitic infections constitute one of the most important causes of mortality and morbidity in humans, in both the tropics and subtropics as well as in more temperate climates. 3 Most of the classic parasitic diseases due to protozoa are zoonotic, 4 and increasing understanding of the organisms that cause them is of fundamental importance for the treatment of their diseases.
Detection of common evolutionary origin, named homology, is a primary means of inferring protein structure and function. 5 Paralogs and orthologs are 2 fundamentally different types of homology: duplication and speciation, both from a single ancestral gene. 6 To assign functions to proteins and study their evolution, comparative studies have been extensively performed on complete genomes.7,8 Among others, OrthoMCL, 9 that uses Markov clustering (MCL) on the results from an all-versus-all BLASTp 10 to infer orthologs and paralogs as well as OMA, 11 which is based on evolutionary distances to infer orthologs among complete genomes, has been used for homology inference. Orthology inference can be used to transfer functional annotation among proteins, aided by the comparison between the query sequences and annotated databases such as RefSeq, 12 TrEMBL, 13 UniProt, 14 the Conserved Domain Database (CDD), 15 and Pfam. 16 Besides that, the inference of distant homologs (homologs with a distant common ancestor and a less conserved sequence) during the past years has been useful for the inference of protein families and superfamilies. 17 Databases such as SUPERFAMILY 18 and Pfam Clans 19 provide the most distantly related domains and so highest level for useful remote homology detection. 18
Since the publication of protozoan complete genome sequences, including Leishmania major, 20 Trypanosoma cruzi, 21 Trypanosoma brucei, 22 and more recently Trypanosoma grayi, 8 all belonging to the trypanosomatid clade, those genomic data helped to increase our understanding on those species evolution, their primary immune evasion strategy, and also the evolution of their cell surface molecules that represent the host-parasite interface.23,24 For instance, pan genomics studies of disparate strains of T. brucei, genome-wide studies, allowed the identification of significant host and geographic location associations. Strong purifying selection was detected in genomic regions associated with cytoskeleton structure and regulatory genes associated with antigenic variation, suggesting conservation of these regions in African trypanosomes. 25
In addition to trypanosomatid species, protozoan parasites of the Cryptosporidium genus also infect hosts across a range of vertebrates, from fishes to humans. 26 However, to the best of our knowledge, Cryptosporidium extensive comparative genomics has not been done to date, except loci genotyping to compare species, 27 lacking information about evolutionary relationships among those species. Entamoeba invadens is a parasite of reptiles that is closely related to Entamoeba histolytica, a known human intestinal parasite. Evolutionary studies on this species will help us to improve our knowledge and understanding of the genus. The evolution of parasitism is a central problem in evolutionary biology 28 ; the sequence conservation/variability analyses are good approaches to infer homology relationships. 29
In this study, 3 protozoa species belonging to different phyla were used for our reconciliation-based method: Cryptosporidium muris (Apicomplexa), E. invadens (Amoebozoa), and T. grayi (Euglenozoa). As far as we know, those species have not been used for comparative genomics studies before; they look appropriate to test the inference of homologous groups in distant Protozoa species.
In this analysis, 2 different software were used to homology detection: (1) OrthoMCL and (2) OMA. Our study aimed to identify homologous groups that could not be inferred separately either using OMA or OrthoMCL, using a reconciliation of those different methodologies and validating our results using (1) conserved domains (CDD) and (2) protein domain families (Pfam-A). These new homologous groups inferred by our reconciliation approach were called homologous Supergroups. We considered Supergroups, all inferred new homologous groups that had an increase in their number of proteins in relation to all homologous groups that originated it, and presented: (1) same conserved domain (CDD) or (2) same protein family (Pfam-A) in all proteins. The homologous Supergroups inferred by us were later compared with Pfam Clans and SUPERFAMILY databases.
Materials and Methods
A synthesis of our methodology is shown in Figure 1.

Flowchart of the study: description of the methodology used in this study for the inference of homologous Supergroups.
Data set
Proteins from complete genomes of C. muris (GCF_000006515.1_JCVI_cmg_v1.0), E. invadens (GCF_000330505.1_EIA2_v2), and T. grayi (GCF_000691245.1_Tgr_V1) were obtained from RefSeq/NCBI (ftp.ncbi.nlm.nih.gov/genomes/refseq/protozoa) in fasta format. The complete data set has 26 514 proteins, from these 14.83% (3934/26 514) are from C. muris, 45.24% (11 997/26 514) from E. invadens, and 39.87% (10 583/26 514) from T. grayi.
Homologous groups identification using OMA and OrthoMCL
Two software were used in this study to identify homologous proteins: OMA and OrthoMCL. OrthoMCL 2.2 was obtained from orthomcl.org (http://orthomcl.org/common/downloads/software/) and used together with BLAST version 2.5.0+ (ftp://ftp.ncbi.nlm.nih.gov/blast/executables/blast+/LATEST/). We used 1E−05 as e-value cutoff, according to the protocol described by Coutinho et al. 30 OMA version 1.0.1 was obtained from omabrowser.org (http://omabrowser.org/standalone/) and executed with default parameters.
Reconciliation algorithm—inference of Supergroups
Our reconciliation algorithm (Additional file 1; Figure 2) divided the homologous groups inferred using OrthoMCL and OMA into 3 categories, according to the degree of agreement between them, namely, “Identical groups” (called Category I), formed by homologous groups where the 2 software agreed, containing exactly the same proteins; “Divergent with intersections” (called Category II), formed by homologous groups that are not identical among the 2 software, but they shared at least 1 protein in common; and “No intersections” (Category III), formed by homologous groups where no protein is shared among the results of the 2 software. In this work, new groups were inferred only by reconciliation of homologous groups of Category II.

The reconciliation algorithm. Method to infer homologous groups using the reconciliation of OrthoMCL and OMA results in Category II: “Divergent wit intersections” were the homologous groups that had at least 1 protein in common between the results of the 2 software and generated homologous Supergroups.
In this work, only Category II was used for the inference of the Supergroups, joining the homologous groups that have at least 1 protein in common.
Supergroups validation
Aiming to validate the new groups formed (called Category II), 2 approaches with high stringency criteria were used: (approach 1) checking whether all proteins in a new group have the same conserved domain (CDD) or (approach 2) checking whether all the proteins in a new group belong to the same protein family (Pfam-A).
Conserved domain validation (CDD)
RPS-BLAST version 2.2.13 (https://www.ncbi.nlm.nih.gov/) was used to infer conserved domains against CDD version—CDD.v3.12 (https://www.ncbi.nlm.nih.gov/Structure/cdd/cdd.shtml). Default parameters were used except for e-value where a 1E−05 cutoff was used.
Protein family validation (Pfam-A)
To obtain protein family predictions from Pfam-A, we used CLADE 31 tool. The software and model library can be downloaded at the software portal (http://www.lcqb.upmc.fr/CLADE). We also used 1E−05 as e-value cutoff and the remaining program parameters were executed using default values.
Comparison with SUPERFAMILY and Pfam Clans databases
For comparative purposes, the proteins of each inferred Supergroup were mapped to SUPERFAMILY and Pfam Clans databases using an e-value 1E−05 as cutoff.
Evolutionary distance inference
To calculate the larger evolutionary distance for each homologous group, we used Belvu 32 version “Ubuntu 12.04.3 64bit” (http://sonnhammer.sbc.su.se/download/software/belvu/), with the following parameters: “Tree options: Use Scoredist distance correction (default)” and “Print distance matrix and exit.” The Belvu uses Percent Accepted (point) Mutation (PAM), to denote a measure for evolutionary distance between 2 aligned sequences; the term was introduced by Dayhoff et al. 33
Sequence conservation
To evaluate sequence conservation, multiple alignments were generated to each of the new groups inferred in Category II of this study, using MAFFT software, version 7.271, with its default parameters. Alistat software, available in Hmmer version 3.0, was used to generate the multiple alignment statistics.
Functional categorization
The functional categorization was performed using similarity analysis with Hmmer 34 version 3.0 (http://eddylab.org/software/hmmer3/3.0/) against the database of orthologous genes—eggNOG 35 version 4 (ftp://eggnog.embl.de/eggNOG/4.0/). To infer to which functional category each protein belongs, an e-value cutoff of 1E−05 was used, with the remaining parameters with default values.
KEGG pathways’ analysis
Pathways were assigned in this study, using similarity analysis with BLASTP (protein-protein BLAST) software version 2.5.0+ (ftp://ftp.ncbi.nlm.nih.gov/blast/executables/blast+/2.5.0/) against the database of eukaryotes and prokaryotes genes of the Kyoto Encyclopedia of Genes and Genomes: KEGG version “September 2016” (ftp://ftp.bioinformatics.jp/kegg/genes/fasta/). We also used 1E−05 as BLAST e-value cutoff and the program was executed with default parameters.
Results
Percentage of genome contributing to homologous groups
In the OrthoMCL analysis, T. grayi showed the smaller percentage of homologues with 32.2% (3835/10 583), followed by C. muris with 42.2% (1661/3934), and E. invadens, with 78.1% (9368/11 997), covering 56.06% (14 864/26 514) of the data set (Figure 3A). In the OMA analysis, E. invadens showed the smaller percentage of homologues with 8% (964/11 997), followed by T. grayi with 9.7% (1028/10 583) and C. muris with 21.7% (852/3934) covering 10.72% (2844/26 514) of the data set (Figure 3B). Taking into account only the orthologous groups, OrthoMCL still had a larger number of proteins contributing: OrthoMCL 21.36% (5665/26 514).

Percentage of the genome contributing to the homologous groups. (A) Percent of proteins present in OrthoMCL groups by species. The OrthoMCL was executed using e-value 1E−05 cutoff. (B) Number of proteins present in OMA groups by species. OMA was executed with default parameters.
Identification of homologous groups using OMA and OrthoMCL
In this study, OrthoMCL inferred 3092 homologous groups, covering 56.1% of data set (14 864/26 514 proteins). From these groups, 52.1% (1611/3092) are paralogous groups, being 32.1% (994/3092) paralogs of E. invadens, 16.3% of T. grayi, and only 3.7% (114/3092) are formed by C. muris paralogs. However, the analysis of OrthoMCL has shown that 47.9% (1481/3092) are orthologous groups and are divided as follows: 31.3% (969/3092) are groups without paralogs (exclusively orthologs) and 16.6% (512/3092) are groups with orthologous and paralogous proteins. In the orthologous group, inferred using OrthoMCL, it was observed that 24.5% (758/3092) are shared by the 3 species, whereas 23.4% (723/3092) of the groups are shared by 2 species, showing the following distribution: 5.3% (164/3092) are groups shared by E. invadens and C. muris, 8% (245/3092) are groups shared by E. invadens and T. grayi, and 10.1% (314/3092) are groups shared by C. muris and T. grayi. OMA inferred 1231 orthologous groups, covering 10.7% of data set (2844/26 514 proteins), and in this case, the following distribution was observed: with 3 species, 31.1% (382/1231); with 2 species, 30.8% (379/1231) are groups shared by E. invadens and T. grayi; 21.6% (267/1231) by C. muris and T. grayi; and 16.5% (203/1231) by E. invadens and C. muris (Table 1).
Homologous groups inferred using OrthoMCL and OMA.

Abbreviations: C. muris, Cryptosporidium muris; E. invadens, Entamoeba invadens; T. grayi, Trypanosoma grayi.
Reconciliation algorithm—inference of Supergroups
A synthesis of the 3 categories created by the level of agreement between OrthoMCL and OMA, as a result of the reconciliation approach proposed in this study, is shown as follows. The number of homologous groups in each of the categories is shown as follows: Category I: “Identical groups” which corresponds to 14.4% (445/3092) of OrthoMCL homologous groups and to 36.1% (445/1231) of OMA homologous groups. In addition, our analysis showed that OrthoMCL inferred 19.3% (596/3092) of its homologous groups belonging to Category II: “Divergent with intersections,” whereas OMA inferred 58.4% (719/1231) belonging to the same category. Finally, OrthoMCL inferred 63.3% (2051/3092) of its homologous groups belonging to the Category III: “No intersections,” whereas OMA inferred 5.4% (67/1231) belonging to this category (Table 2).
Categories of the reconciliation approach proposed in this study.
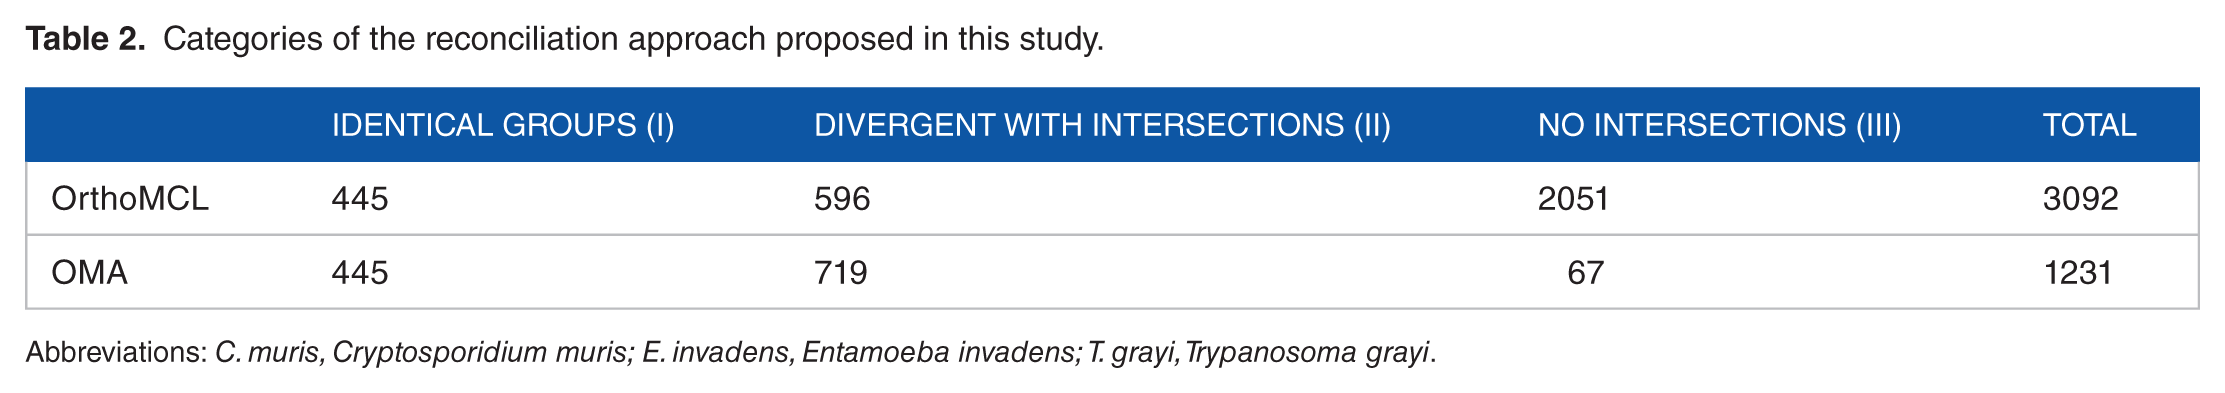
Abbreviations: C. muris, Cryptosporidium muris; E. invadens, Entamoeba invadens; T. grayi, Trypanosoma grayi.
Category II validation results
Based on the groups of Category II, “Divergent with intersections,” 537 new groups were inferred resulting from the reconciliation between OMA and OrthoMCL results. Of these, 76.16% (409/537) are groups that did not increase their number of proteins in relation to all the homologous groups that originated it and are therefore OrthoMCL groups with one or more OMA groups contained or vice versa and were, therefore, discarded from our analysis.
In addition, 23.8% (128/537) of new groups inferred by the reconciliation algorithm had an increase in their number of proteins (in relation to all the homologous groups that originated it), among those new groups, 46.1% (59/128) were validated (Figure 4) (fasta files in Additional file 2), presenting the same conserved domain (CDD) or the same protein family (Pfam-A) in all their proteins and will be called from here of homologous Supergroups.

Validation by conserved domain (CDD) and protein family (Pfam-A) in Supergroups. The homologous Supergroups were validated checking whether all their proteins have the same conserved domain (CDD) (approach 1) and checking whether all their proteins belong to the same protein family (Pfam-A) (approach 2). About 46.1% (59/128) presented exactly the same conserved domain or exactly the same protein family of the proteins, 34.4% (44/128) presented at least 1 protein with different conserved domains and with different protein family and 19.5% (25/128) presented at least 1 protein without conserved domain and protein family identified.
The 59 Supergroups presented the following distribution: 59.3% (35/59) were shared by the 3 species and formed by 46 OrthoMCL groups and 67 OMA groups, 1.7% (1/59) shared by C. muris and E. invadens (formed by 1 OrthoMCL group and 1 OMA group), 10.2% (6/59) shared by C. muris and T. grayi (formed by 7 OrthoMCL groups and 6 OMA groups), and 28.8% (17/59) shared by T. grayi and E. invadens (formed by 21 OrthoMCL groups and 20 OMA groups). The new distribution of the homologous groups inferred in this study is shown in Figure 5.

New distribution of the homologous groups inferred in this study. After the inference of homologous Supergroups, there was a decrease in the number of homologous groups inferred using OrthoMCL and OMA, as some of their groups were fusioned to form the Supergroups. The total of inferred homologues in this study is the sum of the homologues inferred using OrthoMCL with the inferred homologues using OMA and the 59 homologous Supergroups.
Among non-validated new groups (69/128), 63.8% (44/69) presented at least 1 protein with different conserved domains and with different protein families and 36.2% (25/69) presented at least 1 protein without conserved domain or protein family identified.
Comparison with SUPERFAMILY and Pfam Clans databases
The comparison of 59 homologous Supergroups with SUPERFAMILY and Pfam Clans databases has shown that 81.4% (48/59) of Supergroups have all their proteins belonging to the same SUPERFAMILY. Although 89.3% (53/59) of the Supergroups have all proteins belonging to the same protein family (Pfam-A), only 78% (46/59) have proteins belonging to the same Pfam Clan. This may be explained because protein families (Pfam-A) identified in 20.3% (12/59) of the Supergroups do not belong to any Pfam Clan (Additional file 3). A table listing several distant homology inference methods is presented in Table 3.
Comparison between the methods of distant homology inference.

Sequence conservation
Multiple alignments for all 59 Supergroups (Additional file 4) were created and size ranged from 150 to 1311 amino acids. Multiple alignments presented more than 34.51% of average identity in the sequences of each Supergroup and 32.29% of average identity between the 2 more distant sequences.
As a parameter of comparison, the new groups that were not validated (69/128) by CDD or Pfam presented multiple alignments with size ranging from 129 to 19 451 amino acids with 29.04% of average identity in their sequences and 27.71% of average between most distance sequences. Figure 6 shows, as an example, conserved domains recognized by CDD in the multiple alignment of SG_562 Supergroup.

Example of conserved domains recognized by CDD in multiple alignments of Supergroups highlighted in red: (a) PP2Cc domain recognized in all proteins of the SG_562 and (b) Cation_efflux domain recognized in all proteins of the SG_721. Viewed in Jalview version 2.10.4.
Evolutionary distance inference
The analysis of results of Belvu program showed that the homologous Supergroups inferred in this study presented greater evolutionary distances when compared with homologous groups inferred using OrthoMCL and OMA (Figure 7). Regarding Supergroups, the mean evolutionary distance was 151.77 PAM, with a minimum evolutionary distance of 80.37 PAM and maximum evolutionary distance of 292.28 PAM.

Boxplot representing the evolutionary distances of the homologous groups inferred in this study. The homologous Supergroups presented greater evolutionary distances when compared with other homologous groups inferred. (Wilcoxon-Mann-Whitney test: OrthoMCL/Supergroups p-value: 0.0005238 and OMA/Supergroups p-value: 0.0000004886).
Functional categorization
The functional categorization of the 59 Supergroups showed that 32.1% (19/59) belong to the S functional category with unknown function, 3.4% (2/59) have no functional category inferred yet, 22% (13/59) belong to functional category T: “Signal transduction mechanisms,” 6.8% (4/59) belong to functional category O: “Posttranslational modification, protein turnover, chaperones”; 10.2% (6/59) belong to functional category E: “Amino acid transport and metabolism”; 5.1% (3/59) belong to functional category J: “Translation, ribosomal structure and biogenesis”; 6.8% (4/59) belong to functional category U: “Intracellular trafficking, secretion, and vesicular transport.” The functional categories—B: “Chromatin structure and dynamics,” L: “Replication,” P: “Inorganic ion transport and metabolism,” C: “Energy production and conversion,” H: “Coenzyme transport and metabolism,” and K: “Transcription”—presented 1.7% (1/59) each, with 1 Supergroup belonging to each one of these categories. Besides that, 2 Supergroups presented proteins that belong to distinct functional categories as follows: 1.7% (1/59) belong to J and O categories and 1.7% (1/59) belong to P and U categories (Figure 8). Therefore, each of the 57 Supergroups (96.6% or 57/59) presented all their proteins belonging to the same functional category inside the Supergroup (Additional file 5).

Functional category inferred to proteins of the 59 Supergroups: [B] Chromatin structure and dynamics; [C] Energy production and conversion; [E] Amino acid transport and metabolism; [H] Coenzyme transport and metabolism; [J] Translation, ribosomal structure, and biogenesis; [K] Transcription; [L] Replication; [O] Posttranslational modification, protein turnover, chaperones; [P] Inorganic ion transport and metabolism; [S] Function unknown; [T] Signal transduction mechanisms; [U] Intracellular trafficking, secretion, and vesicular transport.
KEGG pathway
The result of the analysis performed by the BLASTP among the database of eukaryotes and prokaryotes genes of KEGG has shown that 61% (36/59) of the Supergroups have proteins that participate in at least 1 KEGG pathway (Additional file 6). Of these, we found 21.6% (6/36) Supergroups belonging to “Metabolism” pathway, and we chose these to be used as case study (Table 4) as follows: (a) the Supergroup SG_1364 containing 4 proteins had as best hit KEGG ortholog group K01507; (b) the Supergroup SG_1363 containing 4 proteins had as best hit KEGG ortholog group K19787; (c) the Supergroup SG_1634 containing 4 proteins had as best hit KEGG ortholog group K04487; (d) the Supergroup SG_843 with 5 proteins had as best hit KEGG ortholog group K10251; (e) the Supergroup SG_1241 containing 5 proteins belonging to E. invadens and T. grayi had as best hits 2 KEGG ortholog groups, (1) K01697 and (2) K01738; (f) the Supergroup SG_711 containing 5 proteins belonging to E. invadens and T. grayi had as best hit KEGG ortholog group K01760.
Supergroups belonging to “Metabolism” pathway, chosen to be used as a case study.
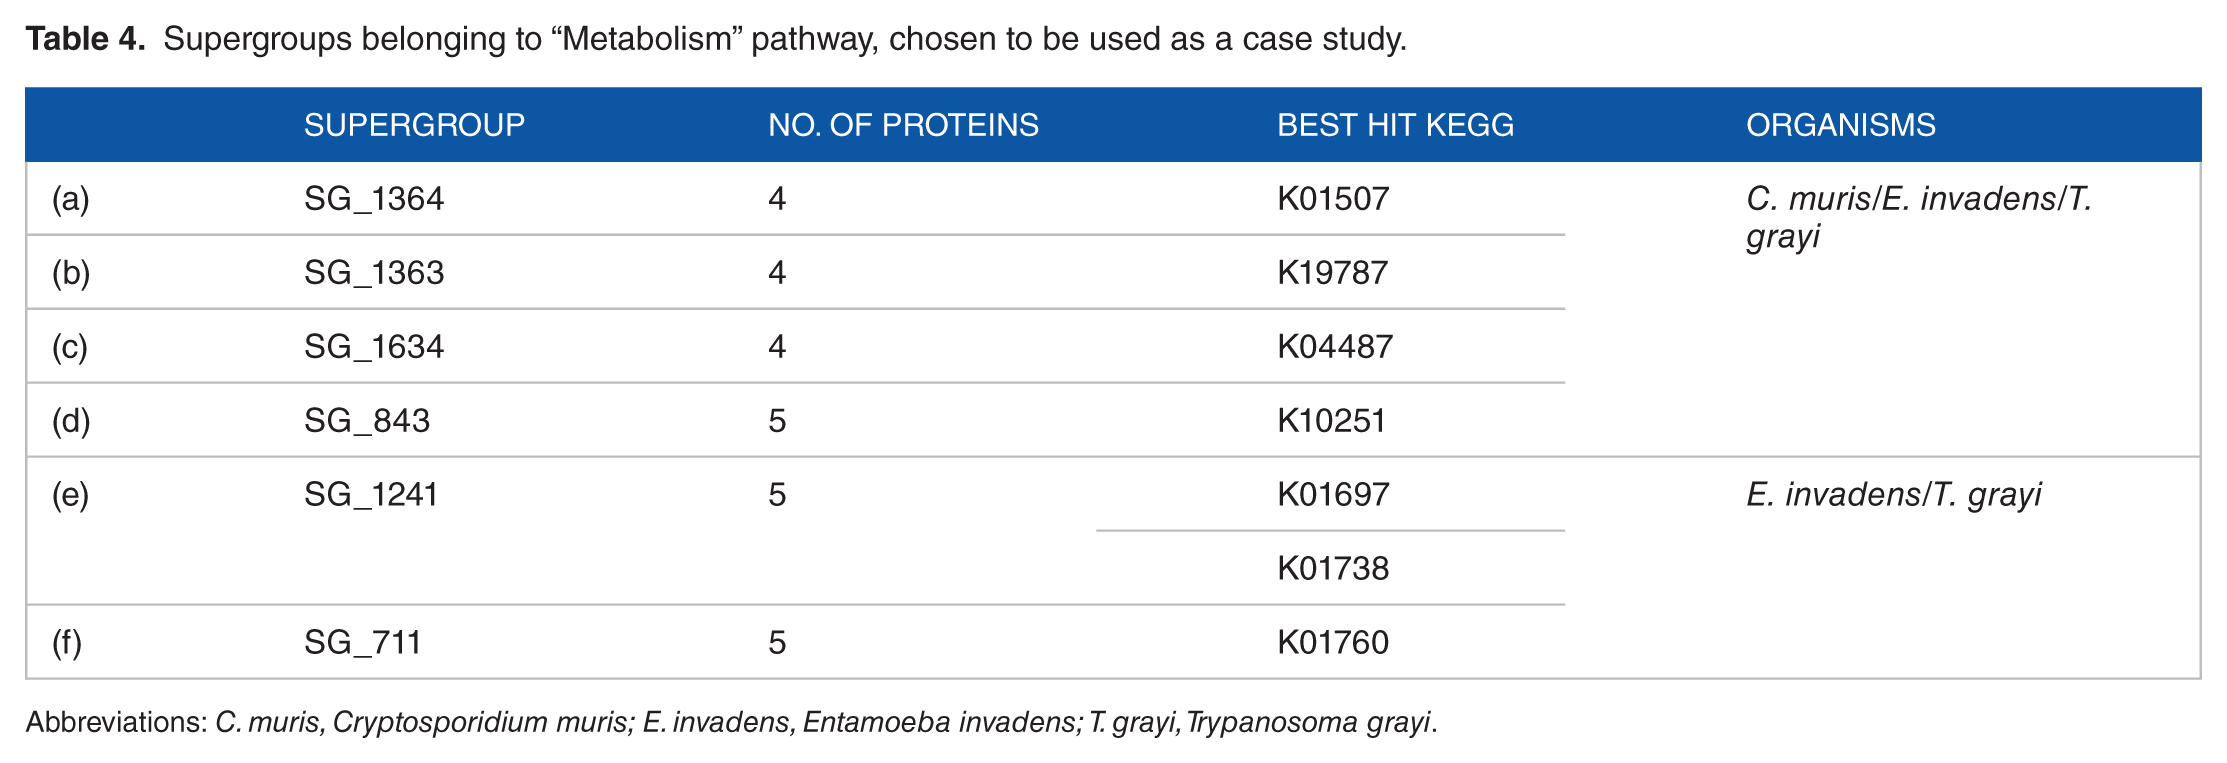
Abbreviations: C. muris, Cryptosporidium muris; E. invadens, Entamoeba invadens; T. grayi, Trypanosoma grayi.
Discussion
In this study, we developed an approach for homologous groups’ inference using reconciliation. For this purpose, the protein sequences of 3 protozoan genomes were used.
Identification of homologous groups
The homologous groups inferred in the 3 protozoa using OrthoMCL and OMA has shown that OrthoMCL had a larger number of proteins contributing to the homologous groups (56.06%) than OMA (10.72%) (Figure 3). Taking into account only the orthologous groups, OrthoMCL still had a larger number of proteins contributing to OrthoMCL: 21.36% versus OMA: 10.72%. These results disagree of a previous study found in literature that was performed by Dessimoz et al, 36 where OMA detected a larger number of orthologous proteins (66%) in comparison with OrthoMCL (47%). One of the causes for this could be the data set used by Dessimoz et al, with 150 genomes (prokaryotes and eukaryotes), whereas in our study, we use 3 protozoa genomes of different phyla and the OMA algorithm removes hits with a high evolutionary distance. 37
Because OMA infers only orthologous groups, and OrthoMCL also infers paralogous groups, a larger number of homologous groups are expected in OrthoMCL results when compared with OMA. However, even removing the OrthoMCL paralogous groups, the latter still inferred more orthologous groups: 1481 (OrthoMCL) versus 1231 (OMA). Taking as reference only the orthologous groups shared by the 3 organisms of this study, the OrthoMCL still inferred the largest number: 758 versus only 382 of OMA (Table 1).
Regarding proteins in paralogous groups inferred using OrthoMCL, our results showed that E. invadens contains most of them: 57.1% (6856/11 997), whereas T. grayi contains 19.2% (2034/10 583) and C. muris contains only 7.9% (309/3934) (Table 1). This large amount of paralogous proteins in E. invadens is in agreement with the literature, as referred by a previous study 7 and corroborates with the fact that E. invadens was the organism with the highest number of proteins in homologous groups in OrthoMCL inference. The lower number of paralogs in C. muris is also expected due to the small genome size (3934) of this parasite. 38 In addition, T. grayi showed the smaller percentage of homologs: 32.2% (3835/10 583). This can be partially explained by the fact that T. grayi presented in this study a low number of recognized paralogs compared with E. invadens and the impossibility of having many homologues with C. muris due to the small size of its genome.
OMA infers homologous groups based on evolutionary distance, 11 containing exclusively orthologs, and in this case, E. invadens and T. grayi had their number of orthologs among 3 species proportionally limited by the small amount of C. muris proteins.
Reconciliation algorithm—inference of Supergroups
The inference of the homologous Supergroups (Figure 1) was possible due to the different approach used by the 2 software (OrthoMCL and OMA), eg, their cutoff and the algorithms used to infer orthologs. On one hand, in its first steps, the OMA algorithm uses a alignment score >85 to exclude alignments that does not deem significant, which implies that small sequences stay out from its analysis 11 and, in addition, removes from the initial graph the best bidirectional hits with a high evolutionary distance. 39 On the other hand, OrthoMCL algorithm uses 1E−05 e-value cutoff as its default parameter and recognizes homologous groups by similarity score (best hits). 9 These fundamental differences between the 2 software could explain why some proteins are not included in the homologous inferred groups, and why it was possible to infer the Supergroups in this study, reconciling the homologous groups inferred by the OMA and OrthoMCL. Due to our validation criteria, the Supergroups inferred by our methodology have characteristics that make them homologous Supergroups as their proteins belong to the same protein family or share conserved domains. Evolutionarily conserved sequence fragments (or domains) are good indicators of homology because they can provide functional characterization based on the presence of signature sequence patterns and may serve as a starting point for functional annotation and classification. 14 The same can be said about protein families as they are a set of evolutionarily related sequences. 16
As conservation analysis have been used as a tool for homology inference in E. histolytica, 40 T. cruzi, 28 and Cryptosporidium hominis 41 species, we inferred multiple alignments for all Supergroups validated by conserved domain or protein family (59/59) (Additional file 4) aiming to understand better their level of conservation. Supergroups’ multiple alignments’ size ranged from 150 to 1311 amino acids presenting more than 34.51% of average identity, and 27.71% of average identity between the most distance sequences of each Supergroup. Considering the CDD and Pfam validation of Supergroups, the observed low-level sequence identity of proteins belonging to each Supergroup suggests that they may be considered distant homologues, which could not be inferred using OrthoMCL or OMA alone.
As far as we know, this is the first study to propose a reconciliation approach in homology inference. Our results showed that 78% of our homologous Supergroups that were validated by proteins families (Pfam-A) may be considered equivalent to Pfam Clans 19 which uses an approach based on both annotation and sequence similarity. 42 Our results also showed that more than 80% of our homologous Supergroups are equivalent to SUPERFAMILY 18 entries. In addition, our analysis showed that the Supergroups presented the greatest evolutionary distances among all the homologous groups inferred in this study, also supporting our hypothesis that our homologous Supergroups are distant homologues.
More in-depth analyses were conducted to deepen knowledge about their importance and biological functions in the 5 Supergroups chosen to be case studies:
Functional categorization, that is a very useful tool for comparative genomics because it has been extensively used in many species, such as L. amazonensis, 43 E. histolytica, P. falciparum, L. major, T. brucei, and T. cruzi. 40 In proteins of the Supergroups inferred in our study, the most common functional category found is “S” (function unknown); this designation is used for protein families that include at least 100 proteins from at least 2 different phyla, 44 which is indication that they are homologous with function not yet inferred. Besides that, highlighting protein homologs for which the biological functions remain unknown is vital to the progress of genome annotation. 45 These groups with unknown function may need more studies to define their functions, despite the fact that they formed homologous groups and are conserved, which may indicate that they have a relevant function for these organisms. Apart from the conserved domain and protein family analysis evidence, the fact that the proteins of 2 Supergroups listed in the results section (SG_1247 with “P” and “U” categories and SG_1633 with “J” and “O” categories) presented different functional categories also suggests that those 2 Supergroups might be distant homologues (Additional file 5).
KEGG pathway inference can be used as a reference for functional reconstruction and inference of biological functions from genomic sequences.
46
Our results showed that 6 Supergroups on this study participate in the KEGG “Metabolism” pathway Supergroups on this study participate in the KEGG “Metabolism” pathway (Table 4). (a) SG_1364 participates in the oxidative phosphorylation pathway with the inorganic pyrophosphatase enzyme (EC 3.6.1.1) that catalyzes the conversion of one molecule of pyrophosphate to 2 phosphate molecules. This enzyme, widely distributed among the bacteria, fungi, protozoa, and algae,
47
plays an essential role in lipid metabolism.
48
(b) SG_1363 participates in the histidine metabolism with the carnosine N-methyltransferase enzyme (EC 2.1.1.22). The identification of the gene that encodes carnosine N-methyltransferase may be beneficial for inference of the biological functions of anserine.
49
Anserine (β-alanyl-N-π-methyl-
Conclusions
The methodology developed by us was able to reconcile homology inference using homologous groups from OMA and OrthoMCL and then generating homologous Supergroups. These homologous Supergroups could not be inferred separately either using OMA or OrthoMCL. The validation of the homologous Supergroups using conserved domains (CDD) and protein families (Pfam-A), with high stringency criteria, have shown to be useful. In addition, the results presented may be underestimated, since proteins without protein family or conserved domains identified may be multi-domains that have not yet been annotated in CDD and Pfam databases. The homologous Supergroups inferred by us can be compared with SUPERFAMILY and Pfam Clan groups, all 3 representing distant homologous groups.
Our methodology can be used as support for the study of any species, regardless of which software for homology inference is used as input in the process. These encouraging results serve as a basis for future automation of this work, probably in the form of a pipeline or workflow.
Supplemental Material
Supplementary_Material – Supplemental material for Homology Inference Based on a Reconciliation Approach for the Comparative Genomics of Protozoa
Supplemental material, Supplementary_Material for Homology Inference Based on a Reconciliation Approach for the Comparative Genomics of Protozoa by Darueck A Campos, Elisa C Pereira, Rodrigo Jardim, Rafael RC Cuadrat, Juliana S Bernardes and Alberto MR Dávila in Evolutionary Bioinformatics
Footnotes
Acknowledgements
Thanks to Acre Federal Institute of Education, Science and Technology and the Oswaldo Cruz Institute for the opportunity to carry out this research. Thanks also to the Computational and Systems Biology Laboratory staff for useful suggestions and discussion.
Funding:
The author(s) disclosed receipt of the following financial support for the research, authorship, and/or publication of this article: This research was received financial support from the Federal Institute of Education, Science and Technology of Acre and the Oswaldo Cruz Institute, Fiocruz.
Declaration of conflicting interests:
The author(s) declared no potential conflicts of interest with respect to the research, authorship, and/or publication of this article.
Author Contributions
DAC and AMRD developed the methodology. DAC, RJ, and JSB responsible for data acquisition. DAC, ECP, AMRD, RJ, and RRCC contributed significantly to analysis and interpretation of data. DAC, ECP, AMRD, RJ, JSB, and RRCC wrote, reviewed and revised the manuscript. AMRD and RJ helped in administration, technical, or material support.
References
Supplementary Material
Please find the following supplemental material available below.
For Open Access articles published under a Creative Commons License, all supplemental material carries the same license as the article it is associated with.
For non-Open Access articles published, all supplemental material carries a non-exclusive license, and permission requests for re-use of supplemental material or any part of supplemental material shall be sent directly to the copyright owner as specified in the copyright notice associated with the article.