
Abstract
In this article, we propose a 3-dimensional graphical representation of protein sequences based on 10 physicochemical properties of 20 amino acids and the BLOSUM62 matrix. It contains evolutionary information and provides intuitive visualization. To further analyze the similarity of proteins, we extract a specific vector from the graphical representation curve. The vector is used to calculate the similarity distance between 2 protein sequences. To prove the effectiveness of our approach, we apply it to 3 real data sets. The results are consistent with the known evolution fact and show that our method is effective in phylogenetic analysis.
Introduction
With the number of available biological sequences developing rapidly, how to mine essential information from a huge amount of biological sequences effectively and reliably has become a critical problem. As a result, many methods in information extraction are proposed by researchers. Among them, the graphical representation of DNA sequences is an effective method for the virtualization and similarity analysis. Graphical representation is a kind of alignment-free method. It provides intuitive information of data by visualization of biological sequences. What is more, it is more generally applicable because its mathematical description of data facilitates numerical analysis without difficult calculations. Therefore, numerous works based on graphical representation have been presented by researchers.1–8 For example, Randić et al 1 proposed a graphical representation of RNA secondary structure based on twelve symbols. Bielińska-Waż et al 5 proposed a 2D-dynamic representation of DNA sequences in 2007. After that they proposed more dynamic representations of DNA sequences for generalization.6,7
However, the graphical representation of protein sequences is much more difficult because there are 20 amino acids instead of 4 nucleotides. Various approaches have been proposed by researchers only until recently.9–16 Among them, many approaches are based primarily on the physicochemical properties of amino acids. Randić 9 early proposed a 2-dimensional graphical representation of proteins based on a pair of physicochemical properties in 2007. After that, Yu et al 11 proposed a protein mapping method of protein sequences based on 10 physicochemical properties. Wang et al 10 presented a graphical representation of protein sequences based on 9 physicochemical properties. In the works by He et al 15 and Hu, 16 the physicochemical properties are also indispensable in information extraction from proteins because they have effects on the rate and pattern of protein evolution. From these, we can see that physicochemical properties are widely applied with graphical representation of protein sequences by these researchers and their results seem well.
In this article, we propose a 3-dimensional (3D) graphic representation of protein sequences based on 10 physicochemical properties17–21 of amino acids and the BLOSUM62 matrix. 22 The representation can provide good visualization without degeneracy or circuit. Then, we extract a specific vector from the graphical curve of a protein sequence. In addition, we proposed 2 applications based on the vector to analyze the similarity and evolutionary relationship of 3 data sets, respectively. The results are consistent with the evolution fact and works by other researchers. This shows our approach can be applied to hundreds of sequences with different lengths and perform well.
Methods
As we know, a protein sequence is usually composed of 20 kinds of amino acids. Every amino acid has its own particular physicochemical properties. Therefore, to mine essential information from a protein sequence, we propose an effective graphical method combining physicochemical properties of amino acids and the BLOSUM62 matrix.
BLOSUM62 matrix
BLOSUM62 matrix by Henikoff and Henikoff 22 is a substitution matrix applied to the alignment of protein sequences. The values of the BLOSUM62 matrix represent the probability that one amino acid is replaced by other amino acids. In their scoring scheme, a positive score represents a higher similarity between 2 amino acids and a negative score represents a lower similarity.
Physicochemical properties of amino acids
Here, we consider 10 primary physicochemical properties of amino acids, such as the pK1 (–COOH), 17 the pK2 (–NH3), 21 the polar requirement, 21 the isoelectric point, 18 the hydrogenation, 20 the hydroxythiolation, 20 the molecular volume, 19 the aromaticity, 20 the aliphaticity, 20 and the polarity values. 19 The 10 physicochemical properties of 20 amino acids are shown in Table 1.
Numerical values about 10 physicochemical properties of 20 amino acids.

Pro1, the pK1 (–COOH); pro2, the pK2 (–NH3); pro3, the polar requirement; pro4, the isoelectric point; pro5, the hydrogenation; pro6, the hydroxythiolation; pro7, the molecular volume; pro8, the aromaticity; pro9, the aliphaticity; and pro10, the polarity values.
The 3D graphical representation of protein sequences based on Blosum62 matrix and physicochemical properties of amino acids
For each physicochemical property, we will use K-means clustering method 23 to classify the 20 amino acids into several groups. K-means clustering is an efficient unsupervised clustering method which is widely used in a diverse range of fields such as data mining, bioinformatics, and natural language processing. 24 However, there are some weaknesses in K-means. K-means needs to be given the number of clusters beforehand. Silhouette 25 is a cluster validity index that can be used to determine the number of clusters. It considers 2 factors: cohesion and separation. Its value ranges from −1 to 1 and a higher value represents a better effect of clustering. According to this index, we can obtain a valid number of clusters of the given data set. In this way, we can obtain 10 kinds of clustering classification based on the 10 different properties, which are shown in Table 2.
Grouping information of 20 amino acids after clustering.

According to the property pK1 (–COOH), we can divide the 20 amino acids into 7 groups: G1 (A, G, I, L, M, W, V), G2 (H, F), G3 (Q, E, K, S, Y), G4 (T), G5 (N, P), G6 (C), and G7 (D). If 2 or more amino acids are divided into the same group, it denotes that they are similar to each other by the property pK1 (–COOH). Taking all the properties into consideration, we can obtain the number of similar properties between each pair of amino acids.
If

where
The similar degree of each pair of amino acids.

From Table 3, we can find that the similarity degree
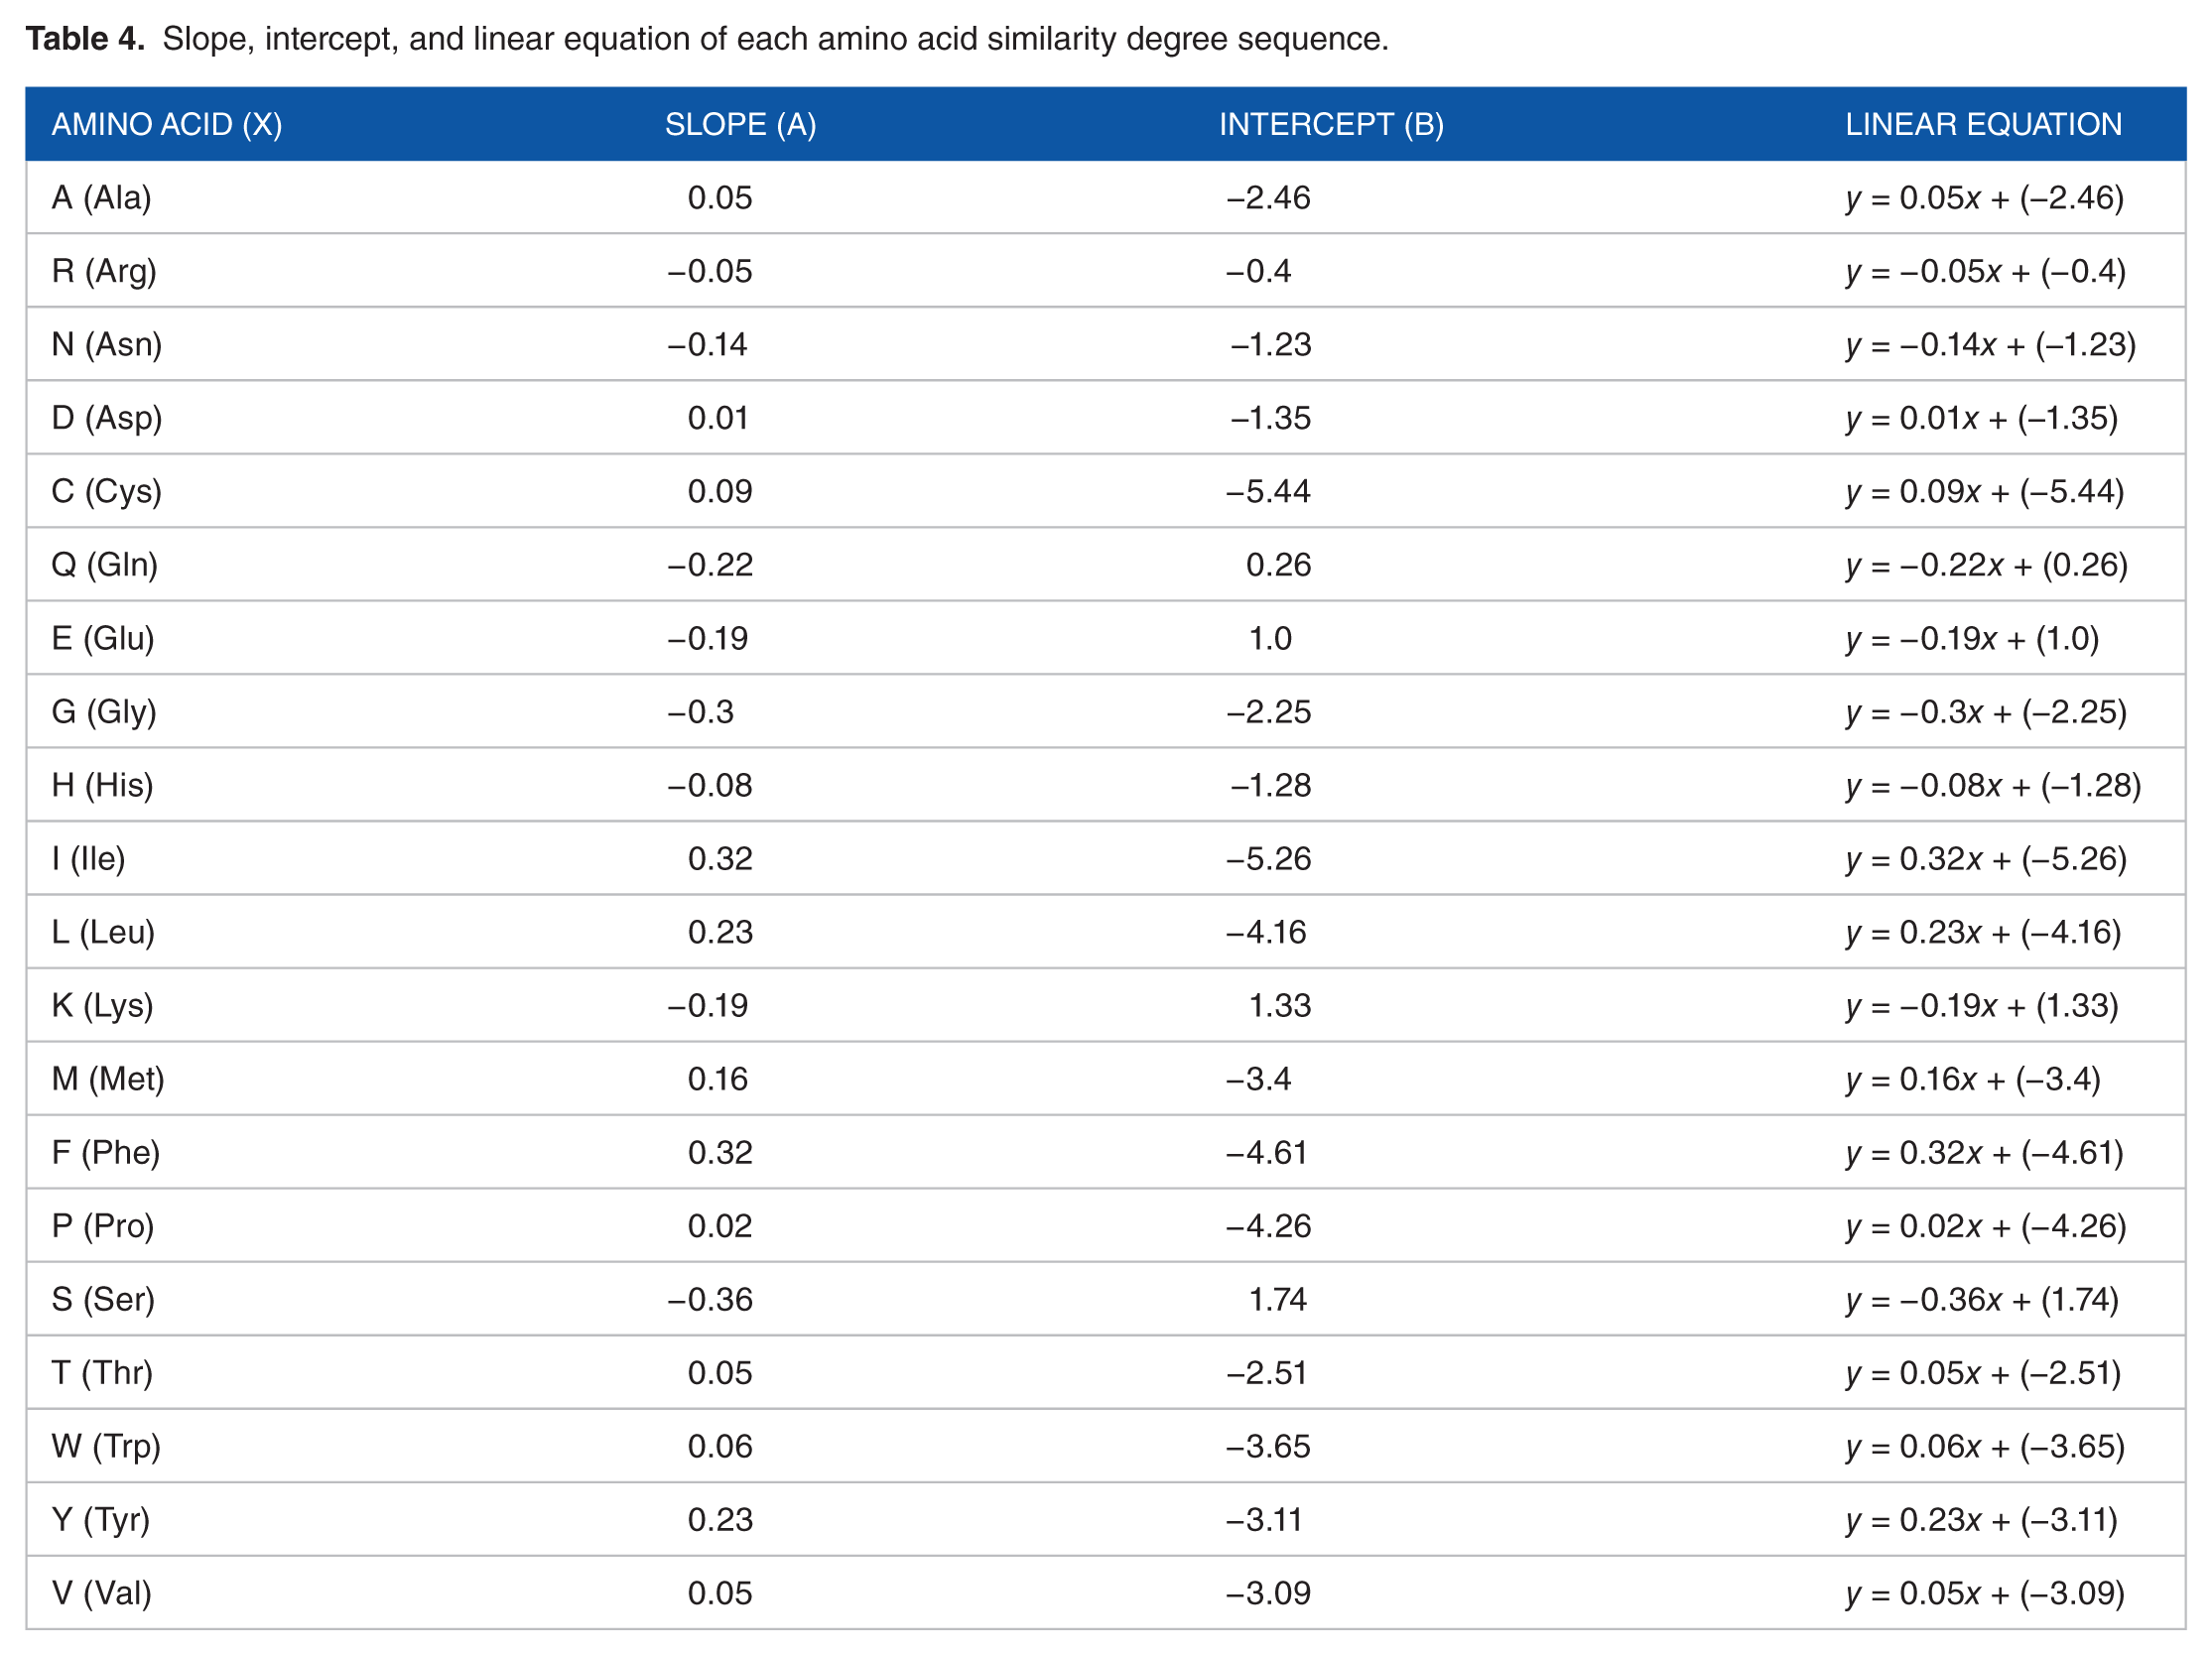
Slope, intercept, and linear equation of each amino acid similarity degree sequence.
We assume that

where
To demonstrate the effectiveness of the 3D graphical method, we take 2 protein sequences as an example. Both the sequences are taken from yeast Saccharomyces cerevisiae. 26 The graphical representations of 2 protein sequences are shown in Figure 1.

Graphical representation of the protein I and protein II by our method.
Protein I:
WTFESRNDPAKDPVILWLNGGPGCSSLTGL
Protein II:
WFFESRNDPANDPIILWLNGGPGCSSFTGL
As can be seen from Figure 1, the 2 curves are similar to each other. Furthermore, we can see that there are some differences between 2 figures in
Numerical Characterization and Similarity Analysis of Proteins
Based on the constructed graphical curve, we can get a specific vector from a protein sequence. Using this vector we can analyze the similarity between 2 protein sequences effectively.
40-dimensional characteristic vector
Characteristic vector is a common method to calculate the pairwise distance between 2 protein sequences. A good characteristic vector should avoid the problem about different lengths of sequences and complicated calculation.
Here, we define a 2-tuple

where
Taking a short segment of 10 amino acids, AARRARRNNN, as an example, the numbers of amino acid A, R, and N in the segment are 3, 4, and 3. Therefore, we can obtain the 40-dimensional characterizing vector (0.015, −0.738, −0.02, −0.16, −0.042, −0.369, 0, 0, . . ., 0, 0) according to Table 4 and equation (3).
Similarity analysis
The similarity/dissimilarity between 2 protein sequences can be represented by similar distance. There are several calculating methods for measurement of similar distance such as Euclidean distance, City Block distance, and Manhattan distance. Here, we use Euclidean distance as a measure to represent the similarity/dissimilarity between 2 sequences. We will compute the similarity distance using the 40-dimensional characteristic vector. If the two 40-dimensional characteristic vectors are denoted as

their Euclidean distance is calculated as follows:

The smaller the distance
Applications and Discussion
Similarity analysis of 9 ND5 proteins and 29 spike proteins
To show the effectiveness of the proposed similarity analysis method, we apply it to 9 ND5 protein sequences (provided as Supplementary File 1): human, common chimpanzee, pygmy chimpanzee, gorilla, fin whale, blue whale, rat, mouse, and opossum (their accession number in NCBI [National Center for Biotechnology Information] are AP_000649, NP_008196, NP_008209, NP_008222, NP_006899, NP_007066, AP_004902, NP_904338, and NP_007105, respectively). According to the method given in section “Similarity analysis,” we can obtain the similarity distance matrix of these protein sequences. The corresponding result is shown in Table 5.
The similarity matrix for the 9 ND5 protein sequences.

On the basis of Table 5, we can find that the distance between fin whale and blue whale is the smallest. This indicates that they have a high degree of similarity. The distance between human, common chimpanzee, pygmy chimpanzee, and gorilla is relatively small, which means that they are similar to each other. Besides, opossum is quite dissimilar to other species because the similarity distances between opossum and other species are large. All these results are consistent with the evolution theory and the recent studies.14–16 That is to say the proposed method can analyze the similarities of proteins effectively.
To further demonstrate the effectiveness of our method, we apply it to another data set which is widely used in many works.10,27 This data set consists of 29 spike protein sequences of coronavirus (provided as Supplementary File 2). The basic information of the protein sequences is shown in Table 6. We construct the phylogenetic tree for the 29 spike protein sequences based on our method using UPMGA method in Figure 2. From Figure 2, we can see that all the sequences are mainly classified into 4 groups by our method. This is consistent with the works10,27 and the known biology fact that coronavirus are always classified into 4 groups: the group I (contains PEDV, TGEV), the group II (contains BCoV, MHV, RtCoV), the group III (contains IBV, TCoV), and the SARS-CoVs (severe acute respiratory syndrome coronavirus).
The information of 29 spike protein sequences.


The phylogenetic tree of the 29 spike proteins of coronavirus using our method.
Similarity analysis of 560 gene sequences of influenza A (H1N1) virus
In this section, we give an application for the similarity analysis of HA gene sequences of influenza A (H1N1) from March 1, 2009 to April 30, 2009 (available online at https://www.ncbi.nlm.nih.gov). We obtain a data set that consists of 560 gene sequences with full length (provided as Supplementary File 3). To further demonstrate the validity of our method, we apply the method to this data set.
According to our method, for each virus isolate, we can get a corresponding 20-dimensional vector. Thus, we can obtain a vector set of 560 vectors. By computing the similarity distance between pairs of these vectors, we can obtain a similarity distance matrix. Next, we construct the phylogenetic tree based on our method in Figure 3. To analyze the results better, we mark 2 typical strains: A/California/07/2009 (H1N1) and A/Indiana/08/2009 (H1N1). From Figure 3, it is easy to identify that all virus isolates are mainly classified into 2 groups. This illustrates that there are 2 different kinds of influenza A (H1N1) virus isolates from March 1, 2009 to April 30, 2009. This result is consistent with the works by Qi et al.14,28 Furthermore, the result is also consistent with the biology fact that a new influenza virus, A/California/07/2009 (H1N1)–like virus, appeared and showed a strong ability to infect human beings in April 2009. 23 The branch length in Figure 3 is the similarity distance between 2 virus isolates.
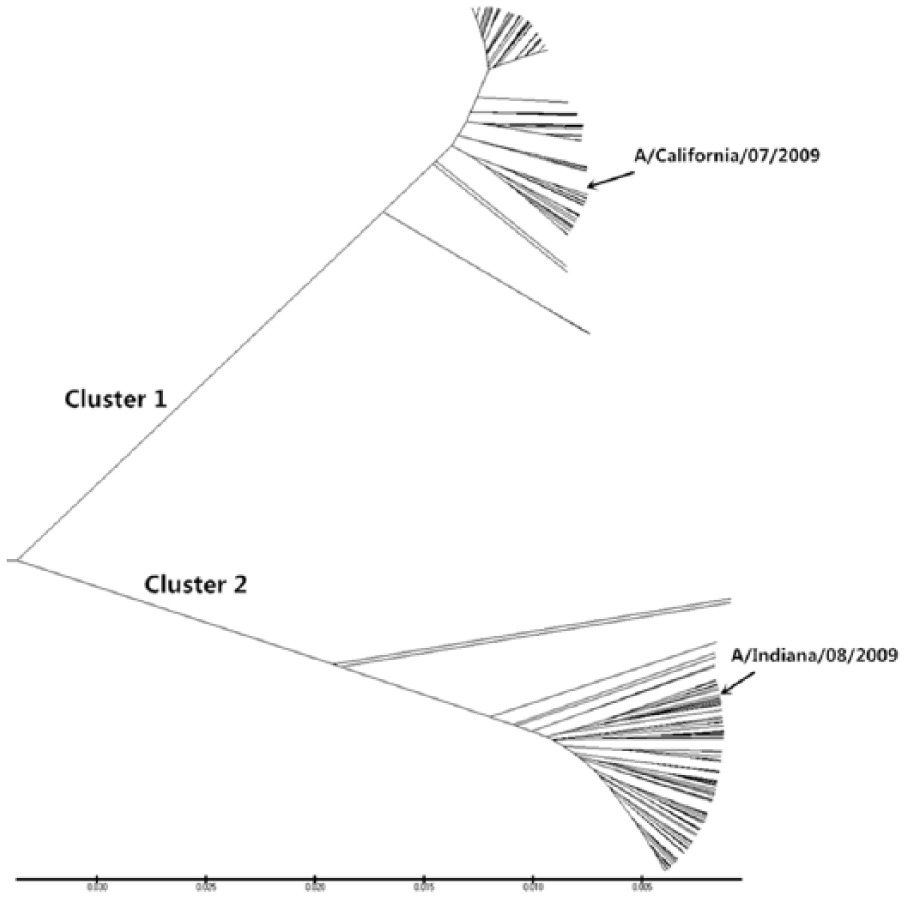
The phylogenetic tree of the 560 influenza A (H1N1) isolates from March to April 2009 by our method.
ClustalW is one of the most widely used multiple sequence alignment method for nucleic acid and protein sequence in molecular biology. We construct the phylogenetic tree of the 560 gene sequences using ClustalW method 29 under MEGA6.0 software for comparison. From the phylogenetic tree in Figure 4, we can see that all virus isolates are also classified into 2 groups. In the figure, we also mark 2 typical strains: A/California/07/2009 (H1N1) and A/Indiana/08/2009 (H1N1). Observing Figures 3 and 4, one can easily find out that the results by our method are consistent with those by ClustalW method. Furthermore, it takes about 126 minutes to obtain the multiple sequence alignment result on our Intel Core i5-3230M CPU @ 2.60 GHz 2.60 GHz Windows PC with 4 GB RAM. However, the computation time of our method is 105.769 seconds by a Python program. It can indicate that our method is a computational efficiency method when dealing with sequences with different lengths.

The phylogenetic tree of the 560 influenza A (H1N1) isolates from March to April 2009 using ClustalW method under MEGA6.0 software.
Conclusions
In this article, a new 3D graphical representation of protein sequences is introduced based on 10 physicochemical properties and BLOSUM62 matrix. On the basis of the graphical representation curve, we extract a specific vector and use the vector to calculate the similarity distance between 2 protein sequences. To prove the effectiveness of our method, we apply our method to 3 real data sets. The results show the validity of our method in phylogenetic analysis compared with related works and evolution facts.
Supplemental Material
uomf_march_22_2018_supplementary_file_1 – Supplemental material for Novel Method of 3-Dimensional Graphical Representation for Proteins and Its Application
Supplemental material, uomf_march_22_2018_supplementary_file_1 for Novel Method of 3-Dimensional Graphical Representation for Proteins and Its Application by Zhao-Hui Qi, Ke-Cheng Li, Jin-Long Ma, Yu-Hua Yao and Ling-Yun Liu in Evolutionary Bioinformatics
Supplemental Material
uomf_march_22_2018_supplementary_file_2 – Supplemental material for Novel Method of 3-Dimensional Graphical Representation for Proteins and Its Application
Supplemental material, uomf_march_22_2018_supplementary_file_2 for Novel Method of 3-Dimensional Graphical Representation for Proteins and Its Application by Zhao-Hui Qi, Ke-Cheng Li, Jin-Long Ma, Yu-Hua Yao and Ling-Yun Liu in Evolutionary Bioinformatics
Supplemental Material
uomf_march_22_2018_supplementary_file_3 – Supplemental material for Novel Method of 3-Dimensional Graphical Representation for Proteins and Its Application
Supplemental material, uomf_march_22_2018_supplementary_file_3 for Novel Method of 3-Dimensional Graphical Representation for Proteins and Its Application by Zhao-Hui Qi, Ke-Cheng Li, Jin-Long Ma, Yu-Hua Yao and Ling-Yun Liu in Evolutionary Bioinformatics
Footnotes
Acknowledgements
This paper has not been submitted elsewhere for consideration of publication.
Author Contributions
Z-HQ conceived and designed the work that led to the submission. K-CL contributed significantly to analysis and manuscript preparation. J-LM and Y-HY helped to perform the analysis with constructive discussions. All the authors reviewed and approved the final manuscript.
Funding:
The author(s) disclosed receipt of the following financial support for the research, authorship, and/or publication of this article: This work is supported by the Hebei Province Natural Science Fund for Distinguished Young Scientists (no. F2016210065), and the National Natural Science Foundation of China (61272254, 61762035), and research grants (LY18F020027) from the Zhejiang Provincial Natural Science Foundation of China.
Declaration of conflicting interests:
The author(s) declared no potential conflicts of interest with respect to the research, authorship, and/or publication of this article.
References
Supplementary Material
Please find the following supplemental material available below.
For Open Access articles published under a Creative Commons License, all supplemental material carries the same license as the article it is associated with.
For non-Open Access articles published, all supplemental material carries a non-exclusive license, and permission requests for re-use of supplemental material or any part of supplemental material shall be sent directly to the copyright owner as specified in the copyright notice associated with the article.