
Abstract
DNA barcode sequences are accumulating in large data sets. A barcode is generally a sequence larger than 1000 base pairs and generates a computational burden. Although the DNA barcode was originally envisioned as straightforward species tags, the identification usage of barcode sequences is rarely emphasized currently. Single-nucleotide polymorphism (SNP) association studies provide us an idea that the SNPs may be the ideal target of feature selection to discriminate between different species. We hypothesize that SNP-based barcodes may be more effective than the full length of DNA barcode sequences for species discrimination. To address this issue, we tested a ribulose diphosphate carboxylase (rbcL) SNP barcoding (RSB) strategy using a decision tree algorithm. After alignment and trimming, 31 SNPs were discovered in the rbcL sequences from 38 Brassicaceae plant species. In the decision tree construction, these SNPs were computed to set up the decision rule to assign the sequences into 2 groups level by level. After algorithm processing, 37 nodes and 31 loci were required for discriminating 38 species. Finally, the sequence tags consisting of 31 rbcL SNP barcodes were identified for discriminating 38 Brassicaceae species based on the decision tree–selected SNP pattern using RSB method. Taken together, this study provides the rational that the SNP aspect of DNA barcode for rbcL gene is a useful and effective sequence for tagging 38 Brassicaceae species.
Introduction
DNA barcoding techniques became popular because the primer sets for the DNA barcode sequencing are convenient to reach. 1 Current works of barcoding are based on the data accumulation for DNA barcode sequences. However, the original idea of “DNA barcoding” was to use an as short as possible DNA sequence to identify a species as reliable as possible. Such molecular species-specific marker was proposed first by Paul Hebert in 2003 for animals. 2
As yet, the intention of a short identification character is not realized. This is mainly due to the barcode sequence taking an intact gene with all its same and uninformative sequence parts. This is commonly long and the species number too large to make computational discriminations straightforward. This also holds for the chloroplast-encoded ribulose diphosphate carboxylase (rbcL) gene.3,4 This is commonly used for DNA barcoding in plants.5–8 Its DNA sequence ranges from 1086 to 1410 bp (base pairs). Hence, it is necessary to reduce the computation time for rbcL barcoding for tagging species. Detailed inspection revealed that most of the nucleotides of different species were the same in the rbcL gene. This evidence inspired us to focus just on the nucleotides which were variable on single-nucleotide polymorphisms (SNPs).9–14 Accordingly, we proposed a hypothesis that the number of SNPs is smaller than the nucleotide numbers for full-length barcoding sequences. The complexity of data was reduced when SNPs within the full-length barcode sequences were used.
Recently, the concept of SNP barcoding was widely reported with respect to different diseases15,16 and species identifications.17–19 For example, the nucleotide signatures consisting of 27 and 37 SNPs of the internal transcribed spacer 2 (ITS2) sequences were used to identify medicinal herbs such as Panax quinquefolius (American ginseng) products 20 and Angelicae sinensis radix (Danggui). 17 To add another example, 42 SNPs from different chromosomes of the malaria causing protist Plasmodium vivax genome were reported to accurately identify P vivax infections. 18 A total of 62 SNPs were identified to discriminate between known strains of the tuberculosis-causing prokaryote Mycobacterium tuberculosis. 19 Although SNP barcoding is helpful for species identification in these studies,17–20 these SNPs were collected together without further shortening the SNP number for essential species identification by computation.
The Brassicaceae family (syn. Cruciferae, mustard or crucifer plants) contains the most common species of the order Brassicales (about 3700 species). 21 Brassicaceae have 4 petals (cross-shaped) and 6 stamina which are distinguished morphologically from other families. The Brassicaceae provide the prominent angiosperm model species, especially Arabidopsis thaliana for plant molecular studies. 21 The Brassicaceae were also used for genetic studies in several fields of plant research and the number of species continuously increased.21,22 Accordingly, it is suitable to choose several Brassicaceae species for species tagging study.
In this study, we proposed an rbcL SNP barcoding (RSB) strategy using a decision tree algorithm8,23–26 for species identification. We used the example of 38 Brassicaceae species for this particular study. We generated an rbcL barcode with 31 SNPs that allowed us to discriminate between 38 species using the RSB method for the first time.
Materials and Methods
Data resources
In total, 38 rbcL sequences of Brassicaceae plants were downloaded from GenBank (Table 1). 27
A total of 38 rbcL sequences of the plant family Brassicaceae from GenBank.

Abbreviation: bp, base pair.
The position is listed in the reference of its own accession number.
The reference sequence for single-nucleotide polymorphism barcoding and position.
RSB approach
In this article, we proposed an RSB method to apply the decision tree model to classify 38 Brassicaceae species using rbcL barcodes that were retrieved from GenBank. The flowchart of the RSB approach is described as follows (Figure 1): Step 1—data processing, step 2—decision tree construction, and step 3—barcode creation. The detailed procedures are explained in the following sections.

Flowchart of rbcL SNP barcoding. Three steps are processed to perform the DTSB method: Step 1—data processing, step 2—decision tree construction, and step 3—barcode creation. For step 1, 7 rbcL sequences from different species (S1-S7) were retrieved from GenBank. After alignment, the protruding sequences were trimmed to generate the same length for pretested rbcL sequences. For step 2, the aligned sequences were fed for decision tree processing, such as creation of a node root of tree, decision rule creating, and separation rule for sparing into 2 categories (left leaf [LL] node and right leaf [RL] node). For step 3, the tree was constructed and the SNP barcodes of rbcL gene for species tagging were generated. Here, hypothesized sequences and SNP barcodes provide an example for species tags. SNP indicates single-nucleotide polymorphism.
Step 1—Data processing
In total, 38 rbcL sequences from different Brassicaceae plants were retrieved from GenBank and aligned with ClustalW built in MEGA 7. 28 Subsequently, the 5′ and 3′ protruding sequences were trimmed to the same length for further analysis.
Step 2—Decision tree construction
A similar strategy of nucleotide selection and rule making was outlined before.29,30 Support data

When nucleotides (A, C, G, and T) are included in matrix

where the frequency f of nucleotides in each position is described as follows (formula (3)):

In the decision tree, rules are decided to subgroup species into 2 sides (LL [left leaf] and RL [right leaf] in Figure 1) depending on the score


where midp represented half of the number of the data set in the each node; diffp is the minimum value of |midp − fip|; and weightp is set as 0, 0.33, 0.66, and 1 if the number of appeared nucleotide type is 1, 3, 4, and 2, respectively. When the number of nucleotide types is 2, we set the weight as the highest value, ie, 1, to separate these data into 2 sides for even distribution. Accordingly, species can subgroup at 2 sides based on each scorep. Theoretically, any loci with the same score may be able to perform decision tree construction. However, we choose the first appearing nucleotide starring from the beginning in aligned sequences for convenience. The reason for scoring nucleotide in each locus is to divide multiple species sequences into 2 groups correctly for decision tree construction. For different levels, the nodes are subgrouped in the same way and finally the decision tree is constructed. To further explain the calculation processing of midp, diffp, weightp, scorep, and decision tree construction, an example is provided in Supplementary file S1.
Step 3—Barcode creation
The barcode-generator Web site tool (http://www.barcode-generator.org/) was chosen to create barcode images according to the SNP barcode sequence of the rbcL gene. In general, species-specific SNP barcodes forming step 2 were copied and pasted to the window of the barcode-generator Web site with the setting of Code 128 (standard). After clicking “create barcode,” the species-specific SNP barcodes were visualized as strip barcodes.
Results
Step 1—Data processing
Step 1.1. Retrieval of sample rbcL sequences: 38 rbcL sequences of different Brassicaceae plants (Table 1) are downloaded and available at http://140.127.112.213/Brassicaceae.zip.
Step 1.2. Sequence alignment. Using MEGA 7, 28 38 rbcL sequences were aligned and mostly matched with 5′ and 3′ protruding sequences because they were not of the same length. The alignment status for these aligned sequences is available at http://140.127.112.213/Brassicaceae.zip.
Step 1.3. Sequence trimming. To get the same length of rbcL sequences for further computational processing, the 5′ and 3′ terminals with protruding sequences were trimmed. The resulting trimmed rbcL sequences are available at http://140.127.112.213/Brassicaceae.zip. This trimmed rbcL sequence was the same as the sequence from accession no. HE616652.1 (Table 1) and it was regarded as the reference sequence for SNP positioning for the next step. The ranges of this trimmed rbcL sequence were listed on the right side of Table 1 for each species.
Step 2—Decision tree construction
Based on our proposed decision rules, the nucleotide distribution (D) and scorep were calculated. Subsequently, the nucleotide with a maximum scorep was identified for subgroup. Among 38 Brassicaceae species, the decision tree was constructed as shown in Figure 2.

Decision tree making of 38 aligned rbcL sequences. The number within each circle is the nucleotide position of the trimmed alignment sequence of rbcL. The decision making starts from top to down sequentially level by level. In each level, the letters (nucleotides) in the left and right sides indicate the left leaf (LL) and right leaf (RL) nodes as shown in Figure 1. After collecting the nucleotides from top to down levels, the SNP barcode of rbcL can present the tag sequence for different species as shown in Figures 3 and 4. SNP indicates single-nucleotide polymorphism.
For example, Castanea mollissima (the left species in Figure 2) required only 6 nodes (837, 702, 941, 389, 9, and 11; yellow background in Figure 3) for the species-specific SNP tag sequences. The others follow the same rule. As different species may need different nodes, we collected all loci and assigned them for the SNP barcode for species discrimination. Finally, 37 nodes and 31 loci were required for discriminating 38 species because some of these loci appeared repeatedly (Figure 3). Finally, the sequence tags for the 38 example species were identified based on the decision tree–selected SNP pattern.
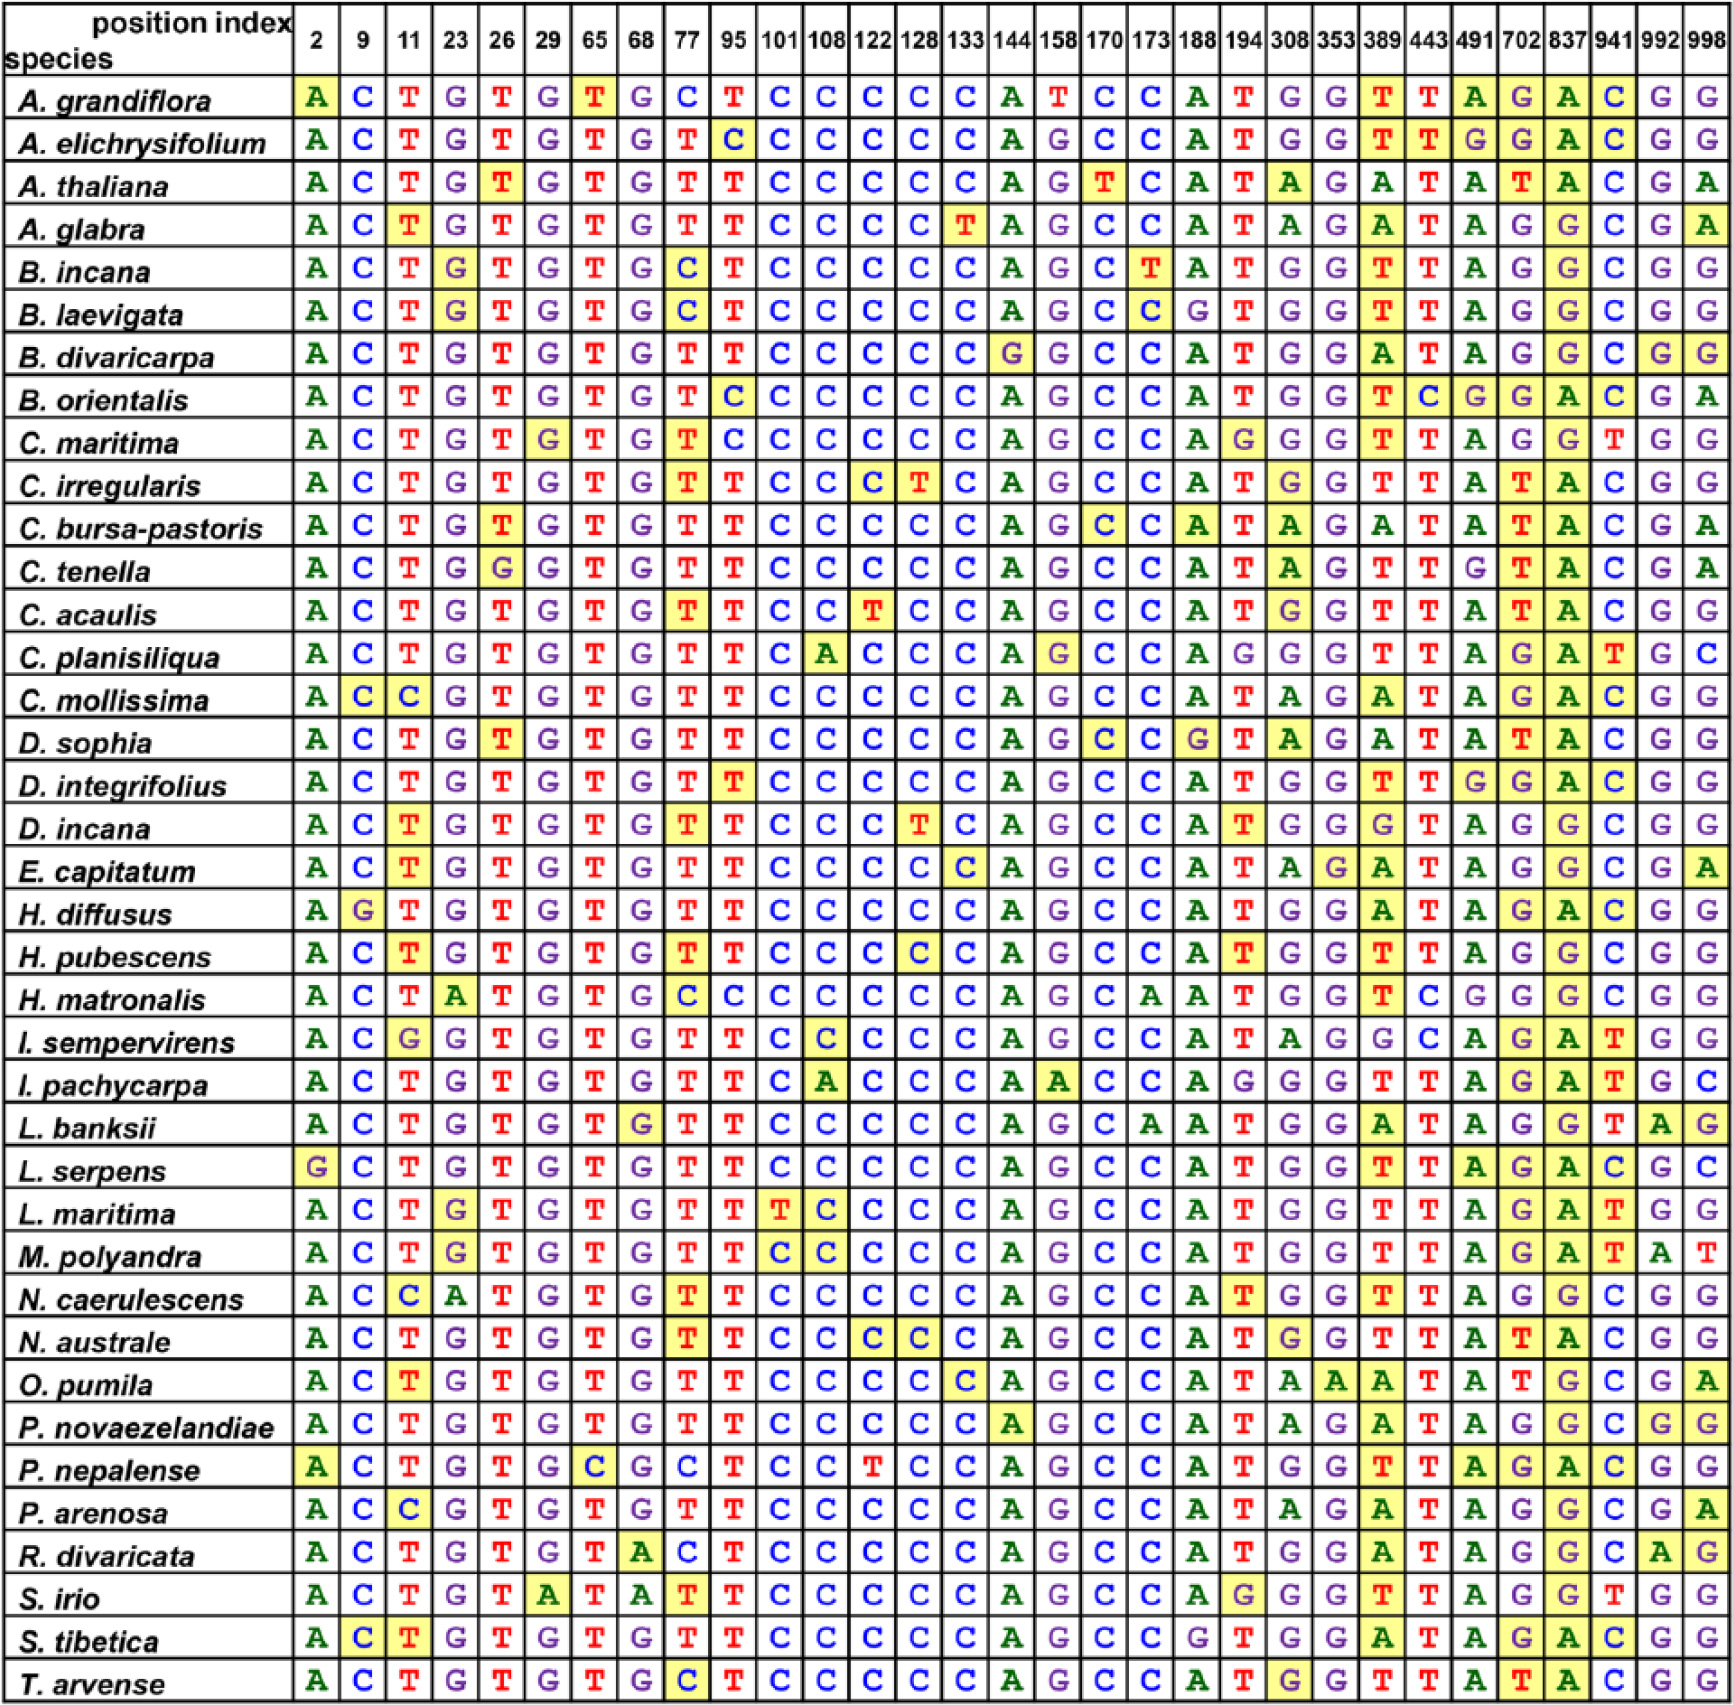
Sorting of SNP barcode of rbcL sequences from 38 Brassicaceae species. The nucleotides chosen for a decision tree construction depend on the rule of decision tree rather than the order of nucleotide position. Only after sorting, the nucleotides appear in the order of position. Yellow background indicates the minimal SNPs for generating species-specific SNP patterns. The position index is based on the trimmed rbcL sequence which is the same as the sequence from accession no. HE616652.1 (Table 1). SNP indicates single-nucleotide polymorphism.
Step 3—Barcode creation
Species-specific rbcL SNPs generated from the decision tree algorithm originally appeared from top to down. After sorting, the nodes were listed from small to big numbers as shown in Figure 3. Subsequently, 38 species-specific rbcL SNP barcodes were demonstrated in a 1-dimensional barcode pattern (Figure 4).

The SNP barcodes for 38 species of Brassicaceae are sorted and the SNP barcode (see Figure 3) is converted to a barcode pattern. SNP indicates single-nucleotide polymorphism.
Discussion
The original idea of “barcode” is designed to make a tag to identify species. However, most barcoding approaches commonly use whole gene sequences of nucleotides with long stretches of uninformative sequence portions but not more targeted characteristics. Here, we developed an RSB method to use the variable parts of otherwise much longer and uninformative rbcL barcode for discriminating 38 species belonging to the plant family Brassicaceae. Based on rbcL sequences, we developed the RSB to generate the shortest possible DNA barcode with sufficient discriminative power to identify species.
After sequence alignment, the SNP barcode sequences were easily obtained from the decision tree algorithm. In a decision tree model, each sample (species) was separated from root to node or node to node.31,32 Each root and node needs 1 SNP. If the selected SNPs are not repetitive, the theoretical maximum number of SNPs required to distinguish between each other is N − 1. When the number of chosen SNPs is higher than the number of species, then sufficient species-specific SNP barcodes are available in our proposed RSB method. In the other words, there are 4 possible DNA nucleotides (ie, A, T, C, and G) in each position, it means a permutation of M base pair of DNA sequence had number of 4M combinations which is minimum number of SNP difference in the barcodes. In our data, the combination can calculate as 4M > N, ie, 43 = 64 > 38. Consequently, it just needs 3-bp sequence in this case. Accordingly, our proposed RSB is tolerant for many species discrimination theoretically.
In our study, the lengths of these sequences ranged from 1086 to 1410 bp from 38 species. After alignment and trimming to the same length for 1054 bp, 155 nucleotides (SNPs) are found. Over a billion of permutation possibilities for SNP combinational patterns can be calculated following the mathematics of combination formula for 155 SNPs. In total, 31 SNPs in 38 species samples were chosen in this study (Figure 4). However, these SNPs may not always conserve. Alternatively, we can use the remaining SNPs, ie, 155 − 31 = 124, which is allowed to process another computation for the 38 species. Once the SNP frequency changes with variation, the score for each nucleotide is changed accordingly. Finally, other suitable SNPs are able to collect after new computation and generate new SNP barcodes for species tagging. Therefore, our proposed method is tolerated to spontaneous mutations for test species sequences. Among these 38 Brassicaceae species, some are genetically similar and some are distinct in terms of the result of phylogenetic trees constructed by neighbor joining method (Supplementary file S2). 33 Therefore, our proposed RSB approach will be able to discriminate distinct species efficiently by an rbcL SNP barcode.
A limitation of RSB is that it can only discriminate species with known sequence data but cannot identify species without sequence background. The universality of SNP barcodes developed by RSB performs well to different species with known rbcL sequences. As far as Brassicaceae species are concerned, the decision tree algorithm–generated SNP barcodes of rbcL genes are species specific. However, it needs a reanalysis to generate new SNP barcodes when more species are added. This is a supermarket-like idea that our proposed method only aimed to provide the specific SNP tags (strip barcode) for different species (goods) among the known species (all products in a supermarket). Once new species are added, more SNP numbers are required and the species-specific SNP barcodes need to be regenerated by computation. It was warranted to construct the database for certain interesting species groups in the future. The present contribution suggests that longer traditional barcode sequences could be narrowed down to smaller SNP barcodes for tagging species and reducing the overall nucleotide number for computation. However, the reference sequence used as the standard for trimming sequence ends rather than the whole sequence data, limiting its availability of evolutionary significance using our proposed method. It warrants further investigation for developing algorithm-based SNP patterns for long whole sequence data in evolutionary studies.
In general, the classification model must be inferred from a larger set of sequences. Many machine learning–based approaches were developed for DNA barcoding classification, such as DNA-Bar, 34 BLOG, 35 VIP Barcoding, 36 LAF, 29 and logic mining technique. 37 For example, DNA-Bar provides selecting DNA distinguishers (specific nucleotides) from genomic sequences to identify different microorganisms. 34 It finds a near-minimum number of distinguishers and gives specific pattern for each microorganism by a greedy distinguisher selection strategy. Although the DNA distinguishers represent a list of 10 nucleotide patterns, these nucleotides were extracted from genomic sequences rather than from the same gene region as shown in our study with the rbcL gene. Because the combinational nucleotides (DNA barcodes) identified in our study is derived from the same gene, these DNA barcodes belong to the SNP barcodes. BLOG 2.0 provides the character-based species classification for DNA barcoding by data mining. 35 VIP Barcoding provides a composition vector–based method for fast species classification. 36 LAF combined alignment-free techniques and rule-based classification algorithms for bacterial genome classification. 29 In general, most of these classification model studies solve the problem of allocating an unidentified species to a known species based on its DNA barcode. 26
Although the rbcL gene represents a suitable nucleotide sequence for distinguishing different plant species, the longer traditional barcode sequences should be narrowed down to small number of SNP barcode for the ease of tagging species and reducing the amount of information for computation. Only one set of SNP barcodes is sufficient for the reliable tagging of a species. Therefore, the model establishment is not necessary in our study. For this purpose, we use the decision tree idea to identify the specific pattern of SNP barcodes for tagging a species. In detail, we use the concept of decision tree that creates decision rules (IF-THEN-ELSE) to find the best DNA sequence to dichotomize in each node. Our proposed method uses nucleotides to distinguish all species through tree traversal. The result of node traversal is summarized to generate SNP barcode and finally produces the strip barcode for tagging a species. It is different from a general decision tree in machine learning that needs to separate existing data into training sets and testing sets.26,37,38 Therefore, it is not necessary in our study to use a training set to build the classification model and then use a testing set to verify the performance.
An important perspective of this work is further development of software that could automate our proposed algorithms for tagging species. A brief version of the “SNP barcodes for species tagging” software is available at the Web site http://203.64.88.159/barcoding/. It provides 6 items for demonstration, such as introduction, download, usage (user manual), data set (3 family), demo (YouTube video for operating 3 sample data sets), and author information. The developed species-specific SNP barcodes are readable by the barcode reader (scanner) or smartphone apps (such as QuickMark QR Code); you can download iOS (https://itunes.apple.com/us/app/qr-code-reader-quickmark-barcode/id384883554?mt=8) or Android (https://play.google.com/store/apps/details?id=tw.com.quickmark) using cell phone. In this way, the species-specific SNP barcodes are readable and distinguishable from each other. In the future, more species can be included to provide unique SNP barcodes for Brassicaceae plants and other organisms in principle.
Conclusions
The full length of the rbcL gene is commonly used for taxonomic identification of spermatophyte plants. Because most of the nucleotides do not vary and are not informative for species identification and authentication, we developed an RSB method, which combines the sequence alignment with a decision tree algorithm to generate the shortest barcode with 31 rbcL SNPs for discriminating of 38 Brassicaceae species as an example. As the rbcL gene barcode sequence is shortened from the full length (~1086 to 1410 bp) to 31 SNPs, the computational time is dramatically reduced. Therefore, the RSB-aided rbcL SNP barcode proposed here provides an effective way of species identification for plants.
Footnotes
Acknowledgements
The authors thank Dr Hans-Uwe Dahms for the English editing.
Funding:
The author(s) disclosed receipt of the following financial support for the research, authorship, and/or publication of this article: This work was supported by funds of the Ministry of Science and Technology, Taiwan (MOST 105-2221-E-151-053-MY2 and MOST 104-2320-B-037-013-MY3) and the National Sun Yat-sen University-KMU Joint Research Project (#NSYSU-KMU 107-p001).
Declaration of Conflicting Interests:
The author(s) declared no potential conflicts of interest with respect to the research, authorship, and/or publication of this article.
Author Contributions
L-YC and H-WC conceived and designed the research and wrote the paper. C-HY instructed K-CW for algorithm processing. K-CW also contributed to sequence retrieval. C-HY and H-WC revised the paper. All authors read and approved the final manuscript.
Supplementary Materials
Supplementary file S1: Example of strategy of decision tree construction in rbcL aligned sequences. Supplementary file S2: Phylogenetic trees of 38 Brassicaceae species.
References
Supplementary Material
Please find the following supplemental material available below.
For Open Access articles published under a Creative Commons License, all supplemental material carries the same license as the article it is associated with.
For non-Open Access articles published, all supplemental material carries a non-exclusive license, and permission requests for re-use of supplemental material or any part of supplemental material shall be sent directly to the copyright owner as specified in the copyright notice associated with the article.