
Abstract
We introduce software, Numericware i, to compute identical by state (IBS) matrix based on genotypic data. Calculating an IBS matrix with a large dataset requires large computer memory and takes lengthy processing time. Numericware i addresses these challenges with 2 algorithmic methods: multithreading and forward chopping. The multithreading allows computational routines to concurrently run on multiple central processing unit (CPU) processors. The forward chopping addresses memory limitation by dividing a dataset into appropriately sized subsets. Numericware i allows calculation of the IBS matrix for a large genotypic dataset using a laptop or a desktop computer. For comparison with different software, we calculated genetic relationship matrices using Numericware i, SPAGeDi, and TASSEL with the same genotypic dataset. Numericware i calculates IBS coefficients between 0 and 2, whereas SPAGeDi and TASSEL produce different ranges of values including negative values. The Pearson correlation coefficient between the matrices from Numericware i and TASSEL was high at .9972, whereas SPAGeDi showed low correlation with Numericware i (.0505) and TASSEL (.0587). With a high-dimensional dataset of 500 entities by 10 000 000 SNPs, Numericware i spent 382 minutes using 19 CPU threads and 64 GB memory by dividing the dataset into 3 pieces, whereas SPAGeDi and TASSEL failed with the same dataset. Numericware i is freely available for Windows and Linux under CC-BY 4.0 license at https://figshare.com/s/f100f33a8857131eb2db.
Keywords
Background
The inbreeding, identical by descent (synonymous to IBD, kinship, and coancestry), and identical by state (IBS) coefficients are central parameters in population genetics. 1 By definition, (1) the inbreeding coefficient refers to a proportion that a pair of alleles in an entity is identical in origin and state, 2 (2) the IBD coefficient between 2 entities equals twice the inbreeding coefficient for their virtual offspring, 3 and (3) the IBS coefficient between 2 entities equals twice a proportion that a pair of alleles in their virtual offspring is identical in state. The IBD matrix is a conventional indicator to represent genetic relationship among entities in a population, for which pedigrees are available. Emik and Terrill 3 suggested a systematic method for calculating a numerator relationship matrix (NRM) that displays IBD coefficients among every pair of entities in a population. Because the NRM is based on pedigrees, it represents genetic relationship from the genealogical perspective.
High-throughput genotyping technologies provide abundant DNA profile that is useful to calculate the IBS matrix as a genetic relationship matrix. Some references 4 , 5 introduced a method for computing the IBS matrix. Although the concept about the IBS matrix is general and simple, the IBS matrix is not widely used. Presumably, it might be due to the notoriously heavy computing burden. In this paper, we present software referred to as Numericware i. In order to deal with heavy workload, Numericware i supports parallelization and data management to avoid low memory.
Implementation
IBS coefficient
The IBS coefficients4,5 can be calculated:

where IBSA,B = the IBS coefficient between A and B; a1, a2 = a pair of chromosomes for A; b1, b2 = a pair of chromosomes for B; P(a1 ≡ b1) = the probability that a1 and b1 are homozygous; P(a1 ≡ b2) = the probability that a1 and b2 are homozy-gous; P(a2 ≡ b1) = the probability that a2 and b1 are homozygous; and P(a2 ≡ b2) = the probability that a2 and b2 are homozygous.
The IBS coefficient for parents equals twice the homozygote coefficient (H) for their offspring. Thus, the H can be calculated:

where C = the offspring of A and B; HC = the homozygote coefficient for C; a1, a2 = a pair of chromosomes for A; b1, b2 = a pair of chromosomes for B; P(a1 ≡ b1) = the probability that a1 and b1 are homozygous; P(a1 ≡ b2) = the probability that a1 and b2 are homozygous; P(a2 ≡ b1) = the probability that a2 and b1 are homozygous; and P(a2 ≡ b2) = the probability that a2 and b2 are homozygous.
As the cost for producing genotypic data is becoming less expensive, the dimensions of genotypic datasets are rapidly growing. The amount of computing workload can be represented:

where w = the amount of computational workload; n = the number of entities in a population; m = the number of markers.
According to equation 3, the growing dimension of genotypic dataset causes 2 computational challenges: (1) lengthy computational time and (2) low memory.
Functionality of Numericware i
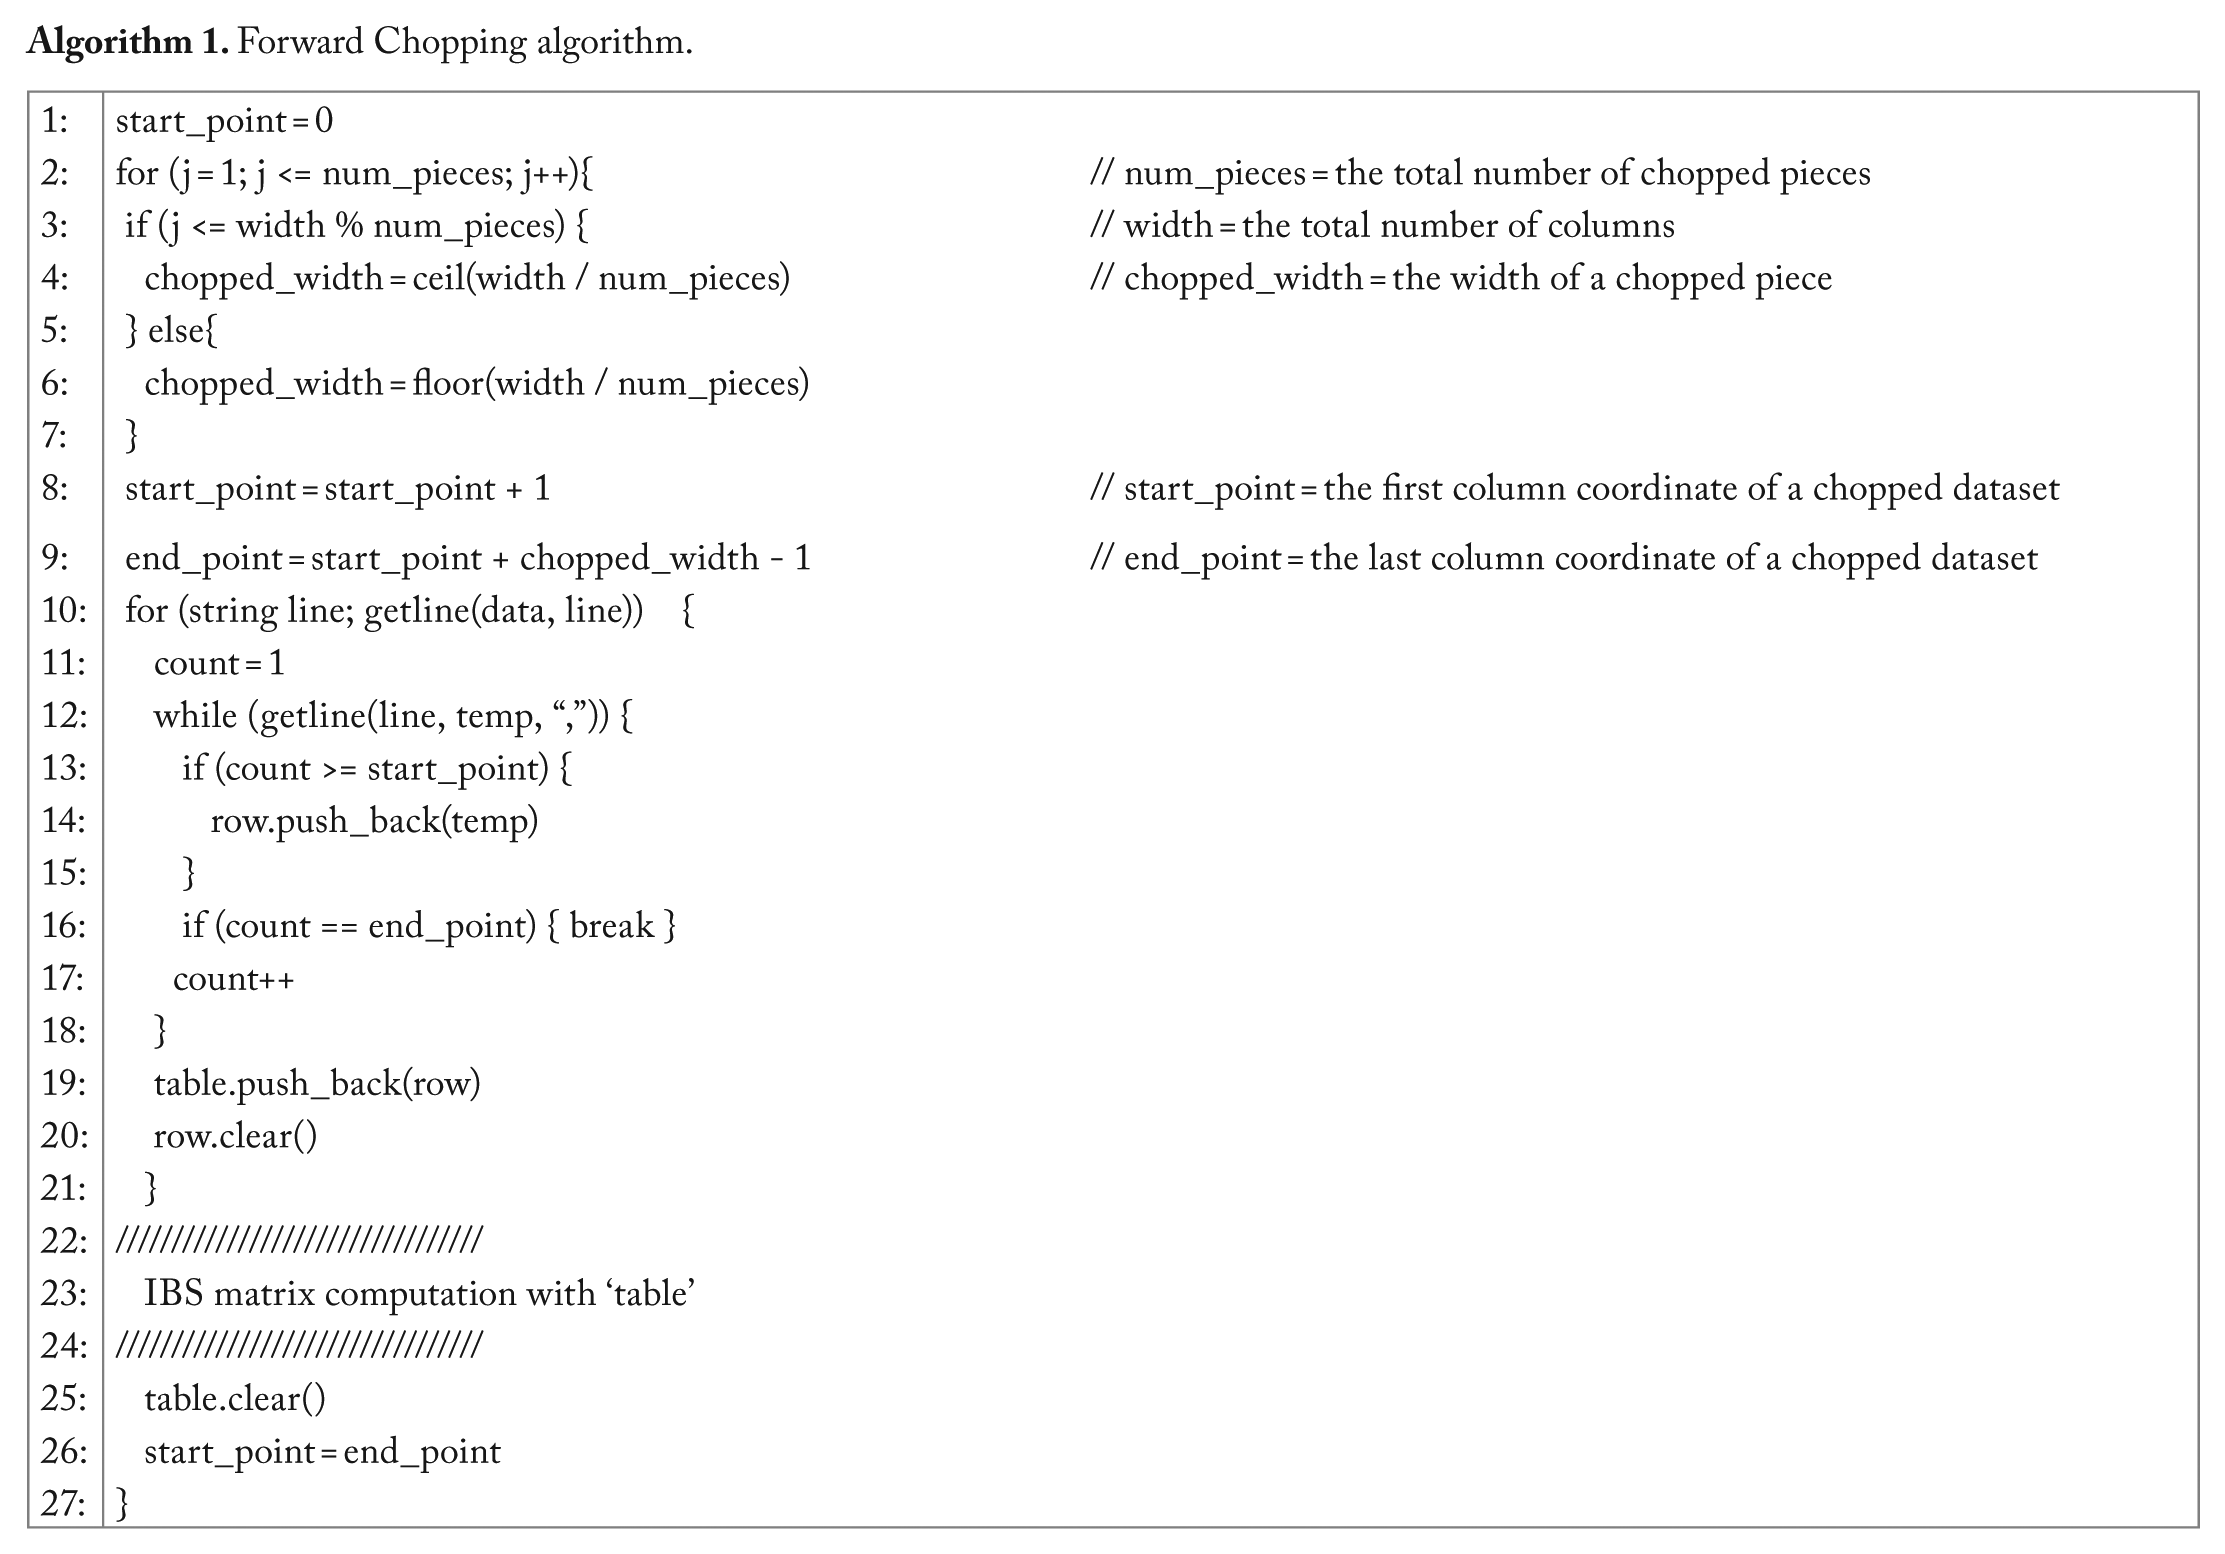
Numericware i, written in C++, has a simple user interface. The software provides 2 special functionalities: multithreading and forward chopping. The multithreading enables the computer to distribute the workload into multiple CPU threads. The forward chopping chops a dataset into multiple pieces that will not overextend memory capacity. Algorithm 1 shows the forward chopping algorithm.
Algorithm 1. Forward Chopping algorithm.
Numericware i provides users with more conveniences:
Imputation not needed: The IBS computation is counting based. Numericware i skips counting missing genotypic data, assuming that the remaining genotypic data are of sufficiently large amount.
IBS computation for a haplotype: This allows computation of the IBS matrix for a partial genomic block.
Dataset integrity checking: This helps prevent a failure in the middle of analysis by checking the integrity of dataset at the beginning of work.
Dataset summary: This provides users with overview of genotypic data.
Supporting multiple types of datasets: This significantly reduces extra works for formatting the dataset. Numericware i accepts: alphanumeric, a pair of single-nucleotide polymorphisms (SNPs) and International Union of Pure and Applied Chemistry (IUPAC) formats.
Transposing the dataset.
Regarding item 5, details about dataset formats are described in the user manual, and example datasets are included in the software package. Numericware i completes the IBS matrix by copying the upper diagonals to the lower diagonals based on its symmetric property to reduce workload.
Application of the IBS matrix
Homozygote coefficient index
A diagonal value for an entity A
Best linear unbiased prediction
As a statistical model, the best linear unbiased prediction (BLUP) 6 is widely used to estimate breeding values. The BLUP requires the genetic relationship matrix, for which Henderson6 suggested using the NRM. The IBS matrix is superior to the NRM in the following aspects. First, the IBS matrix fully has values greater than 0, whereas the NRM includes an identity matrix for a base population. The identity matrix results in underestimation of IBD coefficients within the NRM. Second, the IBS matrix provides an objective measure based on genotypic data whereas the NRM is based on statistical expectation. As the BLUP expands to genome-wide association study and genomic prediction, the IBS matrix can apply to these studies.7-11 The IBS matrix will be useful especially for plants since plant pedigrees are often unknown and imprecise. 12 Previous studies reported that the BLUP outperforms with genome-based genetic relationship matrices than the NRM.13–18 In this context, the IBS matrix will be useful in improving the BLUP accuracy.
Results and Discussion
Negative effect of marker screen to IBS matrix
Marker collections generally consist of markers screened based on allele frequency. Marker screening secures allele diversity but causes an ascertainment bias in calculating the IBS matrix because the removed markers must be informative in representing the identical genomic state between entities. Thus, it is recommended to use all markers in calculating the IBS matrix.
Similarity between IBD and IBS
The IBD and IBS coefficients range between 0 and 2 in common. If it is assured that any identical alleles at the same locus from different entities were generated not independently but inherently, the IBS and IBD coefficients should be equal. 4 We hypothetically assume numerous unique mutations might inherently have flourished genetic diversity because the probability of the same mutations coincidentally occurring on the same loci of multiple genomes could be extremely low. If this assumption is true, the IBS and IBD matrices can be equal.
Comparison of results from Numericware i, SPAGeDi, and TASSEL
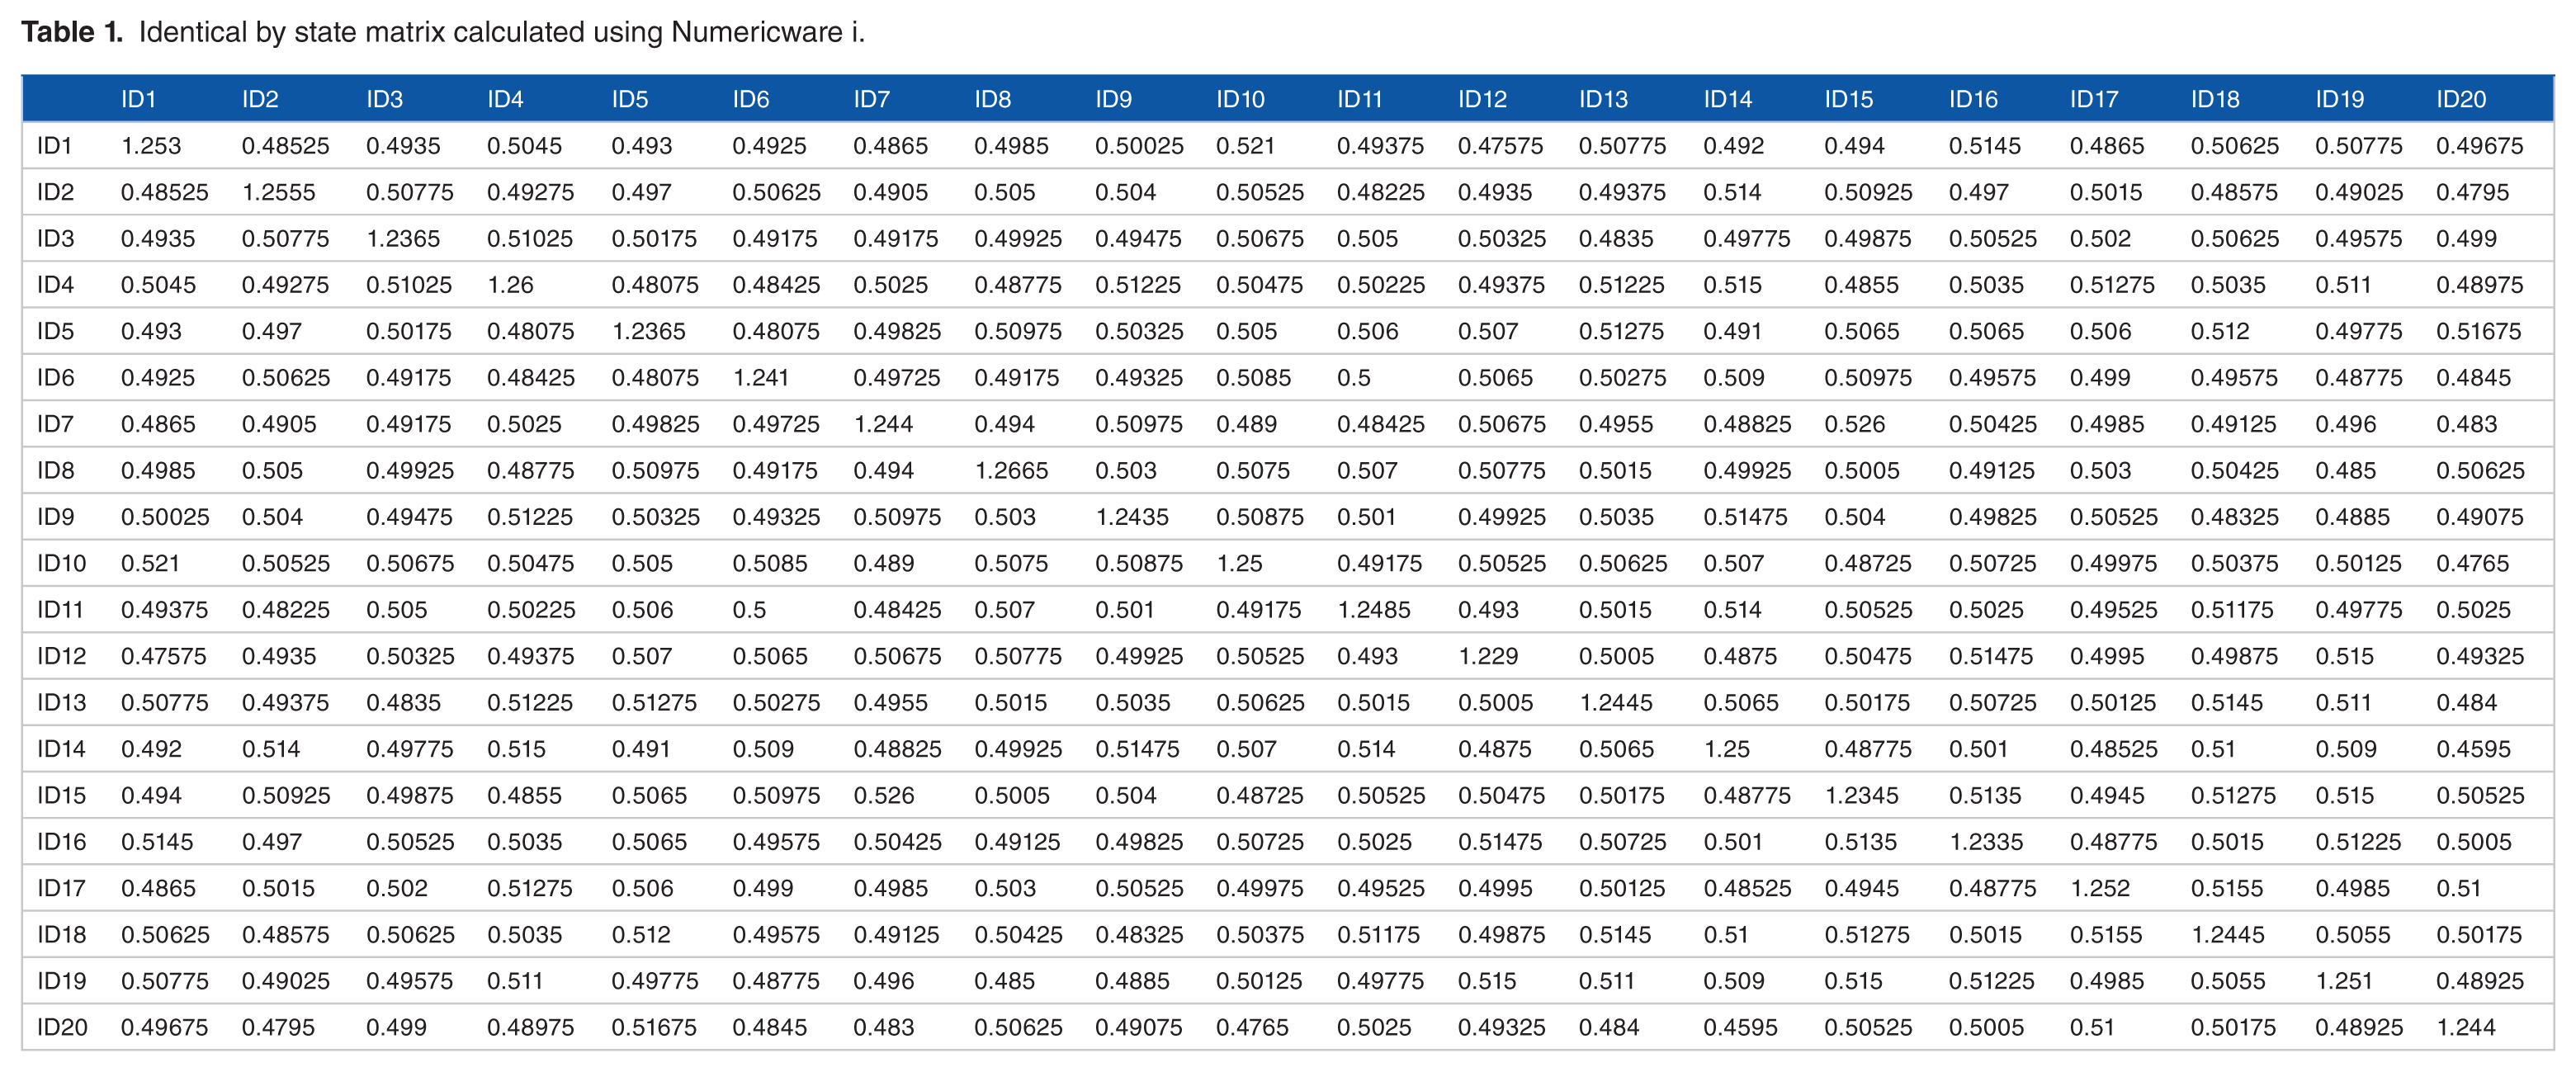
The IBS matrix can be expanded by computing the NRM based on pedigrees of entities within the IBS matrix. The expanded IBS matrix will have overall increased elemental values than the NRM solely based on pedigrees. The expansion of IBS matrix can be calculated using Numericware N. 19 Other popular software, SPAGeDi 20 and TASSEL, 8 implement different algorithms for calculating the genetic relationship matrix, causing their results to have different characteristics, such as negative values (SPAGeDi and TASSEL) or mono-diagonal values (SPAGeDi with 0’s). Thus, the resulting matrices from SPAGeDi and TASSEL cannot be expanded by the NRM algorithm. For comparison, we applied Numericware i, SPAGeDi, and TASSEL to the same dataset of 20 entities by 2000 SNPs (included in Supplementary file). The algorithms used by SPAGeDi and TASSEL are the ones by Loiselle et al 21 and Yang et al 22 , respectively, and widely used for calculating the genetic relationship matrices.7,23–26 Tables 1 to 3 are the resulting matrices. Pearson correlation coefficients among the 3 matrices (Table 4) indicate that the results from Numericware i and TASSEL are highly correlated at .9972, whereas the result from SPAGeDi shows low correlation coefficients with the results from Numericware i (0.0505) and TASSEL (0.0587). This illustrates that the results from Numericware i and TASSEL are substantially comparable, whereas SPAGeDi is not.
Identical by state matrix calculated using Numericware i.
Genetic relationship matrix calculated based on the method of Loiselle et al. (1995) using SPAGeDi.

Normalized identical by state matrix calculated based on the method of Yang et al. (2011) using TASSEL.

Pearson correlation coefficients among results from Numericware i (Table 1), SPAGeDi (Table 2), and TASSEL (Table 3) for the same dataset.

Performance
In our test, Numericware i took 382 minutes in computing an IBS matrix with a simulated dataset of 500 entities by 10 000 000 SNPs using 19 CPU threads (Intel Xeon processor E5-2600 v4) and 64 GB memory. For this test, the whole dataset was chopped into 3 pieces to circumvent the low memory, whereas SPAGeDi and TASSEL failed with the same dataset due to the low memory.
Conclusions
The IBS matrix can be useful as: (1) a foreseeing index about the homozygote coefficients for hybrid lines based on the IBS coefficient for parents being equal to twice the homozygote coefficient for an offspring, (2) an assessment of homozygote coefficient to an entity itself based on IBSA,A being equal to 1 + HA, and (3) a component of the BLUP. Thus, Numericware i can be an essential tool for breeding. The multithreading and forward chopping reduce computing time and allow processing of extremely large amount of data. In contrast, other software are often limited by the physical memory size, and only a single CPU is supported. Numericware i is freely available for Windows and Linux under CC-BY 4.0 license and can be downloaded from https://figshare.com/s/f100f33a8857131eb2db.
Footnotes
Peer review:
Four peer reviewers contributed to the peer review report. Reviewers’ reports totaled 1357 words, excluding any confidential comments to the academic editor.
Funding:
The author(s) disclosed receipt of the following financial support for the research, authorship, and/or publication of this article:Funding was provided by the North Central Soybean Research Program and by the Department of Agronomy at Iowa State University.
Declaration of conflicting interests:
The author(s) declared no potential conflicts of interest with respect to the research, authorship, and/or publication of this article.
Author Contributions
BK built software. BK and WDB analyzed, discussed, and wrote.
References
Supplementary Material
Please find the following supplemental material available below.
For Open Access articles published under a Creative Commons License, all supplemental material carries the same license as the article it is associated with.
For non-Open Access articles published, all supplemental material carries a non-exclusive license, and permission requests for re-use of supplemental material or any part of supplemental material shall be sent directly to the copyright owner as specified in the copyright notice associated with the article.