
Abstract
I show several types of topological biases in distance-based methods that use the least-squares method to evaluate branch lengths and the minimum evolution (ME) or the Fitch-Margoliash (FM) criterion to choose the best tree. For a 6-species tree, there are two tree shapes, one with three cherries (a cherry is a pair of adjacent leaves descending from the most recent common ancestor), and the other with two. When genetic distances are underestimated, the 3-cherry tree shape is favored with either the ME or FM criterion. When the genetic distances are overestimated, the ME criterion favors the 2-cherry tree, but the direction of bias with the FM criterion depends on whether negative branches are allowed, i.e. allowing negative branches favors the 3-cherry tree shape but disallowing negative branches favors the 2-cherry tree shape. The extent of the bias is explored by computer simulation of sequence evolution.
Introduction
Topological bias of phylogenetic methods has been noted a long time ago as a potential source of bias in the study of speciation processes (Huelsenbeck and Kirkpatrick, 1996). Understanding the bias in different phylogenetic methods can help us explain previously unexpected observations in phylogenetic studies (Bruno and Halpern, 1999; Hillis, 1998; Huelsenbeck, 1998; Purvis and Agapow, 2002; Swofford et al. 2001). For example, a rooted tree with eight operational taxonomic units (OTUs) has many fewer possible perfectly symmetrical trees than maximally asymmetric trees. Consequently, a phylogenetic algorithm that picks up random trees, or even a good phylogenetic algorithm working on data that have already lost almost all the phylogenetic information such as extremely diverged sequences, would be more likely to end up with a maximally asymmetrical tree than a perfectly symmetrical tree (Huelsenbeck and Kirkpatrick, 1996).
Topological bias may confound the evaluation of the relative performance of phylogenetic methods in studies (e.g. Yang, 1997) that use a model tree to simulate sequence evolution and evaluate phylo-genetic algorithms by checking which one is the most efficient in recovering the model tree. For example, if a 4-OTU model tree has two sister OTUs with long branches, then phylogenetic algorithms, especially the maximum parsimony method, that suffers from the long-branch attraction problem will tend to be the most efficient in recovering the known tree and may be misconstrued to be the best algorithm (Bruno and Halpern, 1999).
Here I report several kinds of topological biases in phylogenetic reconstruction by the distance-based methods based on the minimum evolution or Fitch-Margoliash criterion in selecting the best topology. The distance-based methods for phylogenetic reconstruction have several advantages over maximum parsimony and maximum likelihood methods. First, they are typically fast. Second, one can implement complicated substitution models such as those underlying the paralinear and Log-Det distances that would be difficult to implement in a maximum likelihood framework, although such attempt has been made recently (Jayaswal et al. 2005). Third, they appear to suffer less from the inconsistencies reported for maximum parsimony methods. Forth, they are better than maximum parsimony methods in estimating divergence time because of its model-based correction for multiple hits. For these and perhaps many other reasons, the distance-based methods have been used widely in molecular phylogenetics, especially with a large number of OTUs or in large-scale simulations (e.g. Xia et al. 2003b). In particular, the simplicity of the distance-based methods can often allow researchers to identify potential bias in reconstructed phylogenetic trees more readily than other methods (e.g. Xia et al. 2003a).
Topological bias associated with the least-squares method and the minimum evolution (ME) criterion has previously been illustrated with four OTUs (operational taxonomic units) (Xia, 2006). Here I further explore the bias with six OTUs and with both the ME and the Fitch-Margoliash (FM) criterion. The reason for using more than four or five species is because a 6-OTU tree has two tree shapes (Felsenstein, 2004, p. 33) whereas a 4-OTU or 5-OTU tree has only one tree shape and consequently is not useful to explore bias associated with tree shapes.
I will first briefly describe the statistical features common to frequently used distance-based methods and illustrate the systematic bias shared among these distance-based methods when the minimum evolution (ME) or Fitch-Margoliash (FM) criterion is used in choosing the best tree. This is followed by computer simulations to explore the extent of the bias.
Mechanistic Illustration of the Bias
Let us start with the two contrasting topologies A and B (Fig. 1). Designate Dij as the genetic distance between OTUs i and j. The least-squares estimate of xi for Topology A (Fig. 1a) is:
Two contrasting topologies (a) and (b) with six OTUs, together with a third topology (c) which is the intermediate of the two. Topologies A and B converges to Topology C when x7 approaches zero.
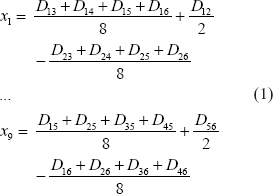
The xi values for Topology B (Fig. 1b) are,

To save space in writing equations, I will equate:
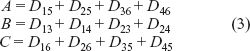
According to the minimum evolution (ME) criterion, the best tree is the one with the shortest tree length (TL). Designating the tree length of Topology A and Topology B as TLa and TLb, respectively, we have:
The tendency of favoring Topology B, measured as (TLa – TLb), is

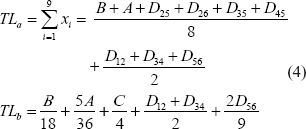
For the BME algorithm (Desper and Gascuel, 2002), the corresponding equation (derived by O. Gascuel, pers. comm.) is
It is interesting to note that, although equation (6) differ in form from equation (5), Tb.BME is expected to be 0 in two identical situations mentioned in the previous paragraph: (1) when x7 = 0 in Topology A and Topology B in Fig. 1 and (2) when sequences experienced full substitution saturation so that all Dij values are expected to be the same.
Comparison between allowing (a) and disallowing (b) negative branch lengths, given that the true tree is Topology C in Fig. 1 with all branch lengths set to 0.1 and that D56 is the only genetic distance estimated inaccurately. Tb.ME, Tb.FM0 and TbFM2 are explained in the text.
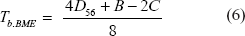
The FM criterion for choosing the best tree is based on

In the FITCH program in PHYLIP, the default value for P in equation (7) is 2 but it can be 0 or any other value. Here I consider only two cases, with P = 0 (which means that the denominator will always be 1) and P = 2 (the default in PHYLIP's FITCH program).
When P = 0, the expressions for SS in equation (7) are relatively simple for Topology A and Topology B, and their difference can be written as

Consider first Topology C in Fig. 1c with all branch lengths equal to 0.1. Note that Topology A and Topology B converges to Tree C when x7 approaches 0. When there is no error in estimating Dij, then Tb.ME, Tb.FM0 and Tb.FM2 (not shown) are all equal to 0 for Topology C, which is expected because Topology C is exactly intermediate between Topology A and Topology B. It is known that, if Dij values are estimated accurately, then the application of the ME criterion does not have bias favoring any particular topology (Bryant and Wadell, 1998; Rzhetsky and Nei, 1993).
I now consider a special case when D56 is underestimated or overestimated, i.e. when the estimated D56 is different from the true value of 0.2 (Fig. 1c). In reality, because of the shared branches between some distances, the error will not be limited to just one distance. However, examining this special case will shed light on various aspects of the topological biases arising from the application of the ME and the FM criteria.
Negative branch lengths allowed
The effect of inaccurate estimation of D56 (= x8 + x9) when the true tree is Topology C in Fig. 1 with all branch lengths equal to 0.1, except for x8 and x9. The x7 values are from the least-squares evaluation with Topology A. Tb.ME, Tb.FM0 and Tb.FM2 are explained in the text.

Negative branch lengths not allowed
With Topology A, when D56 is underestimated, there is no negative branch length when branch lengths are evaluated by the least-squares method, so disallowing negative branch lengths has no effect on SSa. However, with Topology B, x7 may become negative with an underestimated D56, so disallowing negative branch lengths will affect SSb. Similarly, when D56 is overestimated, disallowing negative branch lengths will not affect SSb because all branch lengths for Topology B will be positive from the least-squares method. However, the over-estimation of D56 will leads to a negative x7 for Topology A. So SSa will be affected when negative branch lengths are not allowed. I numerically illustrate below the effect of disallowing negative branch lengths.
The common treatment of negative branches is to set them to zero and re-estimated the length of other branches. Thus, when D56 is underestimated leading to a negative x7 in Topology B, we will set x7 = 0 and re-estimate the lengths of other branches in Topology B. Similarly, when D56 is overestimated leading to a negative x7 in Topology A, we will again set x7 = 0 and re-estimate the lengths of other branches in Topology A. Note that here we do not need the iterative method for estimating branch lengths with the weighted least-squares method (Felsenstein, 1997). The re-estimation results in two sets of formulae of T b.ME , Tb.FM0 and Tb.FM2, with one set for underestimated D56 and another for overestimated D56.

There are three points worth highlighting. First, both Tb.ME, D56≤0.2 and Tb.FM0, D56≤0.2 approach zero when D56 approaches the true value of 0.2, which is expected because the ME and the FM criteria are not biased when Dij values are accurately estimated (Bryant and Wadell, 1998; Rzhetsky and Nei, 1993). Second, Tb.ME, D56≤0.2 is a linearly increasing function of the underestimated D56 with a slope of 3/14 in equation (9), which is smaller than the slope of 5/18 in equation (5). This means that the bias in favor of Topology A with an underestimated D56 is less serious when negative branch lengths are not allowed than when negative branch lengths are allowed. Third, Tb.FM0 has a negative quadratic term such that Tb.FM0 will approach zero asymptotically, instead of linearly as Tb.ME, when D56 approaches the true value of 0.2. In particular, when D56 is underestimated, disallowing negative branch lengths does not help with the FM criterion as we can see from Fig. 2. The topological bias for D56 < 0.2 is in fact greater when negative branches are not allowed (Fig. 2b) than when negative branches are allowed (Fig. 2a).

There are again three points worth highlighting. First, Tb.ME increases linearly (i.e. Topology B will be increasingly favored) with overestimation of D56. However, the slope (= 4/63) is much smaller than that for underestimated D56 shown in equation (9) where the slope is 3/14. This means that the topological bias associated with overestimating D56 will not be as serious as underestimating D56 when negative branch lengths are not allowed. This suggests that, when negative branch lengths are not allowed, overestimation of Dij is not as problematic as underestimation of Dij. Therefore, the advice of using overly simple distances that tend to underestimation Dij (Nei, 1996; Nei and Kumar, 2000, pp. 112–113) should be taken with caution. Second, for Tb.FM0, contrary to the negative quadratic term of D56 in equation (8) where negative branch lengths are allowed, the quadratic term of D56 in equation (10) is positive. This means that the application of the FM criterion will no longer favor Topology A against Topology B as it did before when negative branch lengths are allowed. Instead, the topological bias has changed direction when we change from allowing negative branch lengths to disallowing negative branch lengths.
The topological bias associated with the inaccurate estimation of D56 for our special case, when negative branch lengths are not allowed, is illustrated in Fig. 2b. I highlight two points. First, when Dij are accurate, then the FM criterion is better than the ME criterion (e.g. when D56 is within the range of 0.19–0.21 in Fig. 2). Second, when the error associated with Dij is sufficiently large, then at least the FM2 criterion is worse than the ME criterion (e.g. when D56 is < 0.17 or > 0.25 in Fig. 2). While previous simulations suggest that disallowing negative branches may significantly improve the performance of distance-based methods (Kuhner and Felsenstein, 1994), our results show that the improvement may only be seen in cases where Dij values are estimated with great accuracy.
Summary of topological biases showing which of the two topologies (A and B) is favored under different conditions. Strong bias is indicated by bold font.

Negative branches.
Simulation and Discussion
Given the topological bias identified in the previous section, I used simulation to further explore the extent of the bias in practical scenarios. I used the EVOLVER program in the PAML package (http://abacus.gene.ucl.ac.uk/software/paml.html) to simulation sequence evolution with Tree A and Tree B in Fig. 3 which correspond to Topology A and Topology B (Fig. 1), respectively. Phylogenetic analysis was carried out by using DAMBE (Xia, 2001; Xia and Xie, 2001).
Two contrasting model trees used to simulate sequence evolution. All branch lengths are 0.02 except for those specifically labeled.
The substitution model used in the simulation is K80 (Kimura, 1980), with κ = 5 and equal nucleotide frequencies, and with no rate heterogeneity over sites. The sequence length was set to 1500 bases and the simulation of sequence evolution was repeated 500 times for each tree.
I used the JC69 and F84 distances to compute genetic distances. Because the sequences are generated with the K80 model, DJC will tend to underestimate DK80 when Q ≠ 2P (where P and Q are the proportion of sites with transitional and transversion substitutions, respectively) due to stochastic noise, and the resulting tree is expected to exhibit the bias associated with underestimation of Dij. In contrast, DF84 tends to overestimate DK80 whenever nucleotide frequencies are different from 0.25 and the resulting tree is expected to exhibit the bias associated with overestimation of Dij.
Simulation with Tree A
Consensus trees from simulated sequences using the K80 model and Tree A in Fig. 3 but with Dij estimated by the JC69 model. The label for each tree is in the form of “Criterion:Negative branch lengths allowed or not.”
There is substantial difference in bootstrap values between the consensus tree in Fig. 4a (with negative branch length allowed), and that in Fig. 4b (with no negative branch length allowed), based on the ME criterion. This is expected from Table 2. With an underestimated D56, the ME criterion is more biased towards Topology A when negative branch lengths are allowed than when negative branch lengths are not allowed (Table 2). So we expect the bootstrap support for Topology A to be stronger when negative branch lengths are allowed (Fig. 4a) than when negative branch lengths are not allowed (Fig. 4b).
Simulation with Tree B

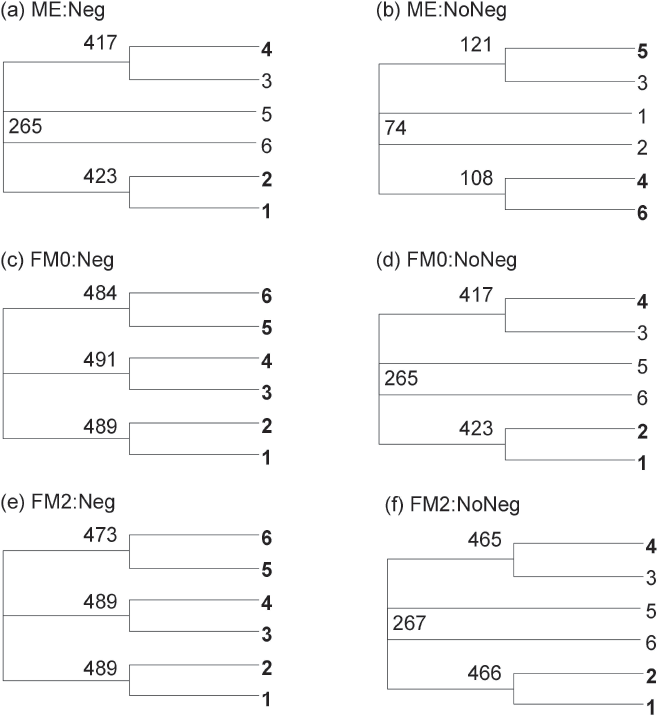
The bias associated with the ME criterion in favor of Topology A should be alleviated by not allowing negative branches (Table 2). This explains why the consensus tree allowing negative branches (Fig. 6a) assumes Topology A whereas the consensus tree not allowing negative branches (Fig. 6b) assumes Topology B. We also note that not allowing negative branches makes the FM2 criterion even more biased in favor of Topology A (Table 2). This explains why the consensus tree in Fig. 6f assumes Topology A whereas the consensus tree in Fig. 6e assumes Topology B.

For the FM criterion, the topological bias associated with the overestimation of D56 will be in opposite direction depending on whether negative branch lengths are allowed or not. According to Table 2, the FM criterion will favor Topology A when negative branch lengths are allowed, but Topology B when negative branch lengths are not allowed. This prediction is clearly substantiated by the consensus trees obtained with the FM criterion, especially with the FM2 criterion (Fig. 7e–f), where the consensus tree assumes Topology A when negative branch lengths are allowed but Topology B when negative branch lengths are not allowed.
I should finally discuss four issues closely related to our study. First, our result highlights the inadequacy of many studies evaluating relative performance of phylogenetic algorithms involving only four OTUs. The topological bias in the distance-based methods shown in our paper cannot be revealed unless one has at least six OTUs because, for unrooted trees with fewer OTUs, there is only one unrooted bifurcating tree shape.
Second, when a large number of OTUs are included in a phylogenetic study, it is highly likely that different subtrees may be governed by different substitution models and the genetic distance based on any one particular distance may overestimate some distances and underestimate others. This may cause problems in building very large trees with different subtrees suffering from different topological biases.
Third, the current paper is limited in at least two major ways. First, much of the analysis is based on the consequence of overestimation or underestimation of D56. Second, it does not provide a large-scale and realistic simulation to explore the consequence of the bias in practice. We are currently addressing these two problems.
Footnotes
Acknowledgments
This study is supported by grants from NSERC (Natural Science and Engineering Research Council of Canada) Discovery, Research Tools and Instruments, and Strategic Grants. I thank S. Aris-Brosou, O. Gascuel, and H. Xiong for comments and suggestions. O. Gascuel derived equation. Two anonymous reviewers provided helpful comments.