
Abstract

Dear Editor,
Having read the recent article from Hogg et al. with interest, we have been able to revisit the dataset. 1 They investigated the impact of ranibizumab and aflibercept intravitreal injections (IVIs) in a large, real world cohort of individuals with branch retinal vein occlusion (BRVO) complicated by macular oedema. Also, they examined the impact of switching from ranibizumab to aflibercept in refractory cases. It was interesting to see that basic demographic data can predict visual outcome to some extent for BRVO (R2 = 0.498), though not with sufficient accuracy for clinical application.
We repeated this analysis on the BRVO data with the addition of central retinal vein occlusion (CRVO) data, collected using the same method. 1 We aimed to improve its prognostic capacity using machine learning which was aided by the increased size of this dataset. A total of 428 eligible eyes were identified (222 left eye, 206 right eye, 200 CRVO, 228 BRVO, 213 male, 215 female, mean age 72.6, mean delay between diagnosis and treatment 118.2 days) with a mean visual acuity (VA) at treatment initiation of 50.6 early treatment diabetic retinopathy study (ETDRS) letters and a mean VA of 59.0 letters following 1 year of real world treatment. Linear regression and random forest regression were performed to predict 1-year visual acuity from baseline data. 2 Linear regression accounted for 57% (R2 = 0.57) of the observed variability in 1-year VA of this larger data set. Random forest regression was trained on 80% of the dataset with an ability to account for 62% of the observed variability in 1-year visual prognosis in the remaining 20% test dataset (R2 = 0.62).
Feature importance defines the contribution each feature makes towards the output of the random forest regression model (Figure 1). This helps to explain the model’s logic and minimises the ‘black box’ effect, whereby a system transforms inputs to outputs through unknown means. Other measures of the random forest model’s prognostic ability include mean absolute error of 9.8 (MAE), and mean squared error of 163.02 (MSE). MAE represents the number of letters of disagreement that can be expected between predicted 1-year VA and observed 1-year VA for an individual, whereas the MSE highlights outliers where VA was predicted particularly poorly. This description helps to understand the viability of such prognostic models in the clinic, but also facilitates external comparison. Notably, this application of machine learning already demonstrates comparable prognostic capabilities to similar methods applied to age-related macular degeneration when imaging also contributed to the data. 3 Human led image analysis in RVO has found significant visual prognostic value in baseline imaging features such as ellipsoid zone integrity and inner retina mean greyscale value.4,5 Taken together, the potential of machine learning to provide individualised visual prognosis at baseline to clinicians and patients is likely to be greater in RVO. Given the significant minority of individuals found to have little visual gain from serial IVIs, a dependable prognostic tool such as this could be of real value to patients deciding whether or not to commit to treatment.
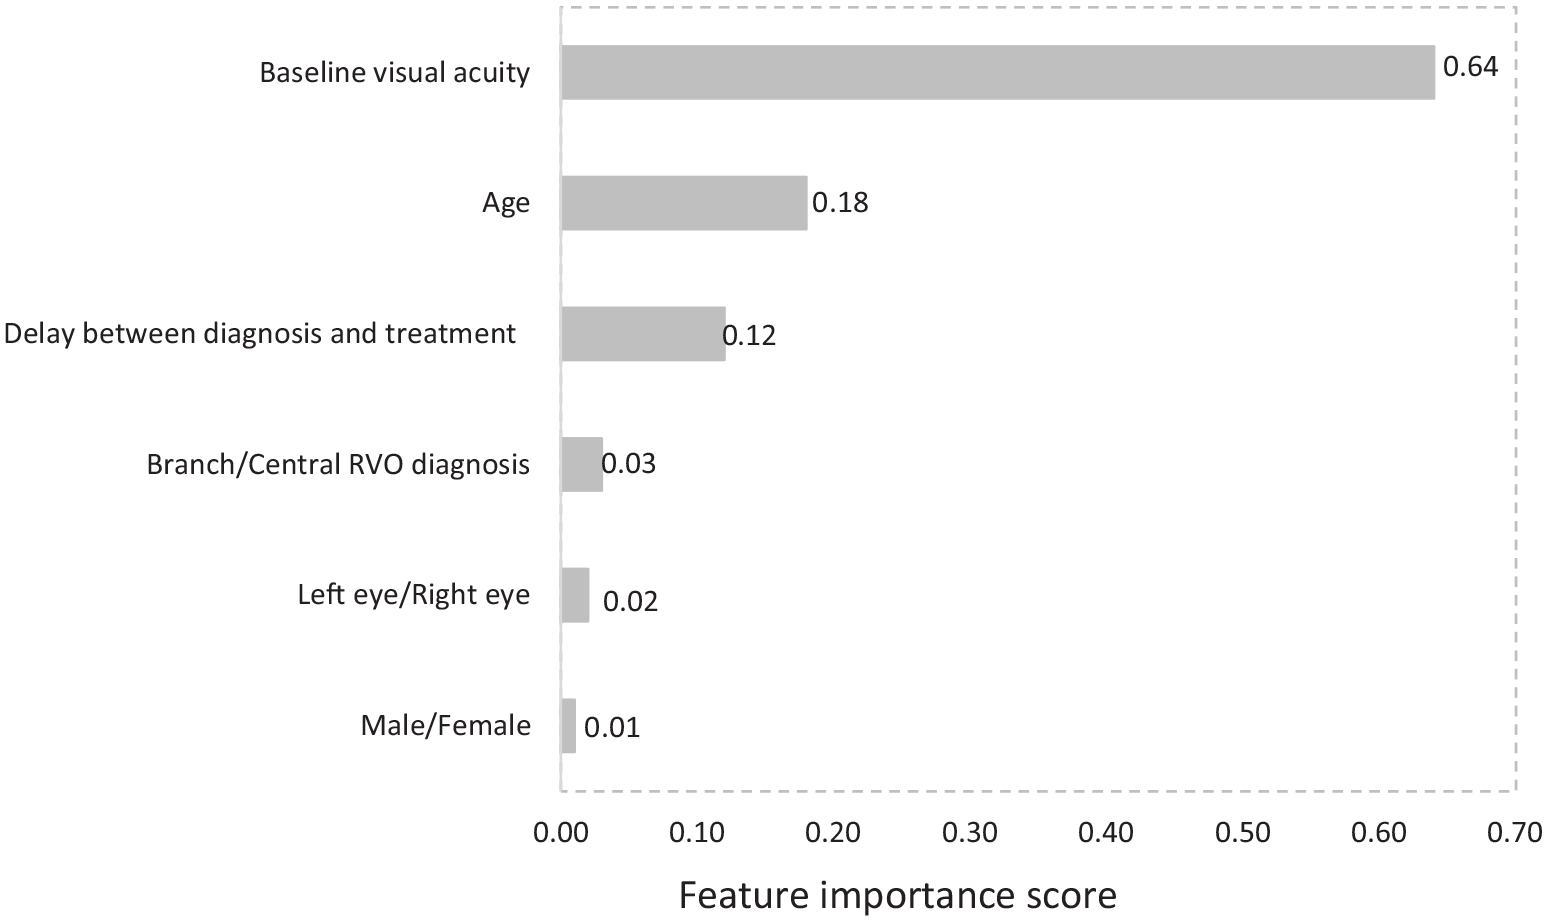
Bar chart describing the relative importance of baseline features contributing to a machine learning regression for the prediction of visual acuity for retinal vein occlusion (RVO) complicated by macular oedema after 1 year of real world anti-vascular endothelial growth factor treatment (R2 = 0.62).
Footnotes
Declaration of conflicting interests
The author(s) declared no potential conflicts of interest with respect to the research, authorship and/or publication of this article.
Funding
The author(s) received no financial support for the research, authorship and/or publication of this article.