
Abstract
Introduction
Terms and Definitions
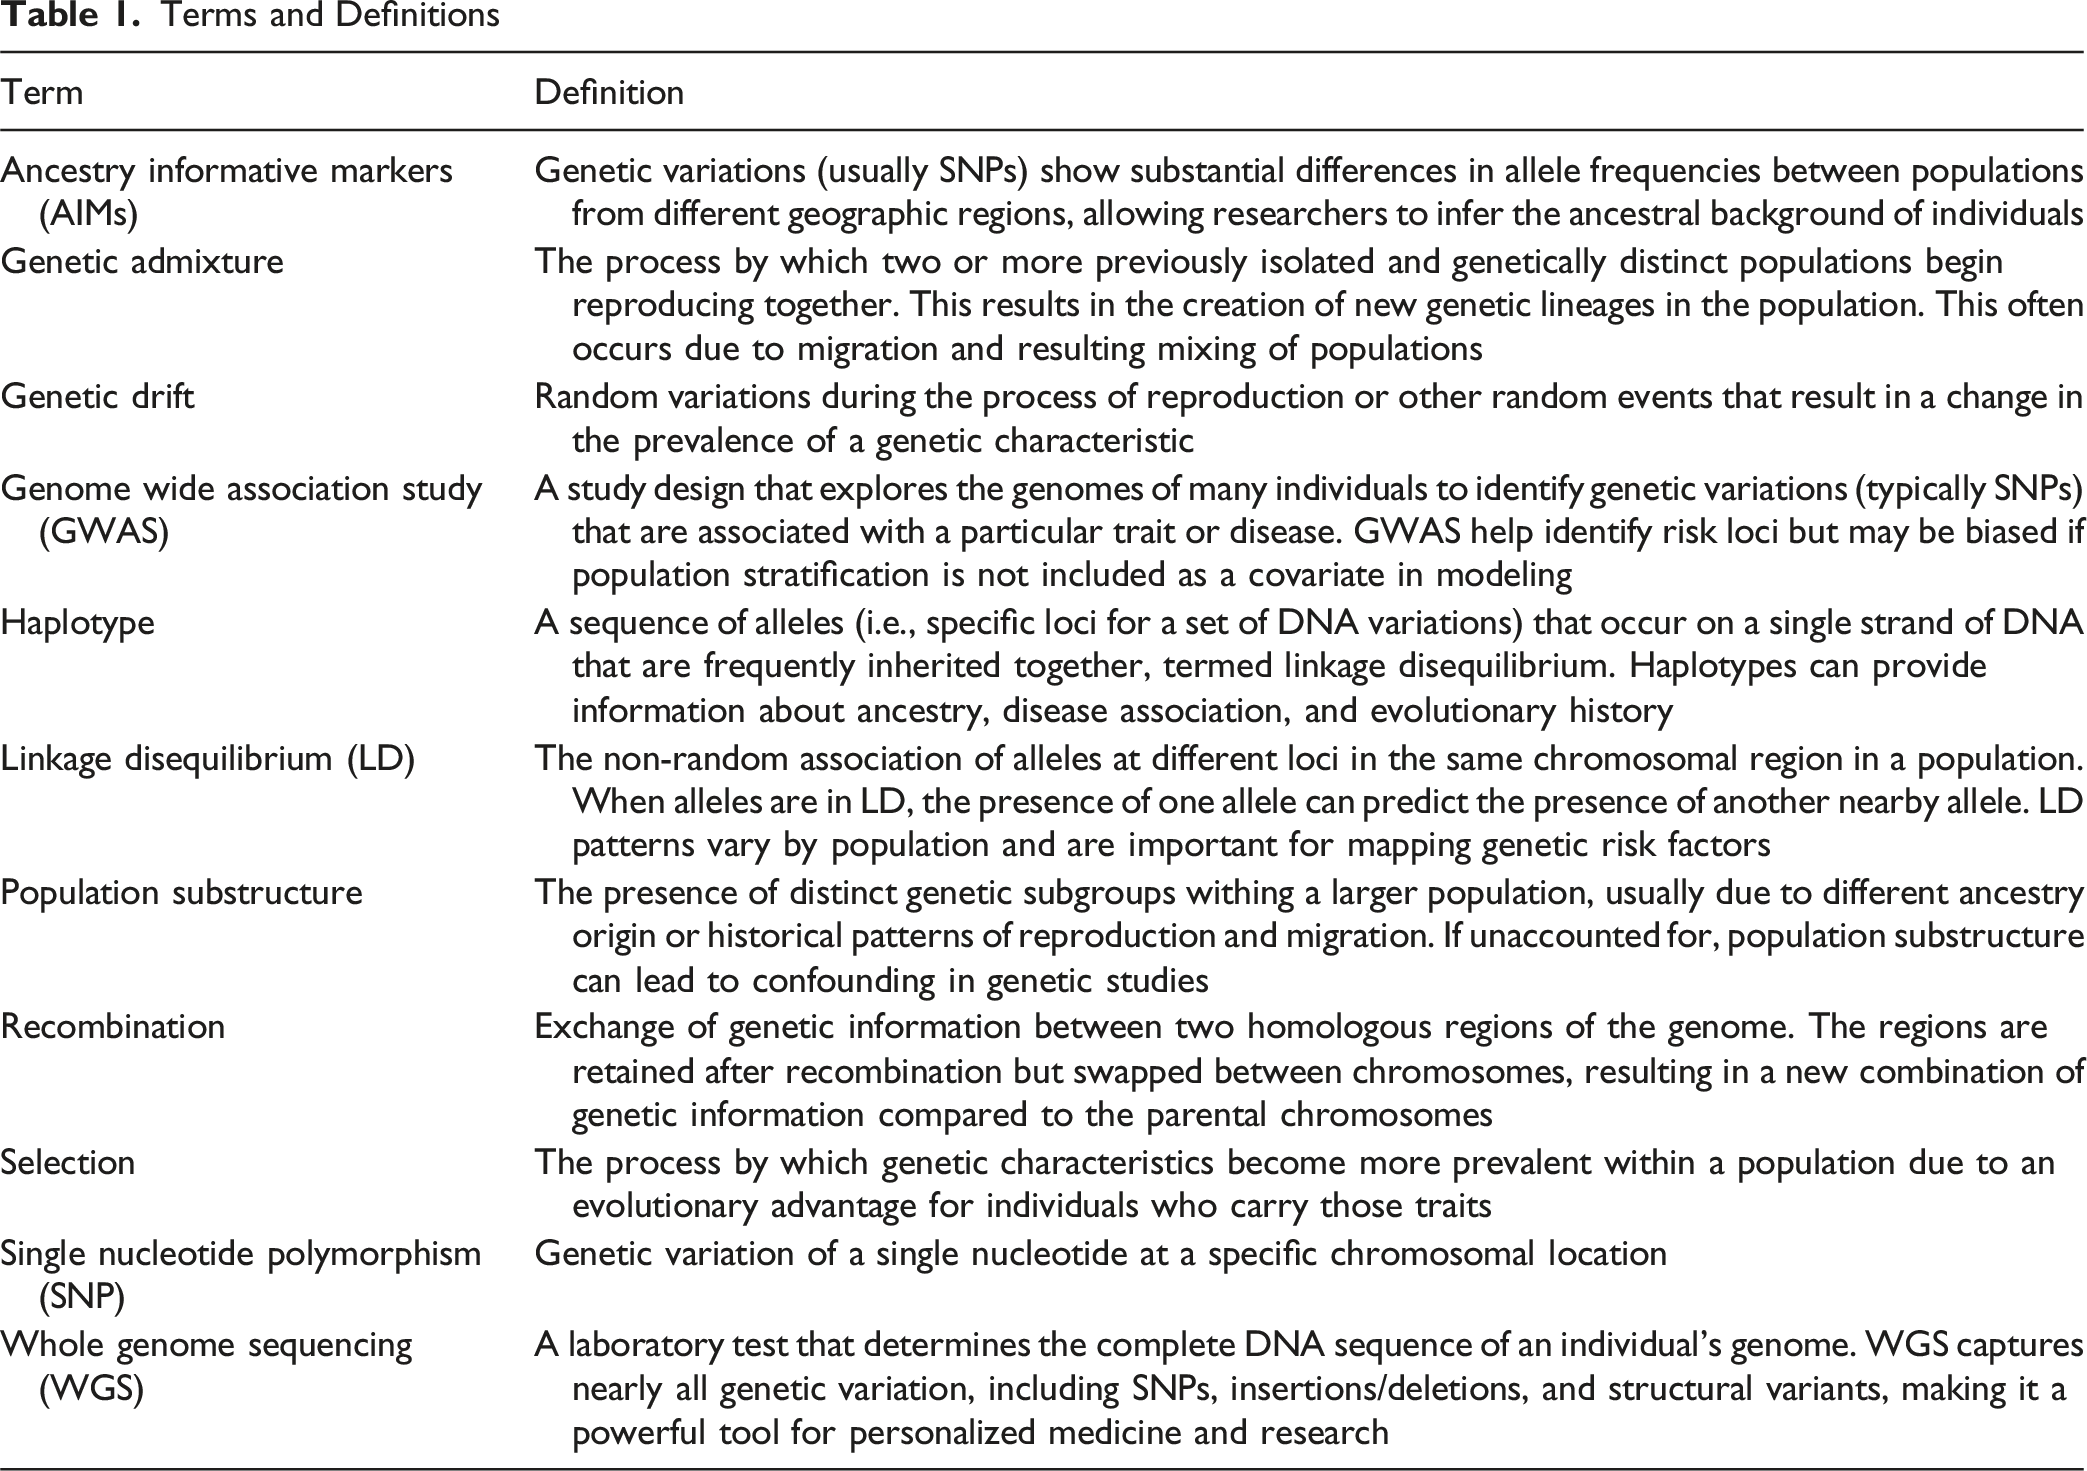
Variation in allele frequencies across geographic regions is influenced by genetic mechanisms, including recombination, genetic drift, and natural selection (Table 1). In addition to these processes, geographic isolation can also lead to enrichment of specific variation in populations over time (Chang et al., 2018; Good, 2022; Okazaki et al., 2021). The combination of these phenomena can result in a higher prevalence of some genetic characteristics within geographically distinct populations compared to others. Over the past several centuries, the natural occurrence of these events has been outpaced by human migration, resulting in admixture of persons between previously distant geographic regions (Auton et al., 2015). The result of these migration patterns is mixing of genetic material, which occurs in haplotype segments that become progressively smaller with each generation. By mapping specific haplotypes within the genome, we can characterize geographic ancestral origins, referred to as population substructure. For a specific individual, ancestral characteristics are often expressed as proportions of genetic material inherited from multiple individual ancestral populations that show enrichment of certain genetic characteristics. A well-documented limitation of early genome-wide association studies (GWAS) focused on disease outcomes was the lack of representation of geographically diverse study samples, as many studies were conducted in the United States and Europe (Chang et al., 2018). Genetic variants often differ in frequency across ancestral groups, meaning that some variants are common in one population but are rare or absent in others. As a result, the lack of ancestral diversity in GWAS-based studies can lead to biased or incomplete findings, as genetic risk for a given health outcome will only be captured in the ancestral groups represented in the study sample. This creates a “we don’t know what we don’t know” scenario in which latent confounding can bias results for individuals from populations that were not included in the GWAS samples from which genetic risk factors were identified. When this occurs, individuals may be misclassified as low risk not because they lack risk variants, but because those variants have yet to be identified in their ancestral group(s). An approach to addressing latent confounding by ancestry is using ancestry informative markers (AIMs), which measure geographic ancestral origin based on patterns of linkage disequilibrium (Shriner, 2013). These methods allow researchers to better assess the generalizability of study findings based on whether observed associations between genetic risk factors and health outcomes have been tested in study samples with similar ancestral backgrounds.
While AIMs are useful for leveraging intrinsic genomic data to assess risk for health outcomes, extrinsic risk factors (e.g., social, environmental) are often also significant contributors (Figure 1). Until recently, health research often conflated the biological construct of ancestry with the social constructs of race and ethnicity. The advent of AIMs and their respective statistical methods has helped address this shortcoming by enabling the quantification of ancestry independent of socially defined constructs. While it is well understood that race and ethnicity are associated with health outcomes, these associations are often a reflection of lived experiences that are shaped by structural and systemic inequities. However, the biological footprint of such experiences has been difficult to quantify because social constructs do not capture the heterogeneity within and across different race and ethnic groups. AIMs present a methodological approach to disentangle biological ancestry from social determinants, allowing for more accurate testing of causal associations between genetic loci and disease outcomes. Markers Show Example Geographic Regions From which Populations Originate. Genetic Characteristics are Determined by These Ancestral Regions and Interact With Biological, Social, Environmental, and Behavioral Factors to Determine Risk for Complex Disease. Markers Show Example Geographic Regions From which Populations Originate. Genetic Characteristics are Determined by These Ancestral Regions and Interact With Biological, Social, Environmental, and Behavioral Factors to Determine Risk for Complex Disease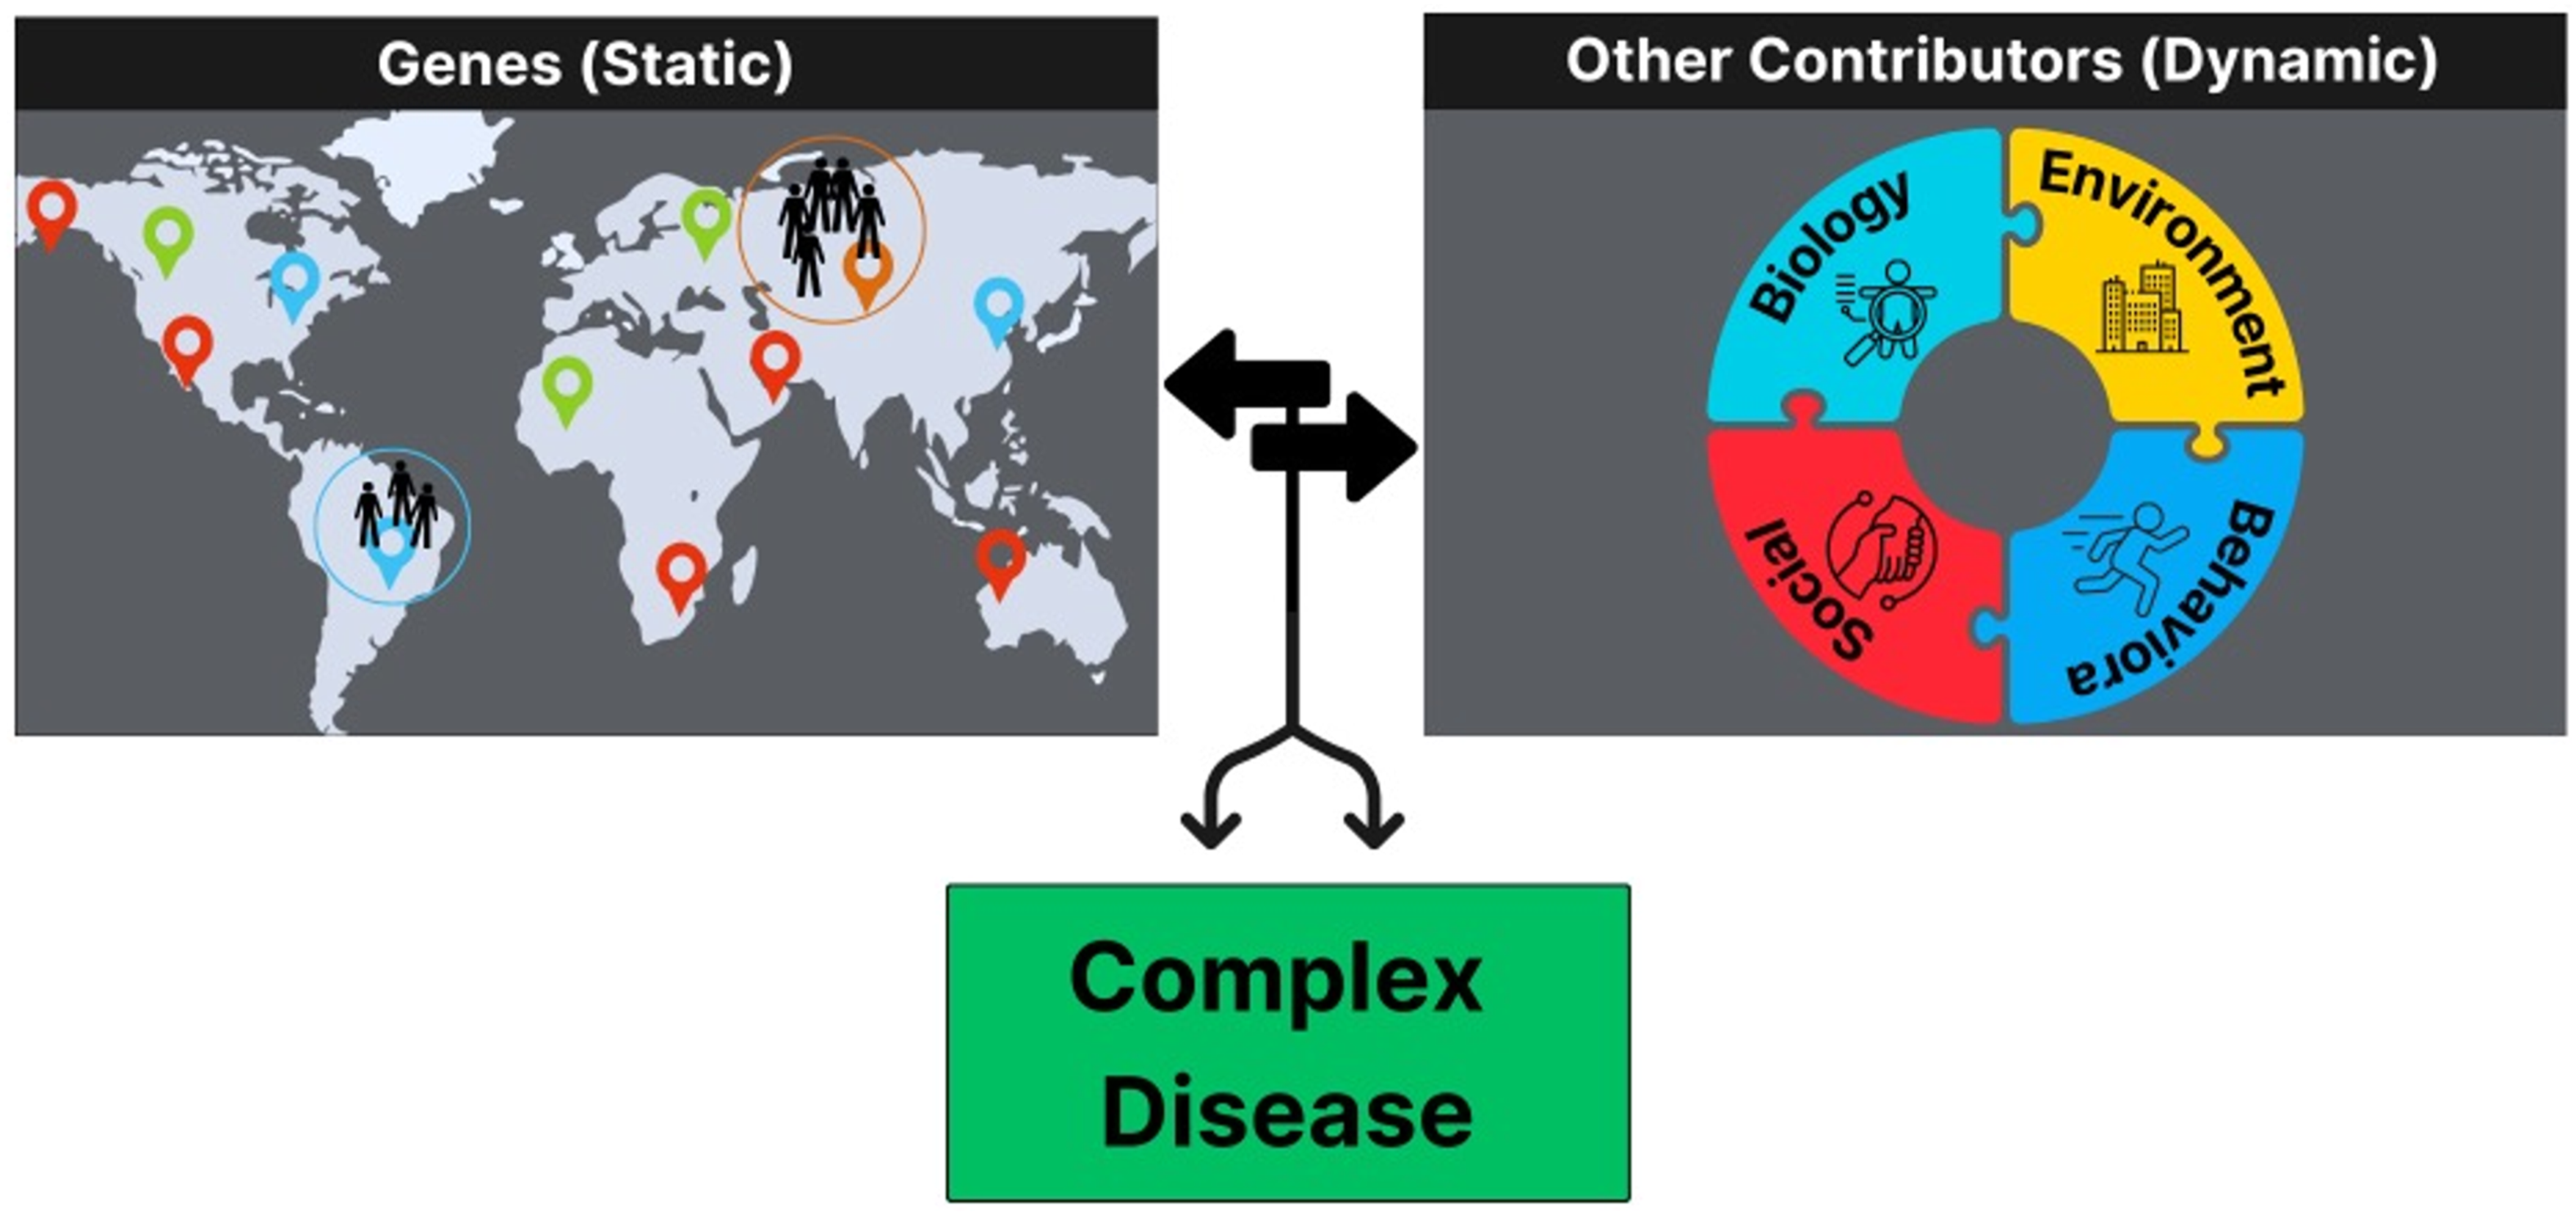
There is broad consensus about the importance of measuring ancestral population characteristics in GWAS, which is summarized in a recent report from the National Academy of Sciences that provides a framework for population descriptors in genetics and genomics research (National Academy of Sciences, Engineering, and Medicine, 2023). These practices are now widely being implemented in large-scale research studies that leverage national and international datasets. For example, a recent study that leveraged data from All of Us Research Program showed that self-identified race and ethnicity do not precisely align with underlying genetic ancestry. (Gouveia et al., 2025) This is particularly true for individuals who self-identified as Hispanic or Latino who were represented by a wide gradient across principal components of ancestry. This study also validated previous findings that there is greater genetic variation within race and ethnic groups compared to across groups, further supporting the need to accurately define biological ancestral characteristics rather than using race and ethnicity as a proxy estimate for ancestry in order to inform generalizability of study findings and prevent confounding in estimates of the variables that determine causal relationships.
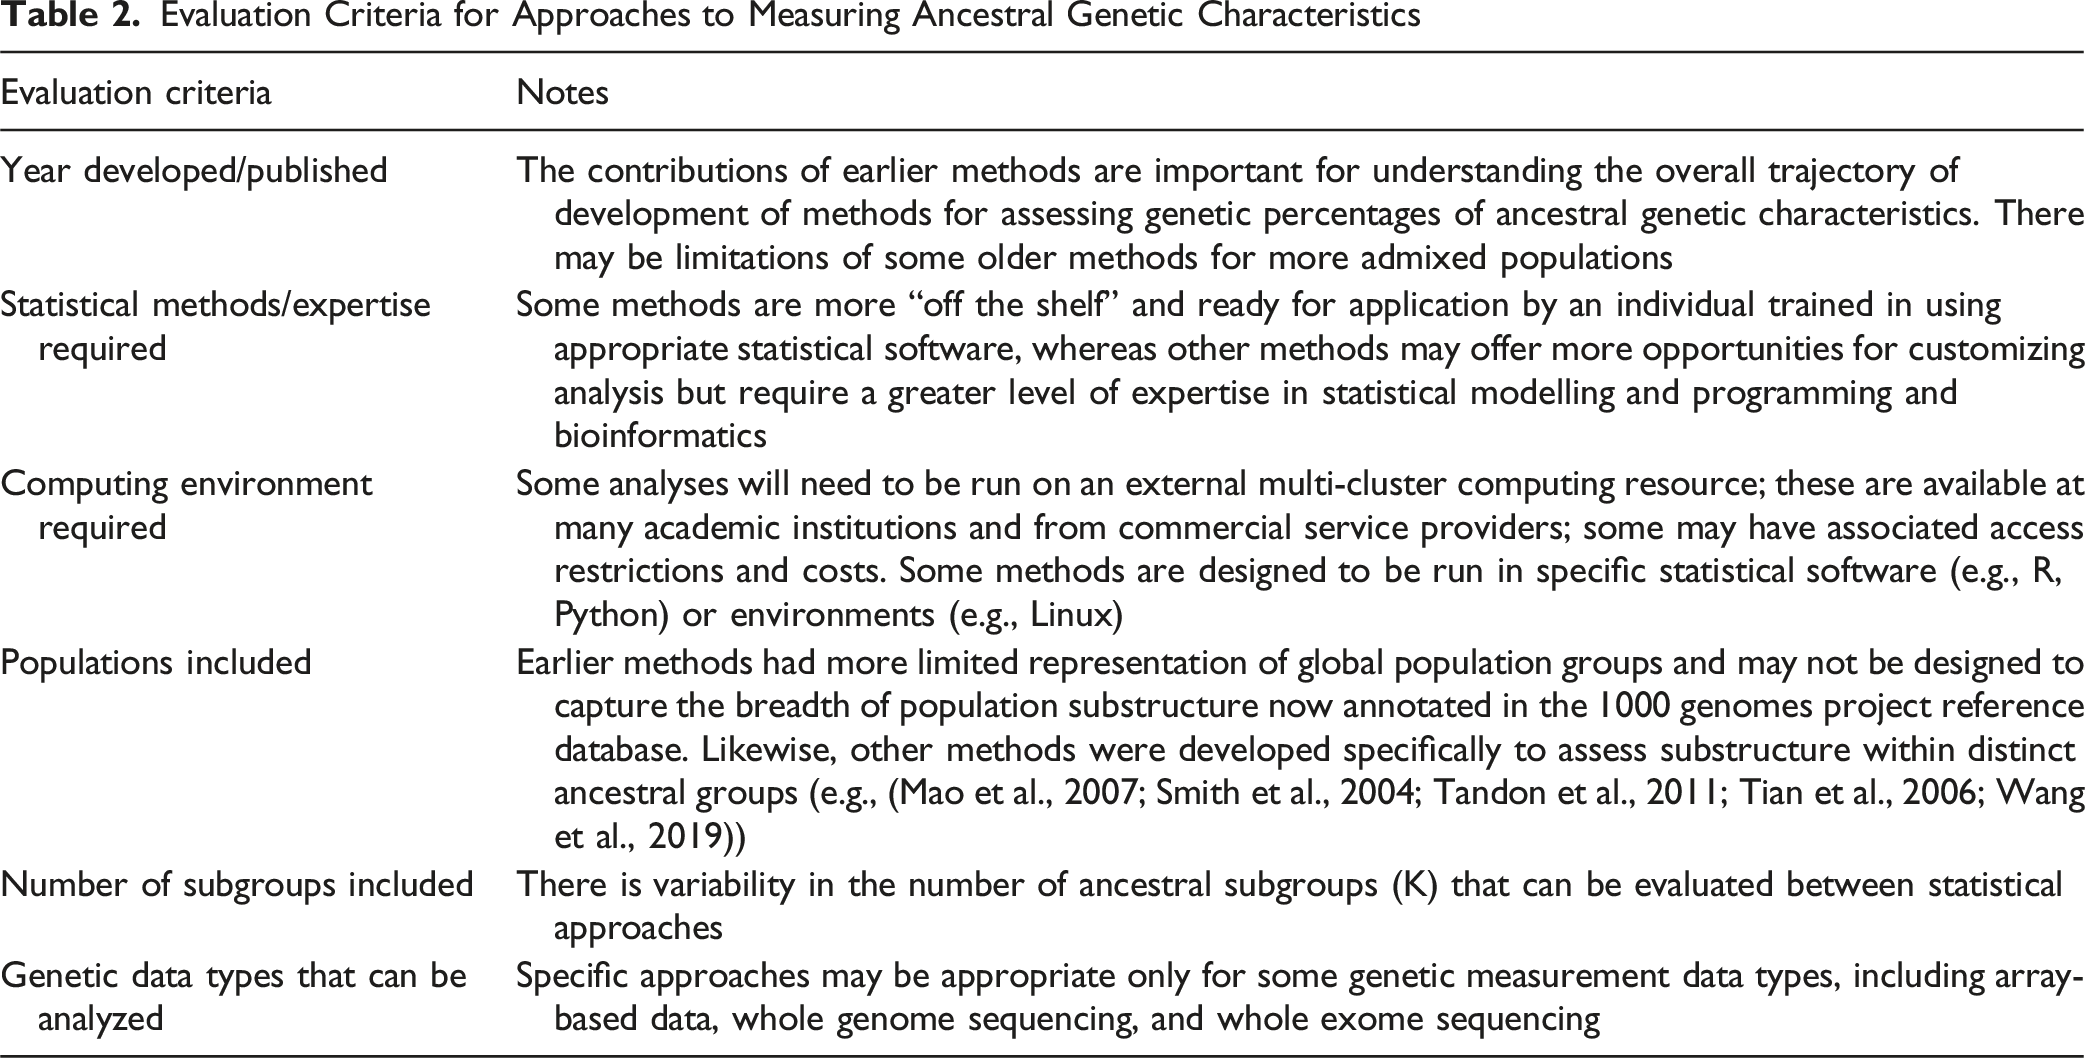
Evaluation Criteria for Approaches to Measuring Ancestral Genetic Characteristics
Reference Populations
Initial methods for characterization of ancestry were anchored to databases of the genetic characteristics of discrete ancestral groups to serve as a reference for an individual’s measured genetic characteristics. A significant milestone for methods to quantify ancestry was the international HapMap consortium (International HapMap, 2003), which was a global partnership of researchers that defined reference genetic information for populations who originated from Europe (Utah), Asia (Han Chinese, Japanese), and Africa (Yoruban Nigerian). While the initial HapMap reference data presented a significant methodological advance for using genetic data and assessing disease risk, it remained somewhat limited in its global geographic representation. Ultimately, a third phase of HapMap includes 11 subgroups with a greater representation of geographic origins of human populations.
Building on the HapMap project, the 1000 Genomes Project (1 kg) (Genomes Project et al., 2015) contains 26 reference populations from 2,054 (Figure 2) and is typically used as the current gold standard for mapping global population substructure. These data are widely available to researchers with appropriate training and resources to ensure data security through controlled access agreements. The overall impact of these tools is that individual ancestry can be measured and operationalized as a quantitative variable for statistical modelling and evaluation of genetic causal mechanisms for health outcomes. The Area of Each Pie is Proportional to the Number of Variants Within a Population. Pies are Divided Into Four Slices, Representing Variants Private to a Population (Darker Color Unique to Population), Private to a Continental Area (Lighter Color Shared Across Continental Group), Shared Across Continental Areas (Light Grey), and Shared Across all Continents (Dark Grey). Dashed Lines Indicate Populations Sampled Outside of Their Ancestral Continental Region. Adapted From 1000 Genomes Project Consortium, 2015. The Area of Each Pie is Proportional to the Number of Variants Within a Population. Pies are Divided Into Four Slices, Representing Variants Private to a Population (Darker Color Unique to Population), Private to a Continental Area (Lighter Color Shared Across Continental Group), Shared Across Continental Areas (Light Grey), and Shared Across All Continents (Dark Grey). Dashed Lines Indicate Populations Sampled Outside of Their Ancestral Continental Region. ACB – African Caribbean in Barbados; ASW – African Ancestry in Southwest USA; BEB – Bengali in Bangladesh; CDX – Chinese Dai in Xishuangbanna, China; CEU – Utah Residents (CEPH) With Northern and Western European Ancestry; CHB – Han Chinese in Beijing, China; CHS – Southern Han Chinese; CLM – Colombian in Medellin, Colombia; ESN – Esan in Nigeria; FIN – Finnish in Finland; GBR – British in England and Scotland; GIH – Gujarati Indians in Houston, Texas, USA; GWD – Gambian in Western Division – Mandinka; IBS – Iberian Populations in Spain; ITU – Indian Telugu in the UK; JPT – Japanese in Tokyo, Japan; KHV – Kinh in Ho Chi Minh City, Vietnam; LWK – Luhya in Webuye, Kenya; MSL – Mende in Sierra Leone; MXL – Mexican Ancestry in Los Angeles, California, USA; PEL – Peruvian in Lima, Peru; PJL – Punjabi in Lahore, Pakistan; PUR – Puerto Rican in Puerto Rico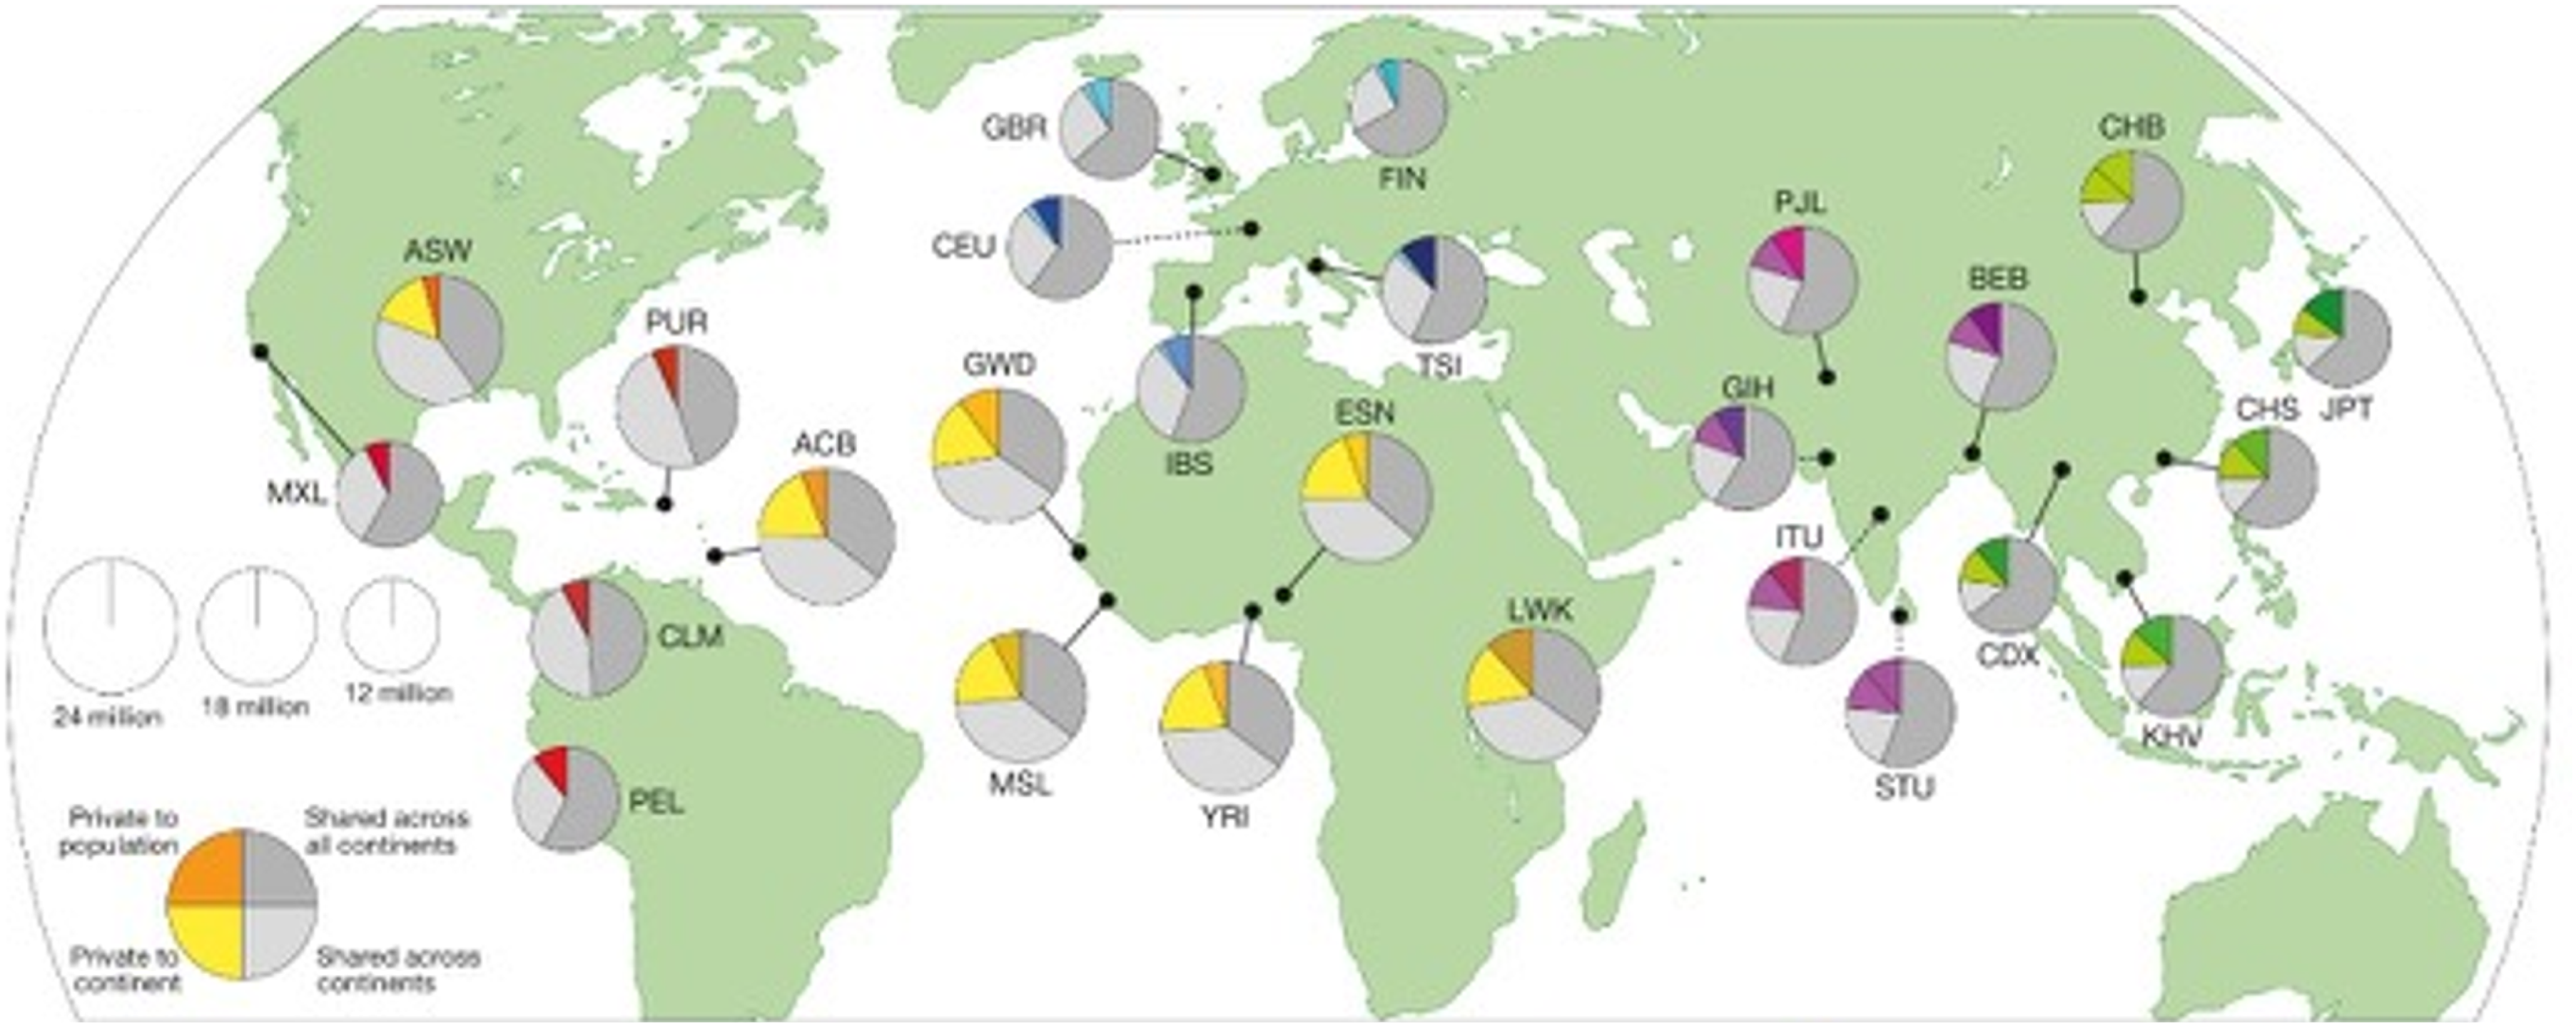
Methods for Analysis of Ancestral Genetic Characteristics
There are many criteria by which evaluation of potential statistical approaches to define genetic admixture might be evaluated (Table 2). Decisions about which tool to select will depend on the population of interest, research question, expertise of the research team, access to resources, and a tradeoff between generalizability and specificity of the findings. Several tools have been developed that specifically look at population substructure within distinct ancestral groups, including Latin/Hispanic, Asian, and African. (Ding et al., 2000; Mao et al., 2007; Mörseburg et al., 2016; Smith et al., 2004; Tandon et al., 2011; Tian et al., 2006; Wang et al., 2019) This is somewhat conflated with the constructs of race and ethnicity given that individuals in these studies are determined to be eligible based on self-report, and membership in an ancestral group can’t be defined until the participant’s genetic data have been measured. This differentiation between individual or social-level identification of race and ethnicity from genetic ancestry is one of the essential strengths of using AIMs to control for population substructure and prevent confounding by ancestry. Including population substructure as a covariate creates the opportunity to look at the potential impacts of social determinants (i.e., race and racism) on health outcomes, distinct from genetic characteristics associated with geographic ancestry.
STRUCTURE was one of the first published methods to analyze percentages of ancestral genetic characteristics. This approach applies models based on clustering probability and prior admixture distributions to determine the likelihood that a given allele is present at a given locus. (Pritchard et al., 2000) This method allows for deriving K number of ancestral groups, which can be pre-specified or unknown. The result is K groups with shared genetic characteristics, which can be evaluated within an independent sample or referenced to annotated ancestral groups to determine the presence and proportion of ancestry for an individual (Figure 3). The data can also be aggregated to show a summation of ancestral characteristics for a subgroup or study sample. Building on STRUCTURE, a current widely used approach is ADMIXTURE. (Alexander et al., 2009) Mathematical modifications integrated into ADMIXTURE include cross-validation to estimate the value of K rather than calculating model estimates for each value of K, which results in determining the number of K with the best predictive value and, importantly, notably faster computational speeds. ADMIXTURE has nearly 4,000 citations, evidence of its wide uptake and broad utilization. Both STRUCTURE and ADMIXTURE are publicly available tools (Alexander et al., 2009; Pritchard et al., 2000). Processing times vary depending on the number of genetic loci and number of individuals included in a dataset. Estimation of Ancestral Proportion in Clinical Trial Participants. Stacked Bars Show Estimated Ancestry Proportions for Each Individual (n = 41). ADMIXTURE Analysis was Performed Using Genotype Data Merged With HapMap 3 References Samples, With the Number of Ancestral Populations (K) Set to 3. Each bar Represents a Single Individual, and the Color Segments Within Each bar Correspond to the Proportion of Ancestry in Three Inferred Ancestry Clusters: African (AFR, Orange), East Asian (EAS, Light Blue) and European (CEU, Green). Estimation of Ancestral Proportion in Clinical Trial Participants. Stacked Show Estimated Ancestry Proportions for Each Individual (n = 41). ADMIXTURE Analysis was Performed Using Genotype Data Merged With HapMap 3 References Samples, With the Number of Ancestral Populations (K) Set to 3. Each bar Represents a Single Individual, and the Color Segments Within Each bar Correspond to the Proportion of Ancestry in Three Inferred Ancestry Clusters: African (AFR, Orange), East Asian (EAS, Light Blue) and European (CEU, Green)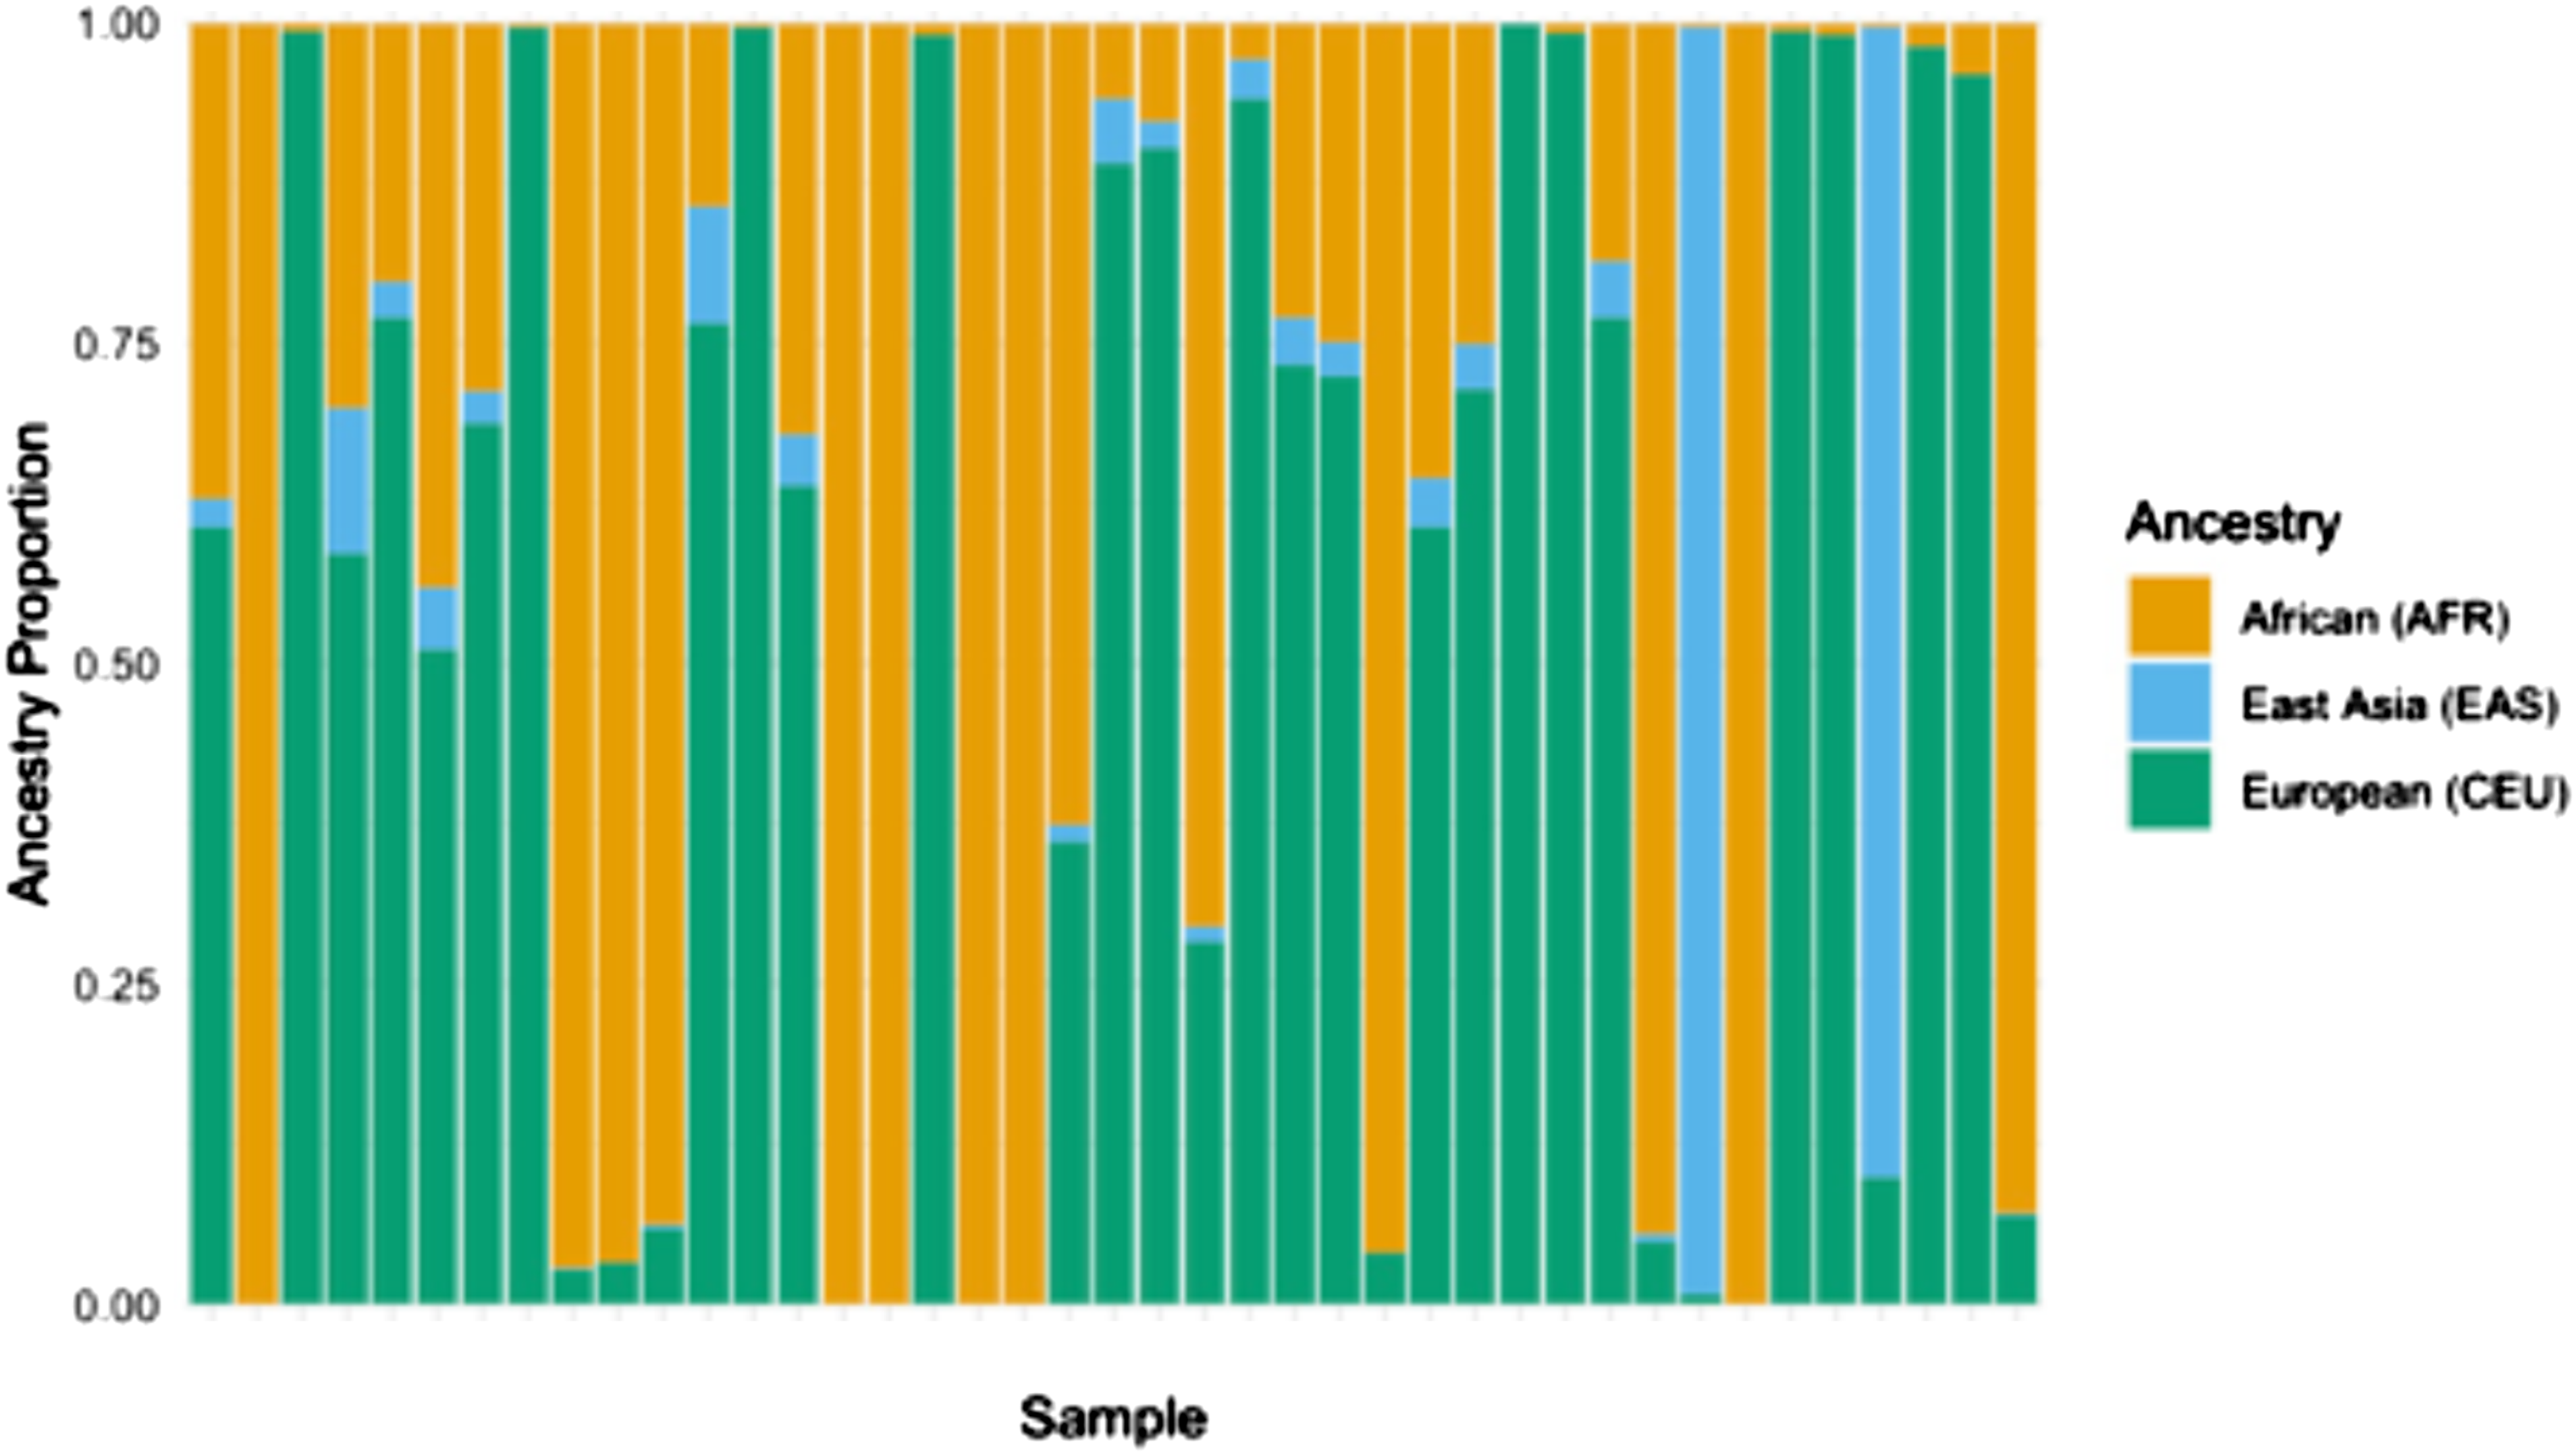
Another widely used approach for estimating genetic ancestry is Principal Component Analysis (PCA). PCA is a statistical technique that can reduce the dimensionality if genomic data by summarizing variation across the genome into principal components. These principal components represent an axis of genetic variation and often align with geographical ancestry allowing for researchers to detect population substructure without predefined labels. PCA is frequently used in GWAS to correct for ancestry related confounding and is considered a computationally efficient method for identifying major axes of genetic variation (Privé et al., 2020). Many commonly used statistical software programs have the capability of performing PCA using genomic datasets.
Both STRUCTURE and ADMIXTURE provide methods for understanding ancestry at a genome-wide level, providing estimates of global ancestral composition across an individual genome. In contrast, other statistical tools are focused on estimating ancestry on a local scale, meaning at a specific position (i.e., a large segment of DNA form a small region of a chromosome) within the genome. This allows for assessment of the ancestral group composition for a particular genetic region of interest and determination of the ancestral origin of each allele at a given locus. These methods were developed to more accurately characterize admixed populations including individuals who are typically categorized as Latin/Hispanic and African American/Black -- groups that may have Native American, African, and European ancestral origins. (Baran et al., 2012; Zakharia et al., 2009) These methods allow a more rigorous assessment of the likelihood that a given risk allele occurs in an individual, considering normal biological processes like recombination, genetic drift, and selection (Figure 4; Goli et al., 2024). The most common methods applied for inference of local ancestry is Local Ancestry in Mixed Populations (LAMP; Baran et al., 2012), which assesses individual SNPs for their reference population ancestral group prevalence and summarizes the most probable ancestral group across multiple SNPs within a specific region of the genome. Like the global ancestry tools described above, LAMP is also available in the public domain (Baran et al., 2012). Broad Global Origin Populations are Shown as Distinct Ancestors. New Variants can be the Result of Recombination, Genetic Drift, and Selection. Recent Ancestors Show More Recent and More Rapid Admixture in Specific Populations (e.g., Africans in America, Latin/Hispanic With Mapping of Distant and Recent Ancestral Groups Within Specific Regions of the Genome. Adapted From https://www.genome.gov/genetics-glossary/Local-Ancestry Broad Global Orgin Populations are Shown as Distinct Ancestors. New Variants can be the Result of Recombination, Genetic Drift, and Selection. Recent Ancestors Show More Recent and More Rapid Admixture in Specific Populations (e.g. Africans in America, Latin/Hispanic With Mapping of Distant and Recent Ancestral Groups Within Specific Regions of the Genome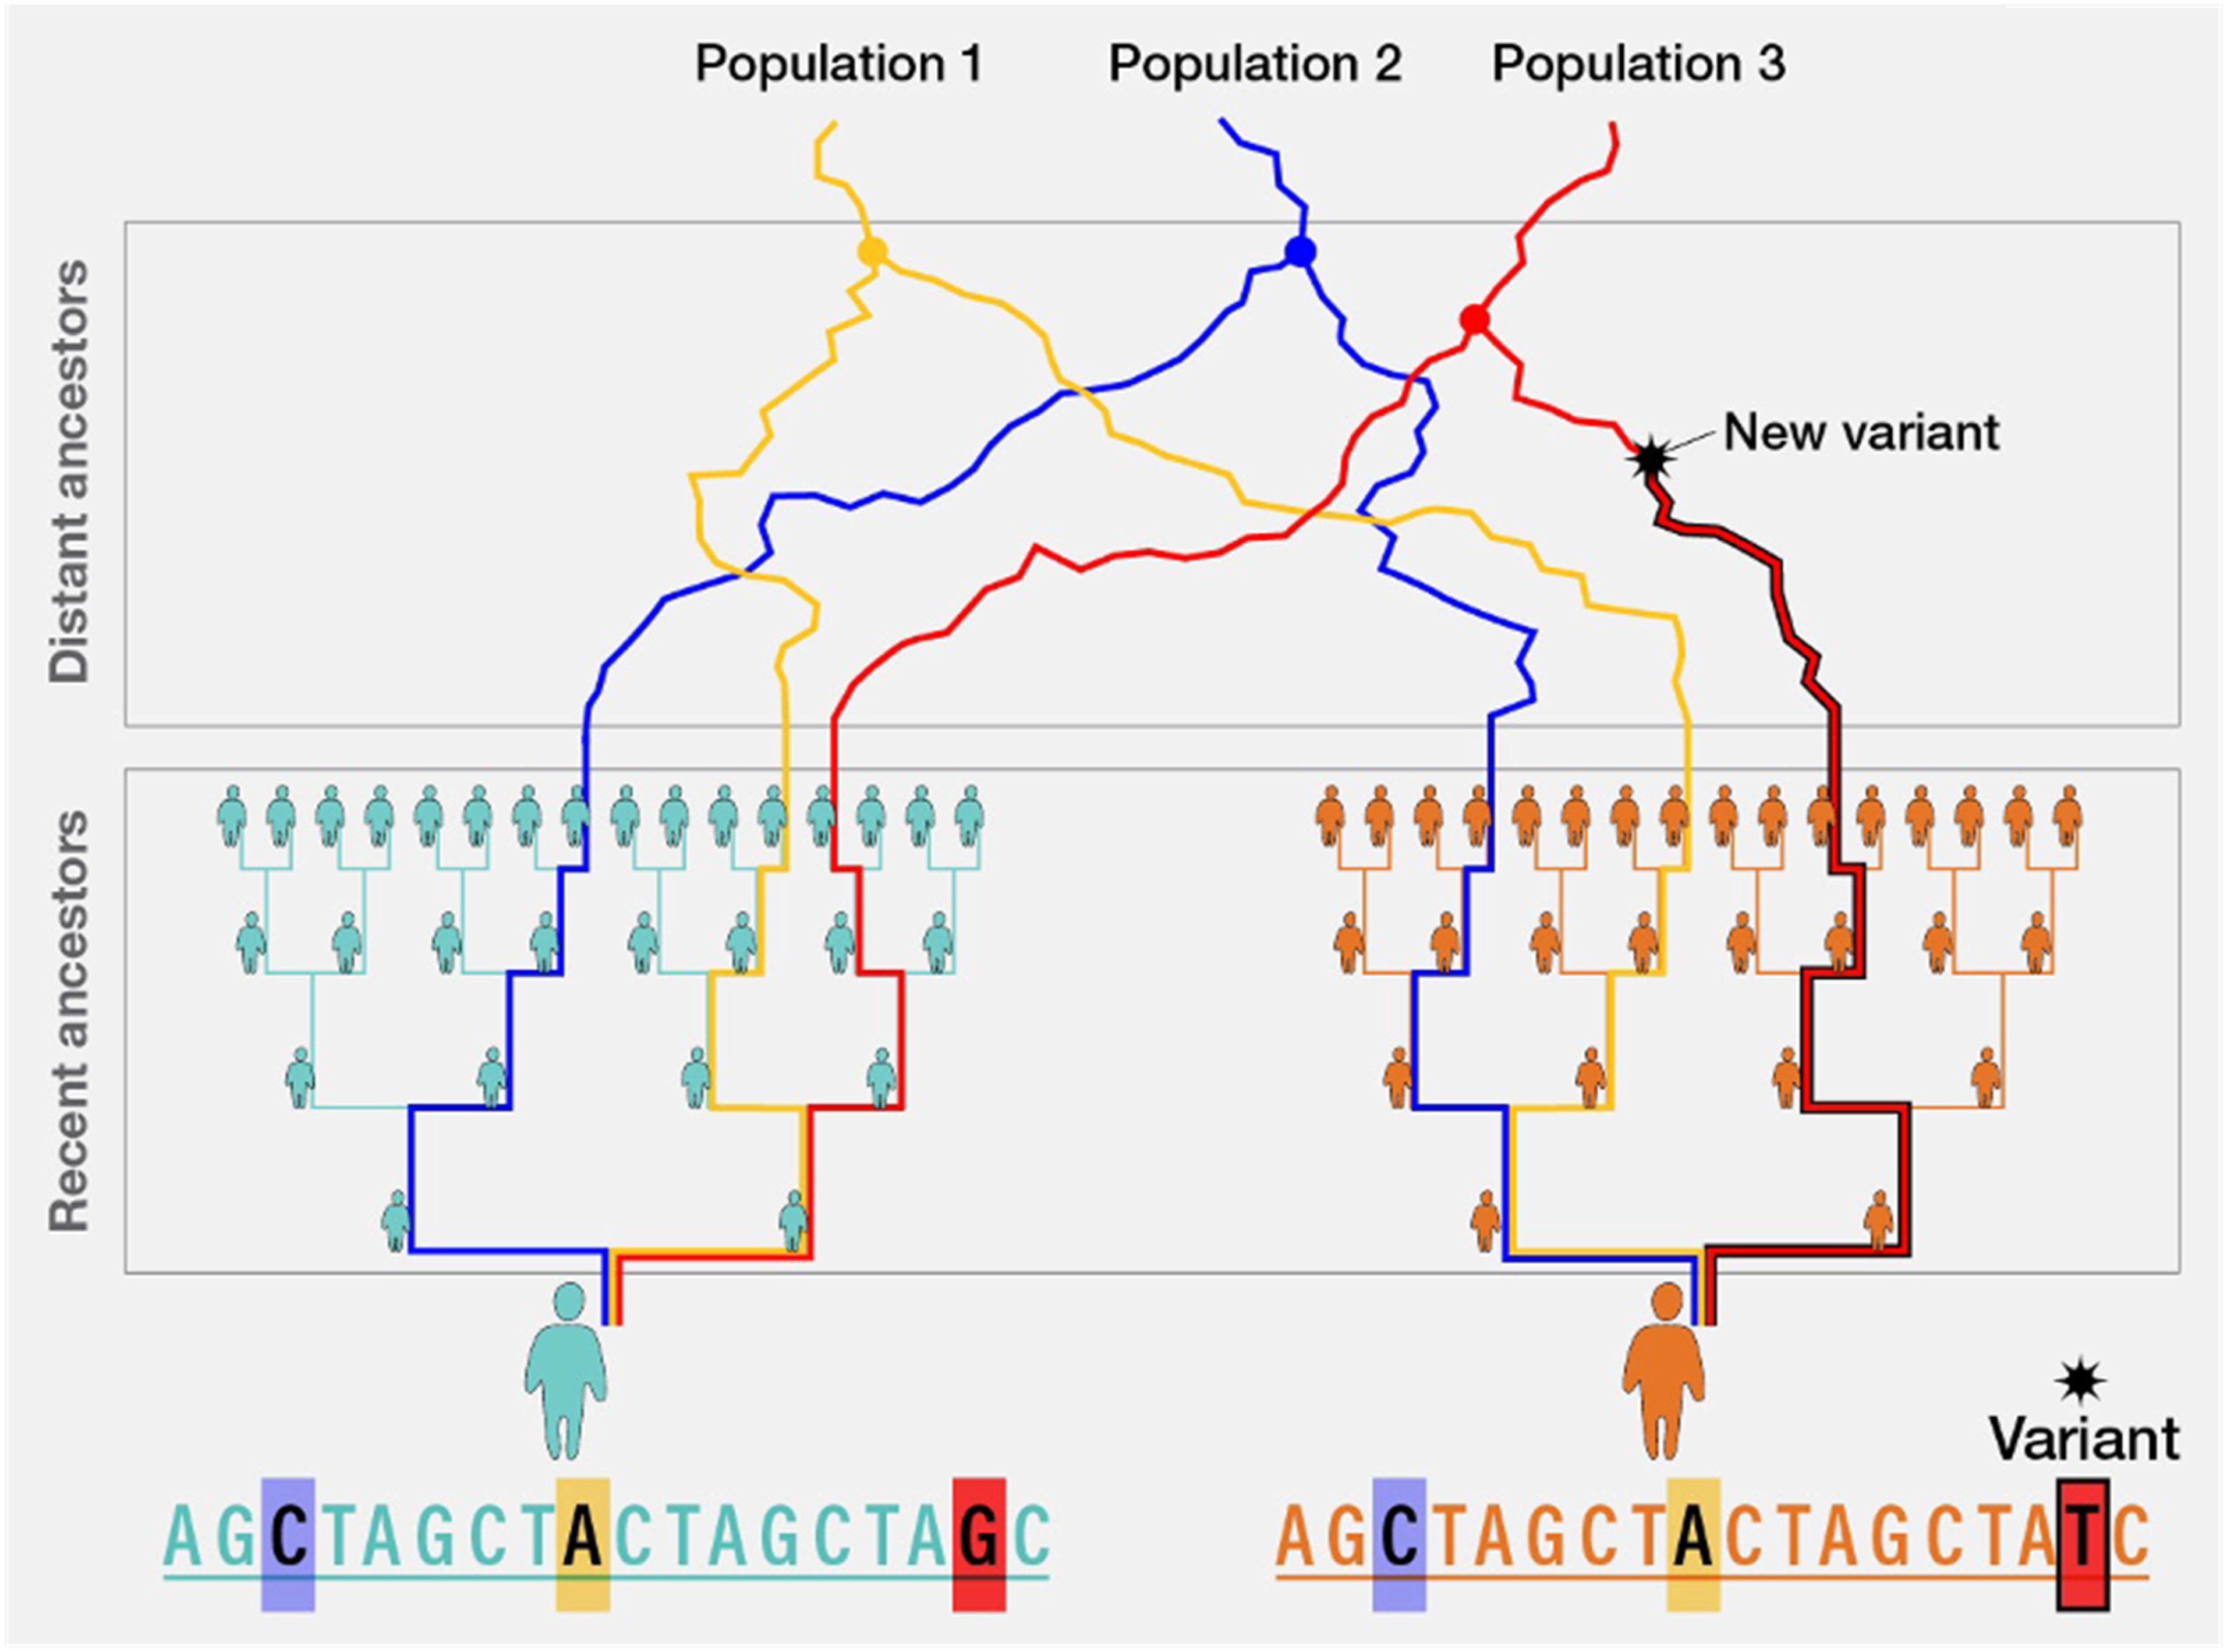
Discussion of Implications for Nurses and Researchers
Historically, health sciences research has often conflated constructs of ancestry versus race and ethnicity. However, scientific discoveries over the past several decades have provided an opportunity to differentiate these into distinct domains of risk with improved ability to measure the distinct contributions of genetic risk factors to health outcomes based on ancestral composition. By applying well-tested scientific theories and leveraging the rigorous methods described above, nurses who are engaged in research are positioned to conduct studies that have the potential to significantly improve our understanding of latent causal relationships that are masked when the constructs of ancestry and race and ethnicity are conflated. Defining population substructure with GWAs can decrease the likelihood of both false positive and false negative conclusions, inform interpretation of validation of research findings, about provide more accurate information about generalizability of findings across study populations. This has a direct impact on potential clinical implementation of genetic information to reach appropriate patient populations in order to optimize treatments and minimize potential harms.
Both genetic characteristics (ancestry) and race and ethnicity may be instrumental variables that represent more complex and nuanced exposures that impact health outcomes. This is evidenced by the principle of linkage disequilibrium in the context of genetic variables in which a relatively small number of genetic loci act as instrumental variables that represent the genetic characteristics of entire region of the genome. In terms of social exposures, race and ethnicity have been used as instrumental variables to estimate social experiences and opportunities in the absence of being able to measure these exposures at a more accurate and granular level. The ultimate goal should be to move beyond race and ethnicity through development of methods and tools that accurately capture the precise social exposures (e.g., microaggressions, perceived stress) that directly impact health outcomes on an individual rather than broadly aggregated but poorly refined group level.
One important caveat to the concept of reference populations is that historical human actions have driven the rate and directions of migration patterns. In some cases, groups of individuals have been relocated forcefully with corresponding cultural and social assimilation that may impact social identity, distinct from ancestry. These events have contributed to what is inherently the definition of genetic admixture and underlie the rationale for accurate assessment of the likelihood that genetic loci associated with disease outcomes will be present in an individual or group of individuals with shared ancestry. However, the naming of ancestral groups by global regions may erroneously include or exclude groups of individuals who were forcefully relocated. This current limitation is an important consideration for continued development of methods to control for the likelihood of prevalence of relevant genetic loci when evaluating overall genetic risk for health outcomes. For example, reference databases could subvert the issue of forced migration and related cultural assimilation by using a nomenclature structure that is based on genetic structure rather than global geographic region. This can be accomplished through agnostic statistical approaches that derive K groups based on shared genetic characteristics within a sample rather than referenced to geographically anchored prespecified groups. Alternatively, a repository of reference groups could be defined and named based on an arbitrary naming schema or one that uses genetic structural characteristics like haplotypes.
Nurses have historically approached health from a holistic perspective that includes information about the individual, the immediate and distal environments, and higher-level social factors. This framework necessitates consideration of individual-level factors including genetic characteristics and social identity and position. Increasingly, genetic information is being collected in research studies, both for immediate application to research questions and in biobanks for future applications. This facilitates collection of information to define genetic ancestry and population substructure through AIMs. The methods for generating these ancestry variables have been rigorously developed and tested and are highly accessible in the public domain. Current best practices include the 1 kg reference database and the ADMIXTURE and LAMP modeling approaches, although methods will inevitably continue to evolve over time.
Conclusions
When considering the etiology of complex diseases, it is important to apply rigorous data collection approaches for to measure complex variables that may be instrumental variables for multi-faceted exposures. The human genome project was an international collaborative that provided significant technological advancements, including the possibility for quantification of geographic ancestry of an individual, distinct from their self-reported or assigned race and ethnicity, through measurement of population substructure based on the principle of linkage disequilibrium. More recent methods expand on these discoveries by allowing for determination of ancestral origin of just a specific region of the genome, termed local ancestry. Genetic data are increasingly available from research studies and can be used in causal models to evaluate health outcomes and control for genetic ancestry and population substructure, distinct from social constructs that also impact health outcomes. This approach is precisely aligned with frameworks utilized by nurses who do research that include person, environment, and social-level contributors to health outcomes. This paper serves as a primer on applying these methods, including ancestry informative markers, reference populations, and statistical approaches, that nurses engaged in research may incorporate into their study design and implementation.
Footnotes
Ethical Considerations
The UCSF IRB approved all study procedures, and all participants provided informed consent.
Consent for Publication
All authors have reviewed and approved the manuscript.
Funding
The authors disclosed receipt of the following financial support for the research, authorship, and/or publication of this article: Dr. Flowers is supported by the National Institute for Diabetes, Digestive and Kidney Disease Grant Number K26DK137286. The PRYSMS study referenced in ![]() was supported by the National Center for Complementary and Alternative Medicine of the National Institutes of Health Grant Number R01AT004569.
was supported by the National Center for Complementary and Alternative Medicine of the National Institutes of Health Grant Number R01AT004569.
Declaration of conflicting interests
The authors declared no potential conflicts of interest with respect to the research, authorship, and/or publication of this article.
Data Availability Statement
No data are presented in this paper.