
Abstract
Integrating scrap rubber particles as fillers into polymer matrix composites offers a cost effective and environmentally sustainable pathway to manage tyre waste through the creation of value-added products. This research explores the low-velocity impact (LVI) response and compression after impact (CAI) properties of rubberised foam-core glass fibre-reinforced epoxy (GFRE) sandwich composites. Syntactic foam cores integrated with rubber particles were manufactured using vacuum-assisted resin transfer moulding (VARTM). The compression properties of rubberised foam core, vital for resisting impact damage during LVI, were examined. Results show more than 40% reduction in compression strength and modulus of the syntactic foam upon the inclusion of 33 wt.% rubber particles. The LVI response and residual compression properties of rubberised foam-core composites were also evaluated. Rubberised foam cores caused a marginal reduction in the peak impact force and led to approximately 60% reduction in the delamination area. The pre-impact compression strength was unaffected by rubber particles within the core as the GFRE face sheets carried most of the compression load. Post-impact compression strength was slightly higher in rubberised foam-core composites due to reduced delamination. Digital Image Correlation (DIC) analysis tracking of the strain evolution during CAI experiments revealed the stress-raising effect of the impact damaged region. This study showcases sustainable scrap tyre management through the inclusion of rubber particles into foam-core composites without substantially reducing in-plane compression properties before or after low-velocity impact.
Introduction
Foam-core sandwich composites find widespread use in engineering structures subjected to bending loads due to their high structural efficiency under such loading conditions.1,2 These composites have long been employed in the design of aircraft control surfaces, space exploration vehicles, and space infrastructure due to their favourable stiffness-to-weight ratio compared to traditional aerospace-grade aluminium or titanium alloys. 2 With decreasing procurement and maintenance costs of composite structures, in addition to their attractive mechanical, thermal, and acoustic properties, and design flexibility, foam-core sandwich composites are increasingly replacing conventional materials like concrete, metallic alloys, and wood in the automotive, rail and building and construction industries.
In designing sandwich composites for both primary and secondary loaded structures, syntactic polymer foams have emerged as preferred core materials due to their high specific bending stiffness and shear properties. These foam materials consist of lightweight particulate fillers such as hollow glass microspheres (HGM) embedded in a polymer matrix.3,4 For such foam core materials, thermosetting resins are commonly chosen due to their low viscosity and ease of processing at ambient temperatures. Despite their advantageous mechanical properties, the inherent brittleness of thermosetting polymer matrix syntactic foams has limited their application in impact-prone structures. The low fracture toughness of syntactic foam is attributed to its highly cross-linked polymer structure.5,6 Impact damage from wind-blown debris, hail, accidental contact or collisions and tool drops poses a significant threat to the integrity of brittle foam-core sandwich composite structures.7,8 The low-fracture toughness syntactic foam-core materials are also susceptible to failure via crushing or shear deformation.
Efforts to address the low fracture toughness of syntactic foam-core materials have included the incorporation of nanostructured fillers, such as 2D nanolayered materials, 1D carbon nanotubes and 0D elastomeric particles.9–11 However, enhanced fracture toughness often comes at the expense of compression, tensile and shear properties due to agglomeration of the nano-sized fillers, particularly at high filler concentrations. 5 Consequently, the focus has shifted towards integrating micro-sized elastomeric fillers into thermosetting matrix syntactic foam materials. 12 Studies have shown that non-porous elastomeric fillers can significantly enhance fracture toughness in thermosetting polymers.13–16 Bagheri et al. 14 reported several fracture toughening mechanisms including crack deflection and bridging resulting in substantial fracture toughness improvements (240%) upon the inclusion of rubber particles into epoxy. Chandan et al. 17 reported approximately two-fold improvement in the Mode I fracture toughness of the epoxy upon the integration of rubber particles at a concentration of 30 wt.%. While the integration of rubber particles can improve the fracture toughness, challenges like weak interfacial bonding, stress-raising effects and dissimilar elastic moduli of constituents can reduce the quasi-static mechanical properties.16,18
Enhancing filler-matrix interfacial bonding through surface chemical functionalisation, albeit costly and labour-intensive, can improve the overall performance of the rubberised foam. Fuhrmann and Karger-Kocsis 19 investigated the inclusion of methacrylic acid-grafted elastomeric particulates (MA-g-EP) into polyamide-6, resulting in improved tensile strength (16%) and fracture strength (40%), along with reduced ductility (60%). In epoxy matrices, the addition of MA-g-EP increased the impact toughness, but at the expense of stiffness. Well-dispersed elastomers with suitable particle sizes promote plastic deformation ahead of the crack tip, efficiently absorbing impact energy through mechanisms like matrix shear yielding, micro-cracking, crack deflection, crack bifurcation, crack pinning, crack bridging, interfacial debonding of the elastomeric particles or multi-level fracture paths.13,20,21 However, beyond certain rubber concentrations, the toughening efficiency decreases due to particle agglomeration and phase inversion 22 thereby generally restricting the filler concentrations to values below 20 wt.%. 14
Li and Jones 23 developed a multi-phase syntactic foam core with fibre-reinforced polymer (FRP) face sheets incorporating styrene-butadiene rubber (SBR) latex-coated glass microspheres, nanoclays, and microfibers bound with an epoxy matrix. The elastomeric coating around the glass microspheres increased the impact tolerance of the resultant foam by up to three times and the impact damage initiation energy by 50%. Overall, the introduction of the elastomeric coating improved the compression-after-impact strength with a slight reduction in pre-impact compressive strength. Li and John 24 explored the toughening mechanisms of elastomeric particulates and glass microballoons, highlighting the roles of microballoons in energy absorption and elastomeric particles in enhancing fracture toughness. The hollow glass beads reduced the weight of the foam, provided a mechanism for absorbing impact energy through glass bead crushing and interfacial debonding while the elastomeric particulates enhanced fracture toughness, and the microfibres and nanoclays reinforced the matrix. 24
Previous studies have focused on the effect of elastomer phases on the impact response and compression-after-impact performance of foam-core sandwich composites, predominantly employing pristine rubber particles, with limited investigations into sustainable, unmodified, tyre-derived rubber particles as fillers or reinforcements. The tyre-derived rubber particles may exhibit contamination from foreign substances or altered chemistry, potentially resulting in diverse outcomes when compared to pristine rubber particles. This paper addresses this gap by investigating the effect of untreated scrap tyre rubber particles on the compression properties of syntactic foam. In this study, rubberised syntactic foam with up to 30 wt.% rubber particles was produced using vacuum-assisted resin transfer moulding (VARTM). The VARTM manufacturing process eliminated issues with elevated viscosity following the addition of rubber particles at high concentrations, which promotes void formation. The impact response and compression-after-impact behaviour of sandwich composites featuring glass fibre-reinforced epoxy (GFRE) face sheets and rubberised syntactic foam cores were explored. X-ray CT, ultrasonic C-scanning, and the scanning electron microscope (SEM) were employed for microscopic analysis of the composite damage. This study showcases the potential for developing syntactic foam products using recycled rubber particles, offering a more sustainable approach to managing end-of-life vehicle tyres and generating interest in repurposing scrap tyres into valuable engineered products.
Materials and methodology
Materials
Rubberised syntactic foam panels incorporated epoxy as a binder (West System 105/West System 206), rubber particles, and amorphous sodium borosilicate hollow glass microspheres (West System 410 Microlight™). The HGM particle size distribution followed a Gaussian (normal) distribution, revealing particle sizes between 10 and 175 µm, with an average diameter of 32 µm. The HGM particles had a bulk density of 70 kg/m³ and were supplied by ATL Composites, Australia, under license from Gougeon Brothers, Inc., United States. The plain-woven glass fabric had an aerial weight of 185 gsm, a modulus of elasticity of 72 GPa and tensile strength of 3400 MPa and was supplied by Colan, Australia. The glass fibres were combined with the epoxy resin to fabricate the GFRE laminates with a [0/90]12 lay-up configuration. The 0/90 lay-up was selected to balance in-plane (tensile and compressive) and out-of-plane (interlaminar shear) properties, making it suitable for evaluating the overall performance of the laminate under post-impact compression loading. This lay-up configuration deviates from industry guidelines, which recommend aligning at least 10% of the fibres along all four principal directions. However, it is important to note that the primary goal of this work was to gain an improved understanding of the post-impact compression performance of rubberised foam-core sandwich composites, with the composite skin lay-up being a secondary consideration. The impact response and compression-after-impact performance of rubberised foam-core sandwich composites were benchmarked against a control composite incorporating unmodified syntactic foam.
The scrap tyre-derived rubber particles (density 920 kg/m3) were supplied by TyreCycle, Australia. As-received rubber particles had a granulometric size range of 10∼1000 µm. The rubber particles were separated into different granulometric sizes using the RETSCH (AS 300) vibratory sieve shaker according to ASTM C136-19. 25 The rubber particles measuring 250–425 µm were selected for integration into the syntactic foam. Our previous research 26 determined that foam incorporating rubber particles measuring 250–425 µm yielded the highest shear and compression properties when compared to rubberised foam with smaller rubber particles (<250 µm) or larger rubber particles (>425 µm). Further, rubber particles measuring 250–425 µm were the most abundant of all four distinct granulometric size ranges. Isopropyl alcohol was used for cleaning the rubber particles with the solvent subsequently eliminated by drying the washed particles at 50°C for 12 h.
Syntactic foam manufacturing
The rubberised syntactic foam was produced following the methodology already described in our previous publication.
27
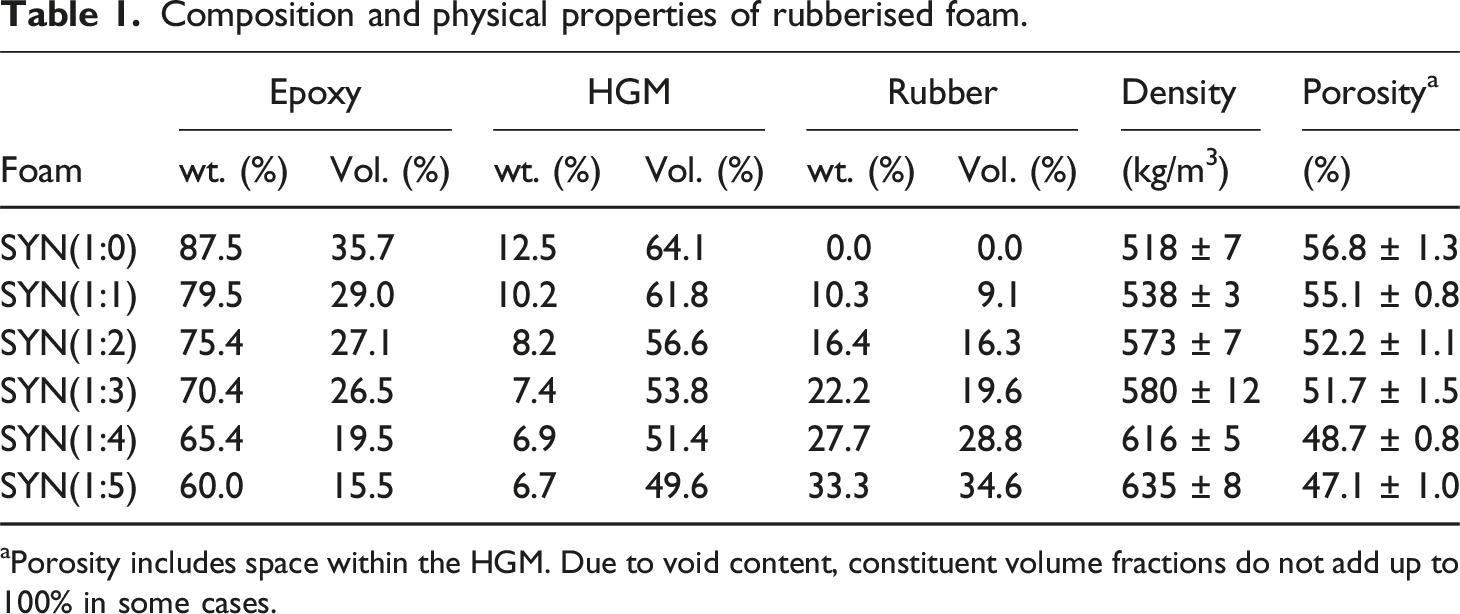
An IKA® Eurostar Power digital laboratory mechanical stirrer was used to uniformly blend the rubber and HGM particles. The rubber/HGM powder blend was dry mixed for 5 min at 200 r/min. The blended rubber/HGM powder was then transferred to a 450 × 150 × 6.5 mm aluminium mould. The blended rubber/HGM powder was covered by a release film and steel caul plate before the lay-up was hermetically sealed under vacuum. The VARTM manufacturing process was used to impregnate the rubber/HGM powder with epoxy. The foam panel was cured at 23°C, under vacuum pressure (1 atm) over 24 h. Subsequently, the rubberised foam was post-cured for 8 h at 60°C. The syntactic foam manufacturing process is illustrated in Figure 1. The rubberised foam is identified as SYN(n:m), where n:m is the HGM: rubber weight ratio as presented in Table 1. VARTM syntactic foam manufacturing process showing the HGM/rubber blending and resin infusion stages. Composition and physical properties of rubberised foam. aPorosity includes space within the HGM. Due to void content, constituent volume fractions do not add up to 100% in some cases.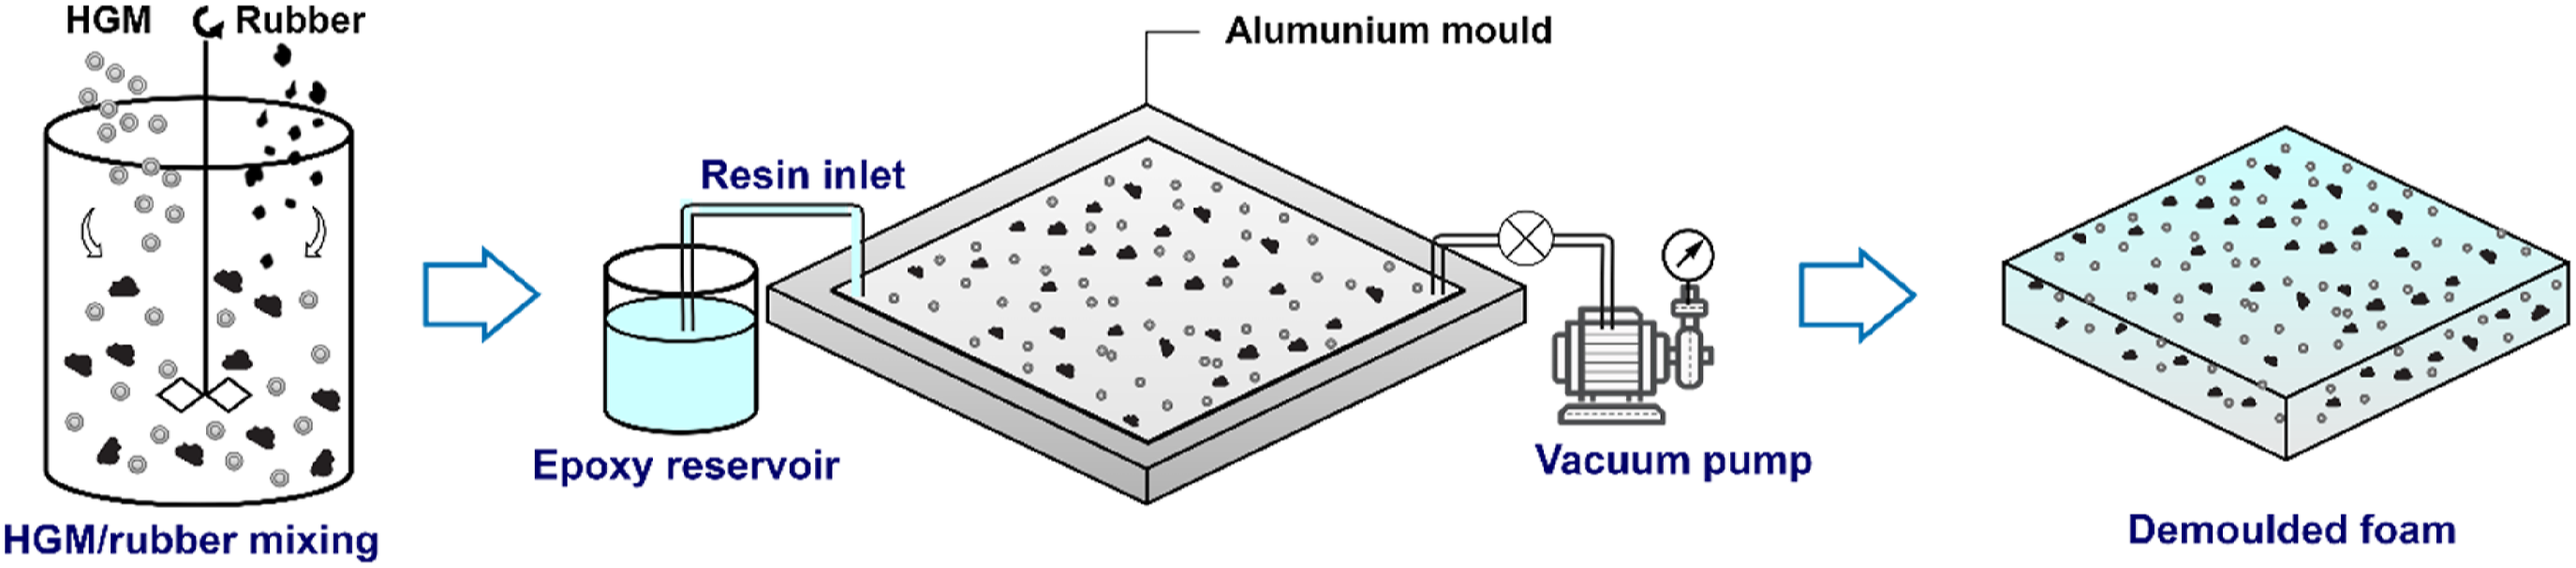
Microstructural characterisation of syntactic foam
Foam specimens were potted in cold-cure resin with the potted specimens then polished to a 1 μm roughness using diamond paste on a Metkon Forcipol 2V machine. Surface images were acquired using the Leica DM-LI HC optical microscope to estimate the HGM volume fraction. The FEI Quanta 200 SEM was used for microstructural characterisation. The SEM specimens were iridium sputter-coated using a sputter coater (Leica EM ACE600) to enhance the image quality. The specimens were mounted onto a holder using a conductive carbon adhesive to preclude charging.
The General Electric Phoenix v|tome|xs instrument operated in the micro mode was used for X-ray CT characterisation of the foam. The X-ray CT images were analysed to elucidate the foam’s microstructure and estimate the void content. The acquisition parameters were set at 80 kV and 350 μA, and a voxel size of 41 μm. 2D images randomly extracted from the representative 3D volume of the test specimen were analysed. The VolMaxStudio 3.0 Program was used to estimate the void content and volume fraction of rubber particles. The volume fraction of epoxy was estimated via the Rule of Mixtures (RoM). The foam porosity, which included the manufacturing voids and the space inside HGM particles, was calculated according to equation (1)
28
:
Compression properties of syntactic foam
Foam specimens (20 × 20 × 5 mm) were subjected to compression loading at a crosshead speed of 1 mm/min using a 50 kN Instron machine according to the ASTM D1621 guidelines. 29 The test was stopped when the testing machine reached its loading capacity. Five repeat tests were performed for each foam configuration. The average compression properties, along with their corresponding standard deviation values, were calculated and reported.
Fabrication of foam-core sandwich composites
Foam panels were ground down to ∼5 mm in thickness using a Herless TFY-618 precision surface grinder. Twelve-ply plain woven glass fabrics were placed on both sides of the foam core. The composite lay-up was impregnated with liquid epoxy resin via the VARTM manufacturing process. The resulting composite was cured at room temperature (23°C) under vacuum pressure over 24 h. Subsequently, the room temperature-cured foam-core composite was post-cured at 60°C for 8 h in an oven. The thickness of the post-cured composite was 8.9 ± 0.1 mm. The fibre volume fraction in epoxy matrix face sheets was 46% as determined via weight fraction to volume fraction conversions. LVI specimens (150 × 100 × 9 mm) machined using a water-lubricated diamond saw were dried using absorbent towels.
Low-velocity impact response of sandwich composites
The sandwich composite specimens were subjected to low-velocity impact using a drop tower in accordance with ASTM D7136. 30 Prior to testing, the specimens were scanned using the X-ray CT to ensure the absence of significant defects. During the impact test, each specimen was securely clamped onto an aluminium support plate adopting fixed-fixed boundary conditions as in ref. 31 A 15 mm-diameter hemispherical steel impact tup weighing approximately 2.8 kg was used for impact experiments. The impactor was dropped from a height of 1.48 m, generating an impact energy of 40 J. To prevent repeated impacts, the impactor was mechanically captured after the initial impact. During the test, with the aid of an in-built accelerometer attached to the support frame, the impact data including force and acceleration was measured as a function of time a frequency of 9.6 kHz using the CATMAN Easy® software.
Damage characterisation of impacted sandwich composites
Post-impact microstructural characterisation of the composites was conducted initially via nondestructive testing, in the form of ultrasonic C-scanning and X-ray CT. Ultrasonic testing was performed using a TecScan Systems automated ultrasonic immersion scanner, in which the specimens were immersed for non-destructive evaluation of the impact damage. The system employed a matched pair of 5 MHz Technisonic ISL-0504-HR 12.7 mm diameter transducers, having a spherically focused beam of 76 mm focal length. A lateral raster scan was then performed on the 150 × 100 mm X-Y plane in both directions adopting a scan resolution of 0.5 mm. Delamination damage was indicated by a loss of sound transmission through the specimen, and the 6 dB drop method (equivalent to a 50% signal loss assuming a planar defect with a consistent transition) was used for sizing purposes, to determine the edges of the defect. X-ray CT imaging of impact damaged specimens was performed using the same settings as those adopted in the pre-impact characterisation.
Impact-damaged specimens were then sectioned along the mid-point using a diamond saw to reveal a cross-section of the impact zone, as indicated by the shaded plane in Figure 2(a). To determine the delamination length at the core material/back face sheet interface, the crack tip along the length of the specimen was located using an optical microscope. Impact damage failure modes along the mid-section of the specimens were characterised via photography (Canon EOS 50D digital camera) and scanning electron microscopy (FEI Quanta 200). Schematic depicting (a) the impact region (red dotted circle) and the grey mid-section plane characterised for impact damage and (b) the compression-after-impact test rig.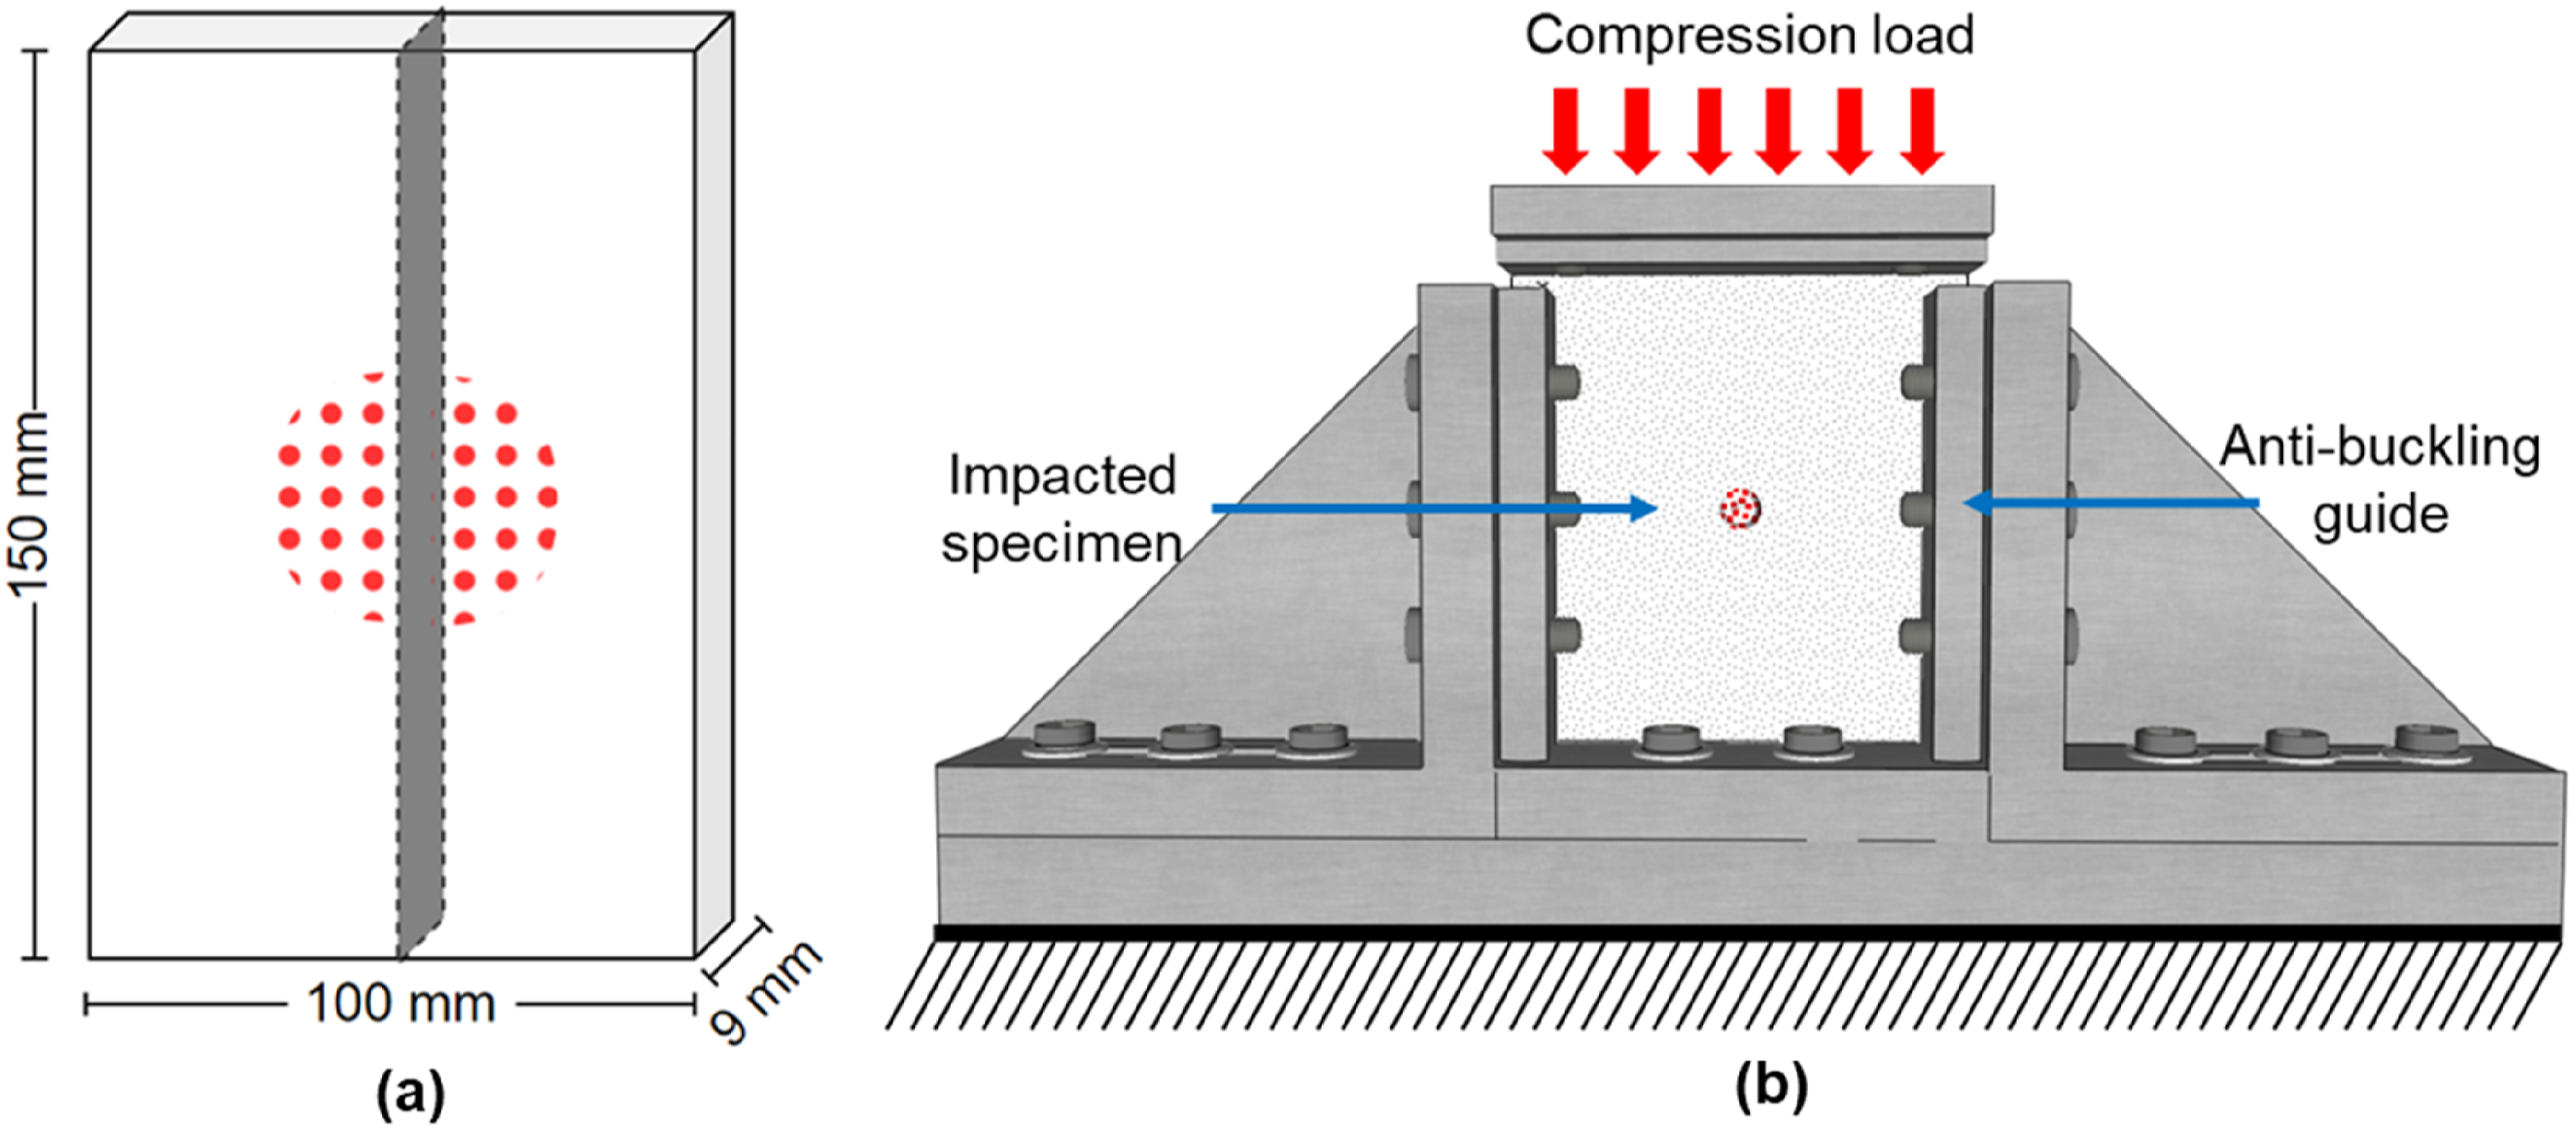
Compression after impact (CAI) properties of sandwich composites
Compression-after-impact properties were measured using an MTS 250 kN machine according to ASTM D7137 32 at a crosshead displacement of 1 mm/min. An anti-buckling fixture was used to prevent global buckling and promote pure compression failure as shown in Figure 2(b). A high-contrast random speckle pattern was applied to the surface of the composites prior to compression loading enabling the tracking of the global strain using Digital Image Correlation. The Canon EOS 50D digital camera was used for image acquisition during the experiment, with the data acquired at 1 fps using the Vello Shutterboss II timer. Displacement values extracted from acquired images were processed using MATLAB® to generate global strain values, following the methodology developed by Jones. 33 CAI properties were benchmarked against non-impacted composites. Three repeat experiments were conducted for both the undamaged and damaged composites.
Results and discussion
Microstructure and physical properties of syntactic foam
Figure 3 presents CT images of the rubberised syntactic foam showing uniformly dispersed rubber particles. Optical image analysis determined the size of rubber particles to be 255 ± 123 µm, while HGM measured 32 ± 23 µm. Since the densities of rubber and cured epoxy are significantly higher than that of HGM, the rubberised foam density increased with the rubber content. Specifically, incorporating 33 wt.% rubber particles, SYN(1:5), resulted in a 23% increase in foam density compared to the foam without rubber particles. The estimated porosity in SYN(1:5), including the space within the HGM particles, was approximately 47%. The porosity in SYN(1:5) was 18% lower than that determined for the baseline foam (57%) due to the relatively lower HGM volume fraction. The estimated void content of 0.5 vol% in VARTM-manufactured foam was notably lower than typical values of 2–10 vol% reported for stir-cast foam.
34
While the reduction in porosity may improve compression properties, functional properties such as acoustic insulation and vibration damping could be degraded.
22
2D CT-scan foam images of (a) SYN(1:0), (b) SYN(1:1), (c) SYN(1:2), (d) SYN(1:3), (e) SYN(1:4), and (f) SYN(1:5). Rubber particles are visible as black speckle, while the HGM and the matrix have similar contrast and are indistinguishable within the white regions. The scale bar in (a) applies to all other images (b)-(f).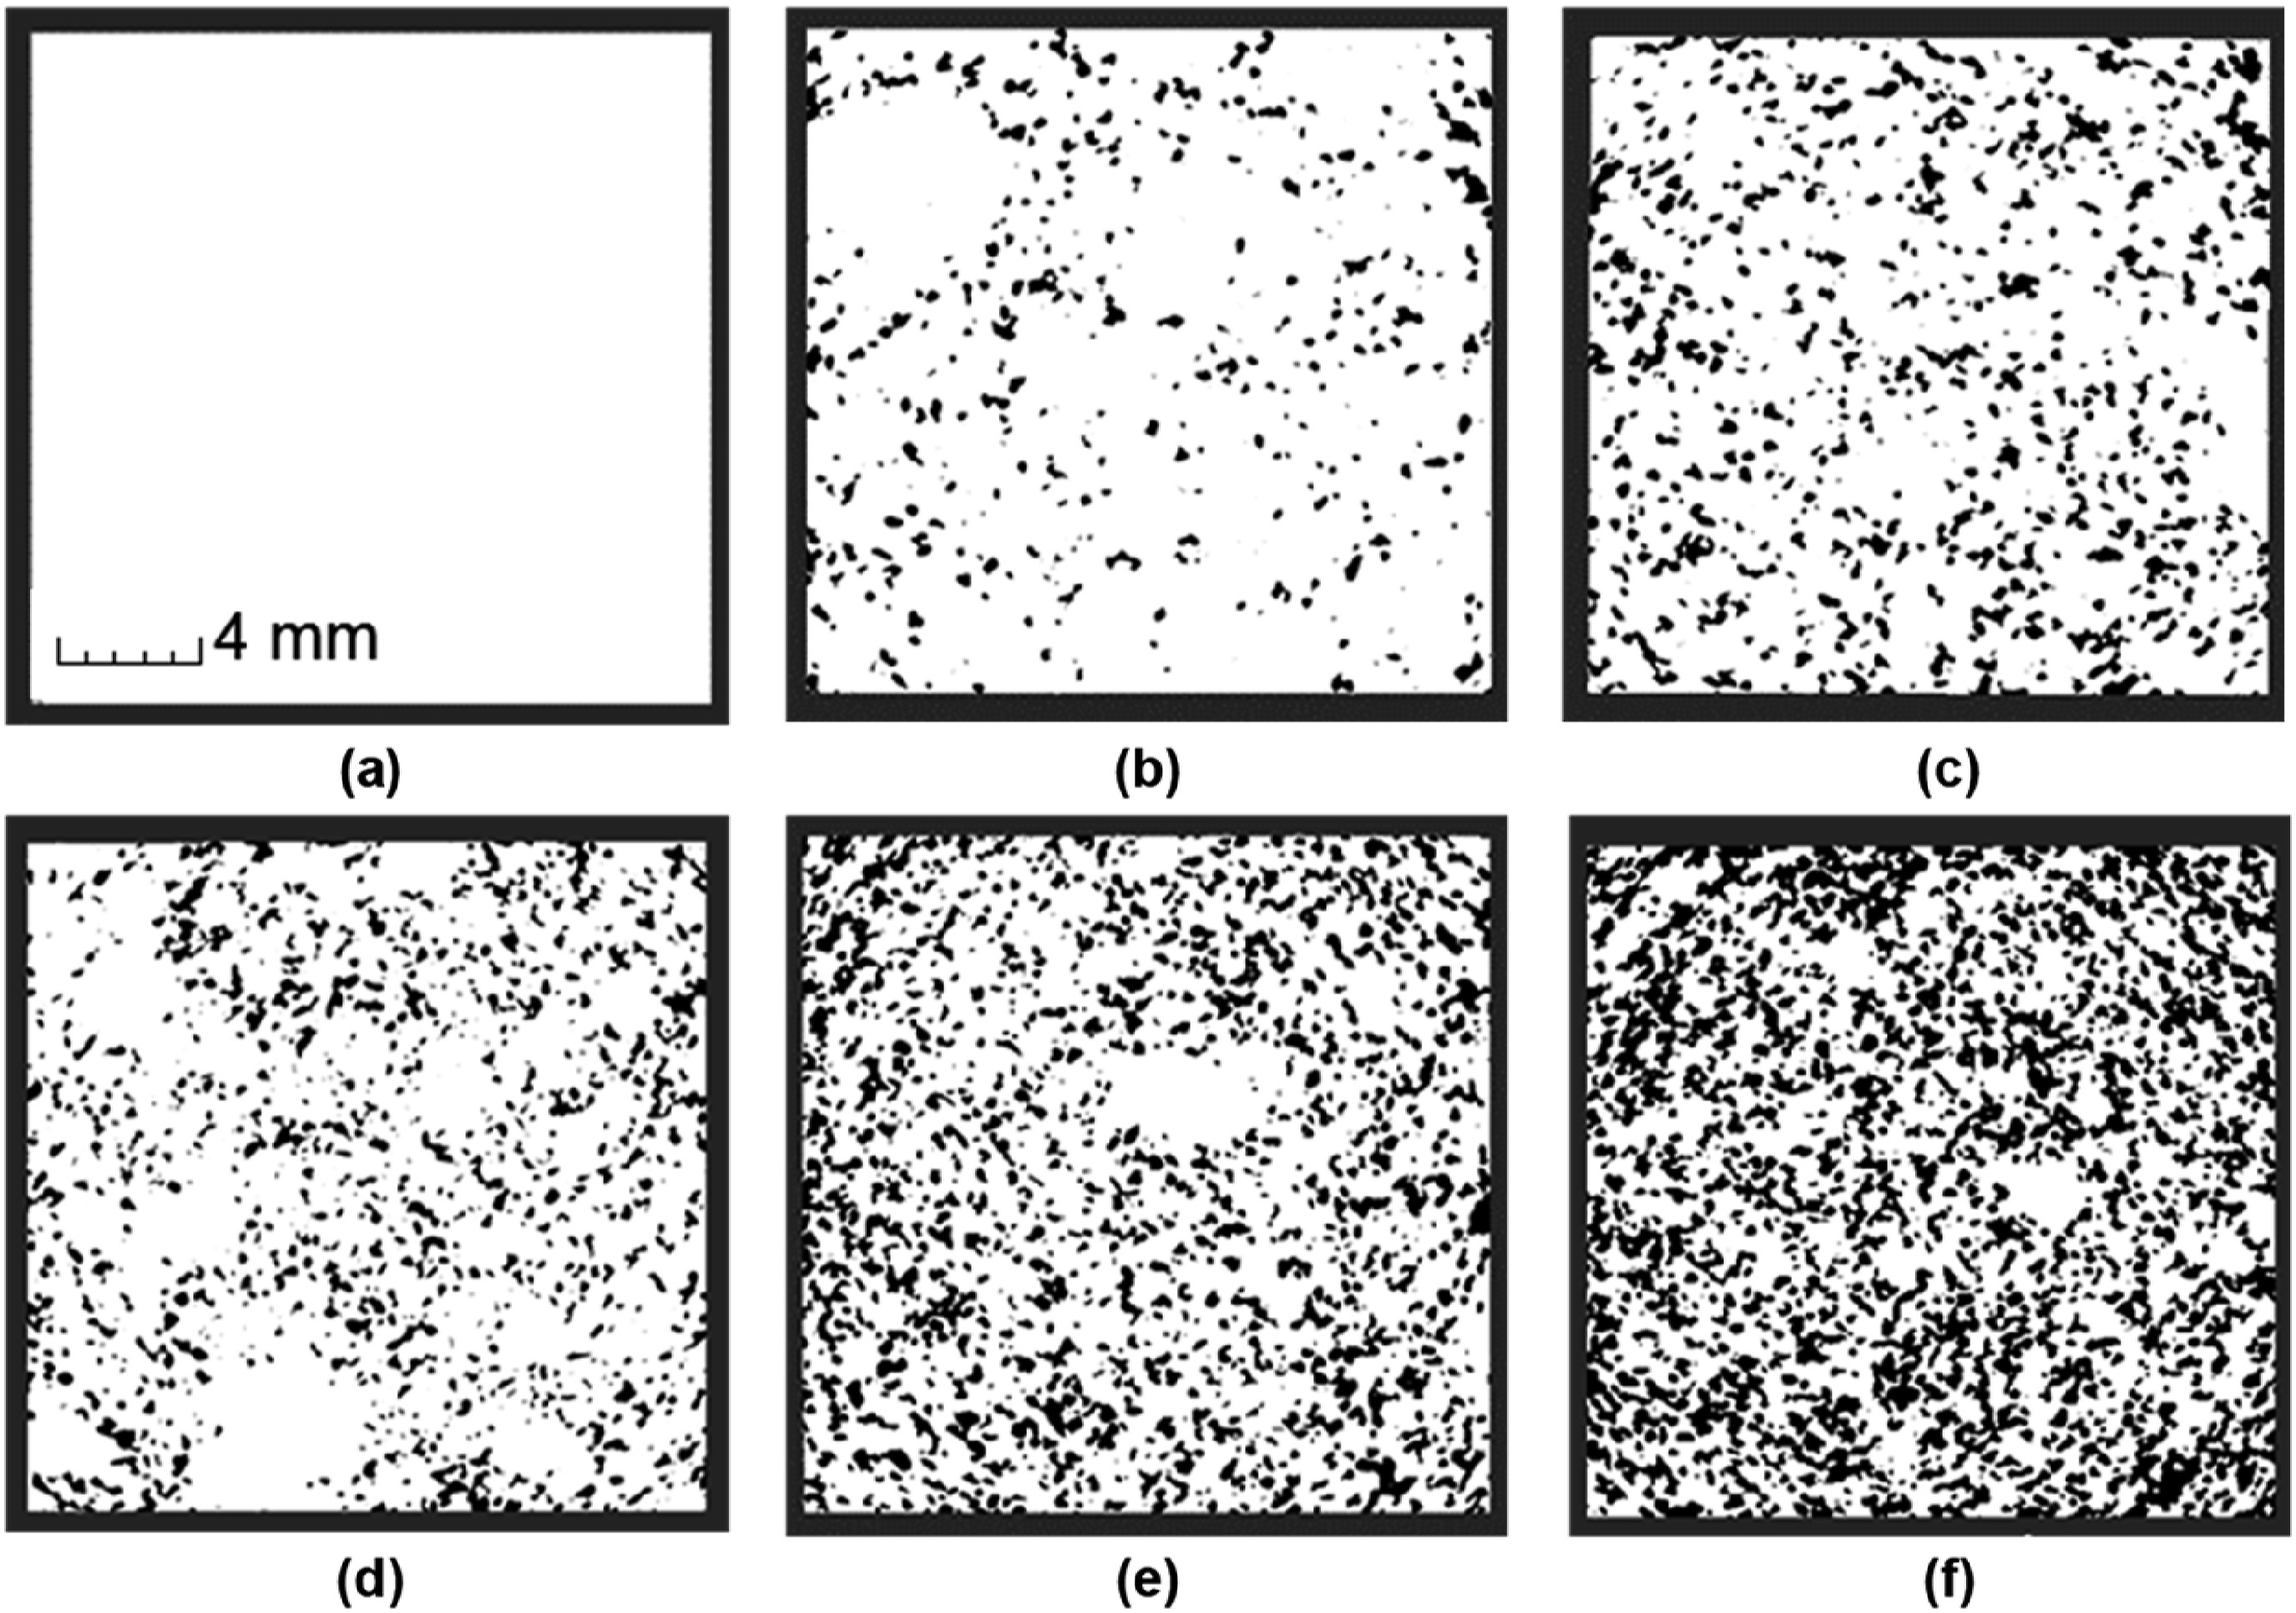
The SEM image of SYN(1:5), displayed in Figure 4, revealed disbonding at the rubber/epoxy interface due to the incompatibility between the rubber particles and the matrix.
15
The absence of a coupling agent on the rubber particle surface prevented strong chemical bonding with the matrix. Additionally, the difference in thermal expansion coefficients between the rubber particles and epoxy can contribute to interfacial debonding as the foam temperature is ramped down to room temperature post the curing cycle. Interfacial disbonding can increase stress concentration, leading to a degradation in foam strength and modulus of elasticity. On the other hand, HGM exhibited good bonding to the matrix as revealed in Figure 4. SEM image of SYN(1:5) foam showing irregular shaped rubber particles and circular HGM embedded in the epoxy matrix. The arrows indicate disbonds at the rubber/matrix interface. There were no discernible microcracks at HGM/matrix interfaces.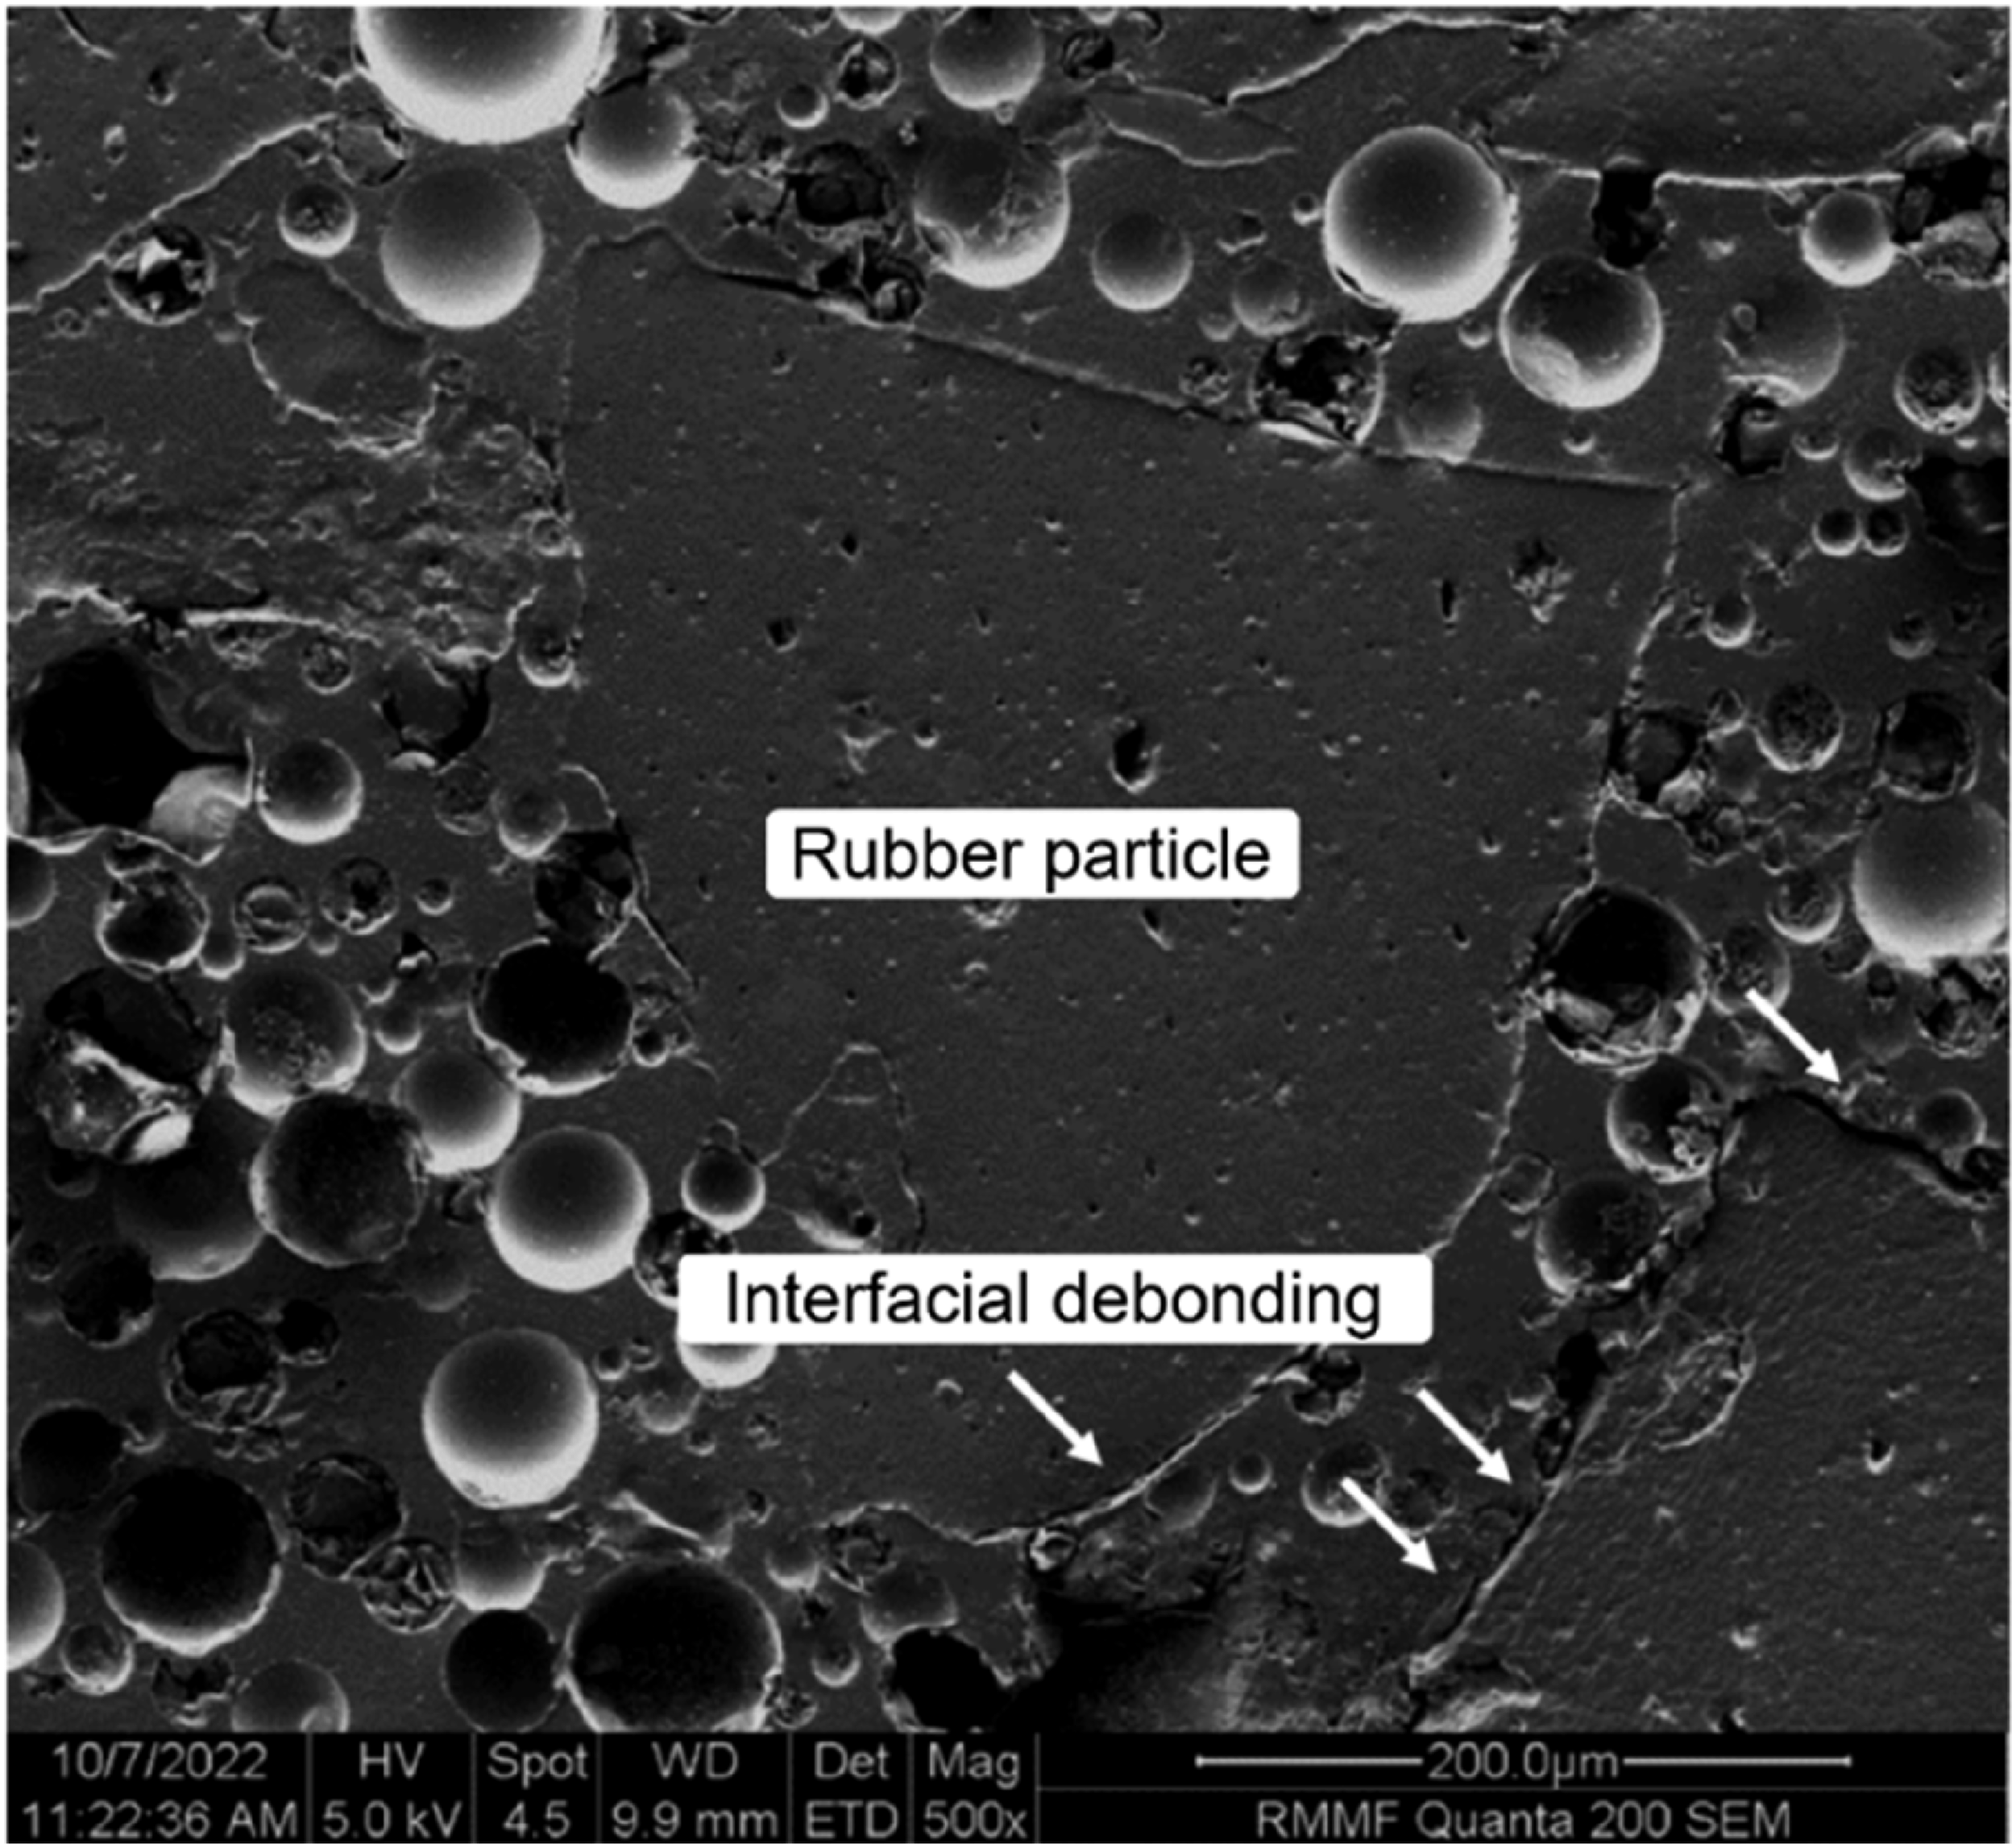
Compression properties of syntactic foam
The compression response of the rubberised foam was evaluated, and the outcomes are briefly discussed here. For a comprehensive discussion of the compression response of rubberised foam, the reader is referred to our previous publication focused on understanding the microstructure-mechanical property relationship of rubberised foam.
35
Figure 5(a) presents the compression stress-strain curves, while Figure 5(b) presents the derived specific compression strength and moduli for the rubberised foam. The compression stress-strain curves are composed of a linear elastic, a constant stress and a densification region characterised by a sharp increase in the stress.
36
A 1 wt.% increase in the rubber content results in ∼1% decline in the specific compression strength. (a) Compression stress-strain curves and (b) specific compression properties of the SYN(n:m) specimens. The insert in (a) shows the compression test conditions.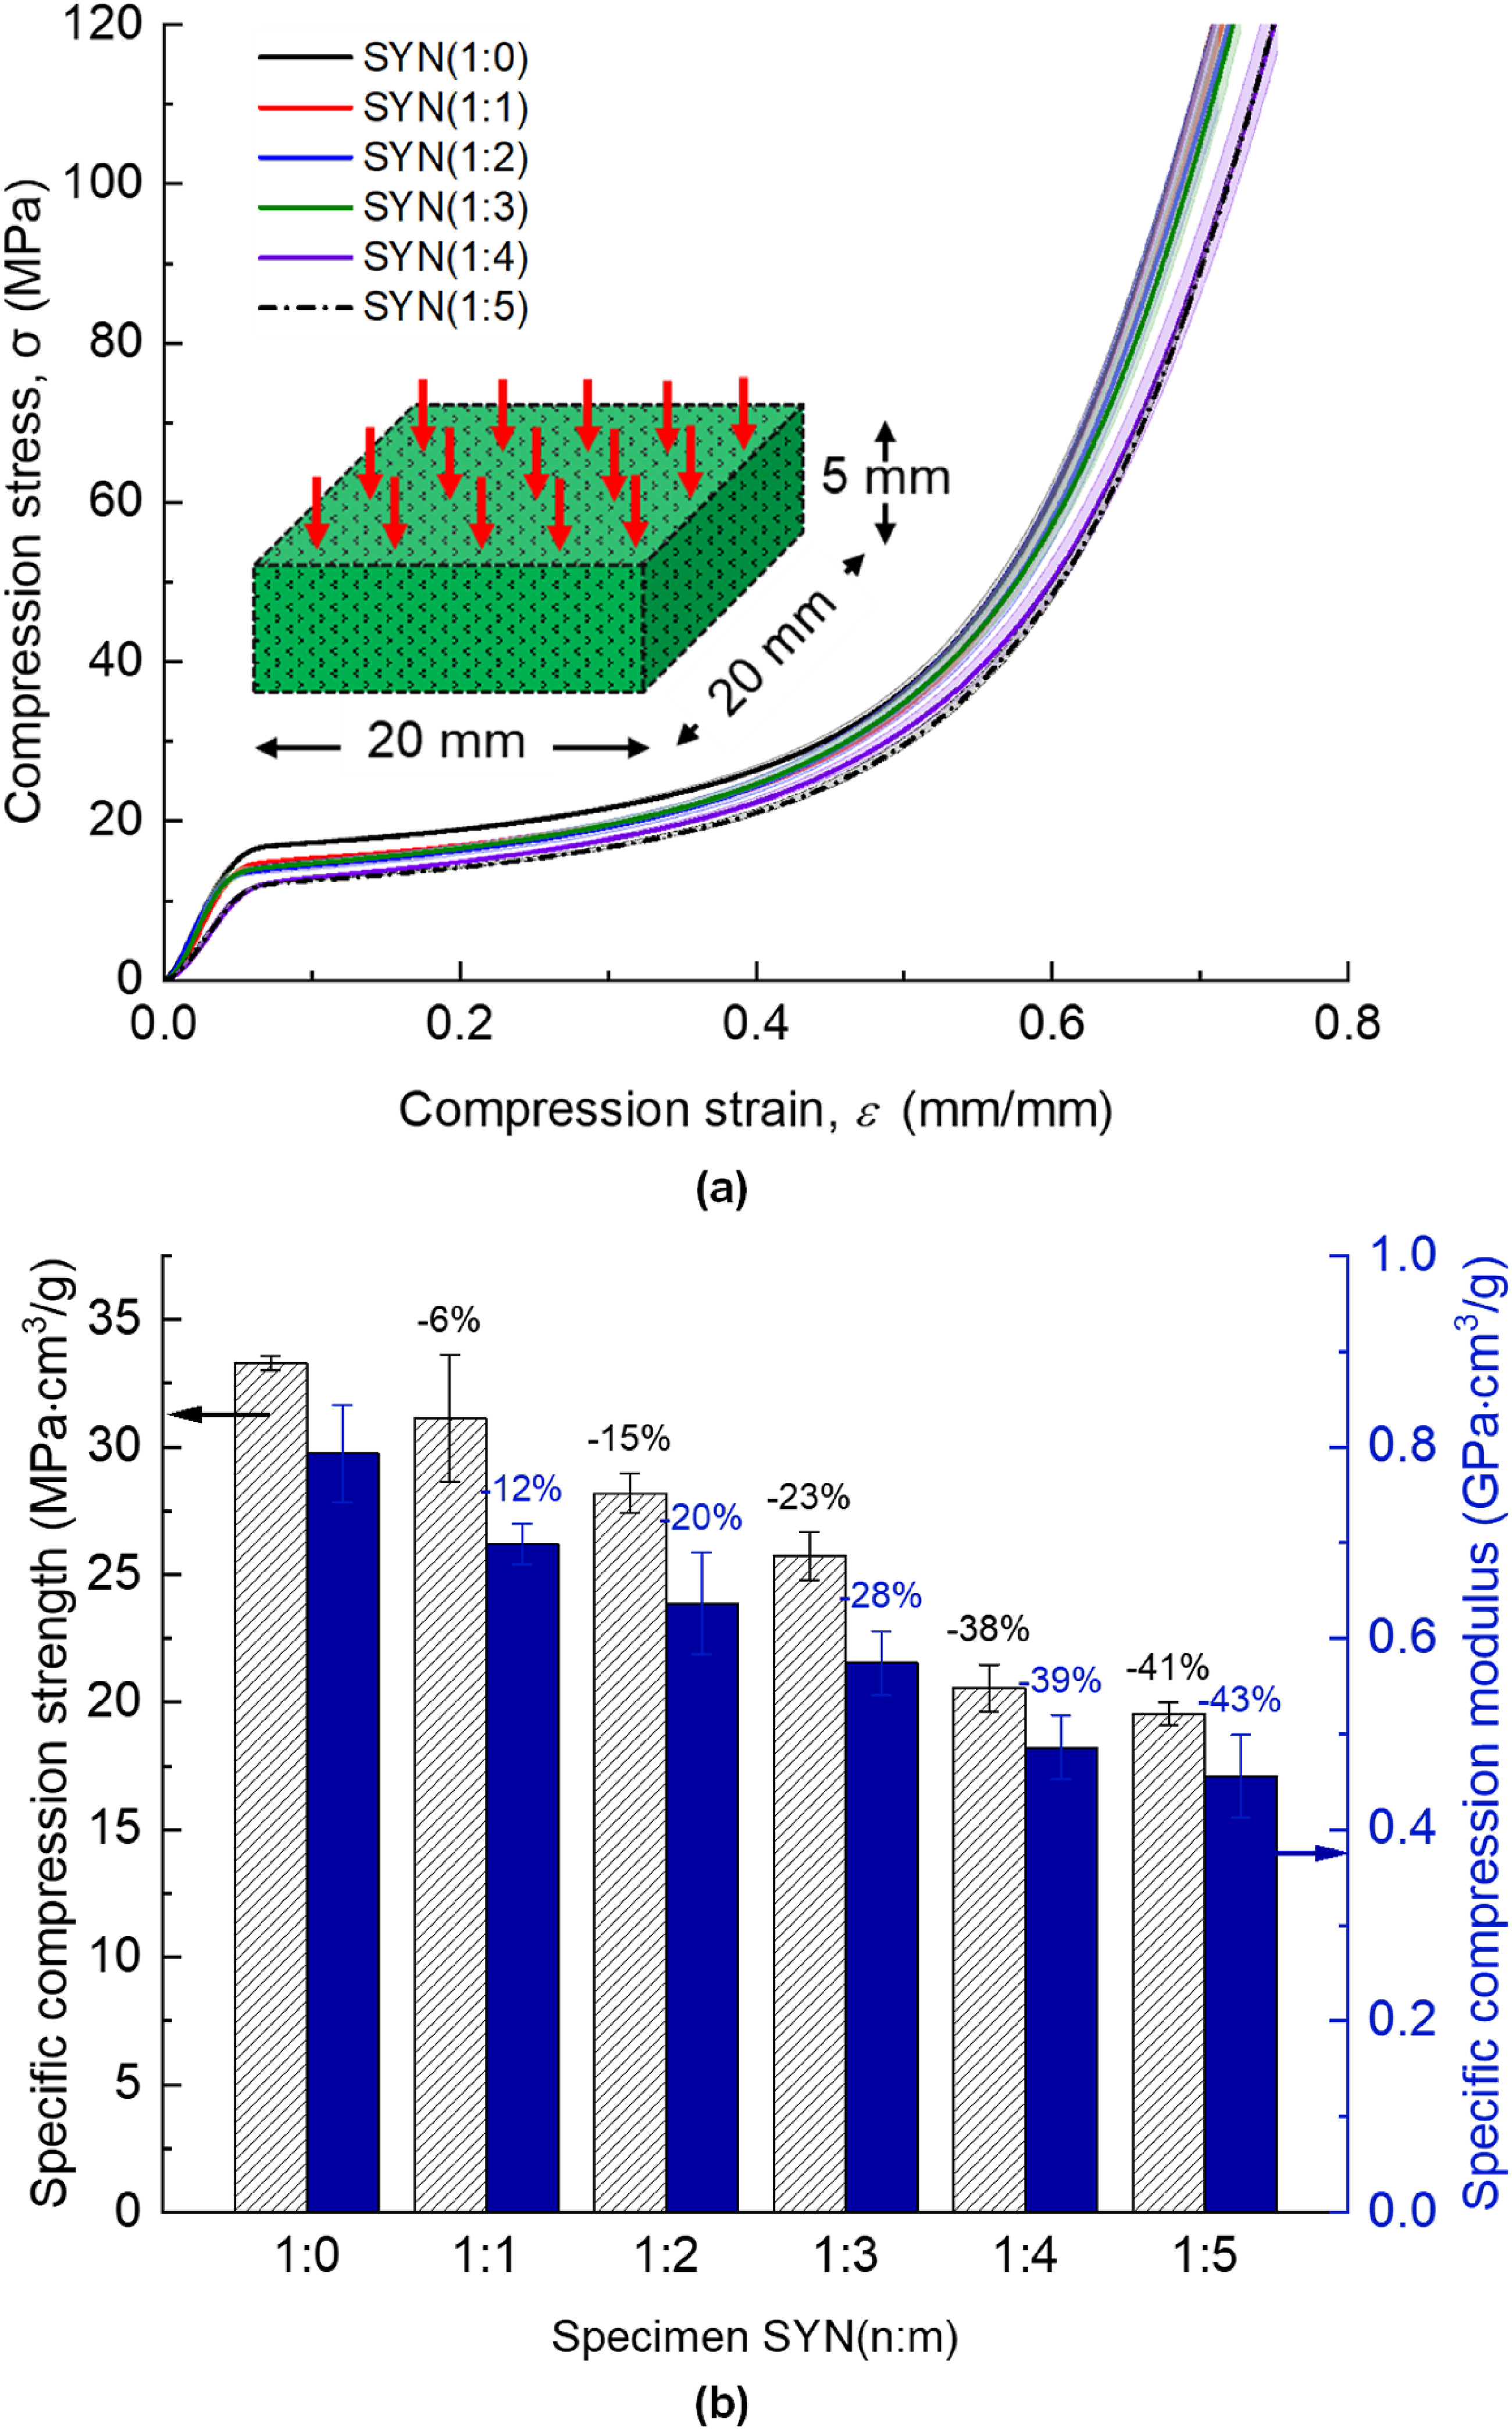
The poor rubber/epoxy interfacial bonding was implicated for the compression strength reduction with increasing rubber content. 37 Similar findings were reported by Pham et al., 38 wherein the mechanical properties of syntactic foam decreases upon the inclusion of micro-sized elastomeric particles. The reduction in the rubber/epoxy composite modulus can be attributed to the relatively lower rubber particle stiffness compared to that of the matrix. 16 So as the rubber content increased, the elastic modulus (stiffness) of the rubberised foam-core sandwich composites decreased. The compression modulus of the foam exhibited the same trend as the compression strength; a 1 wt.% increase in rubber content reduced the modulus by ∼1%. The decline in compression properties with increased rubber content was attributed to the low rubber particles stiffness and their weak adhesion to the matrix. Additionally, irregular rubber particles can induce stress concentrations, promoting crack initiation and consequently limiting the compression strength. The constant-stress region corresponds to the apparent yielding compression strength where strain values increase while the stress remains constant, primarily due to HGM crushing failure. As the weakest HGM particles fail, the broken particles cause the manifestation of stress concentrations. As soon as the localised stress exceeds the matrix compression strength, the foam disintegrates. The final stage of the compression response involves densification of HGM debris which causes the stress to rapidly build up. The inclusion of rubber particles changed the compression response of the foam. Therefore, LVI experiments were conducted to elucidate the effect of rubber particles on the impact response of rubberised foam-core composites.
Impact response of foam-core sandwich composites
Figure 6 displays the force versus time profiles for composites with varying rubber content in the foam core. Each graph displays two representative force-time curves for each configuration, suggesting consistency in the impact response of the composites. Analysing the force-time responses allows for a comparative evaluation of the effect of rubber particles on the impact response and energy absorption capabilities of the foam-core composites, and consequently, an understanding of damage mechanisms within the composite. For all specimen configurations, the force rapidly increased upon impact, reaching peak values between 2 and 3 ms following the impact event. The peak force is typically associated with damage initiation, including matrix cracking, fibre breakage, and delamination.
39
Force-time LVI response of syntactic foam-core sandwich composites. The solid and dashed profiles represent two separate tests showing variability between tests.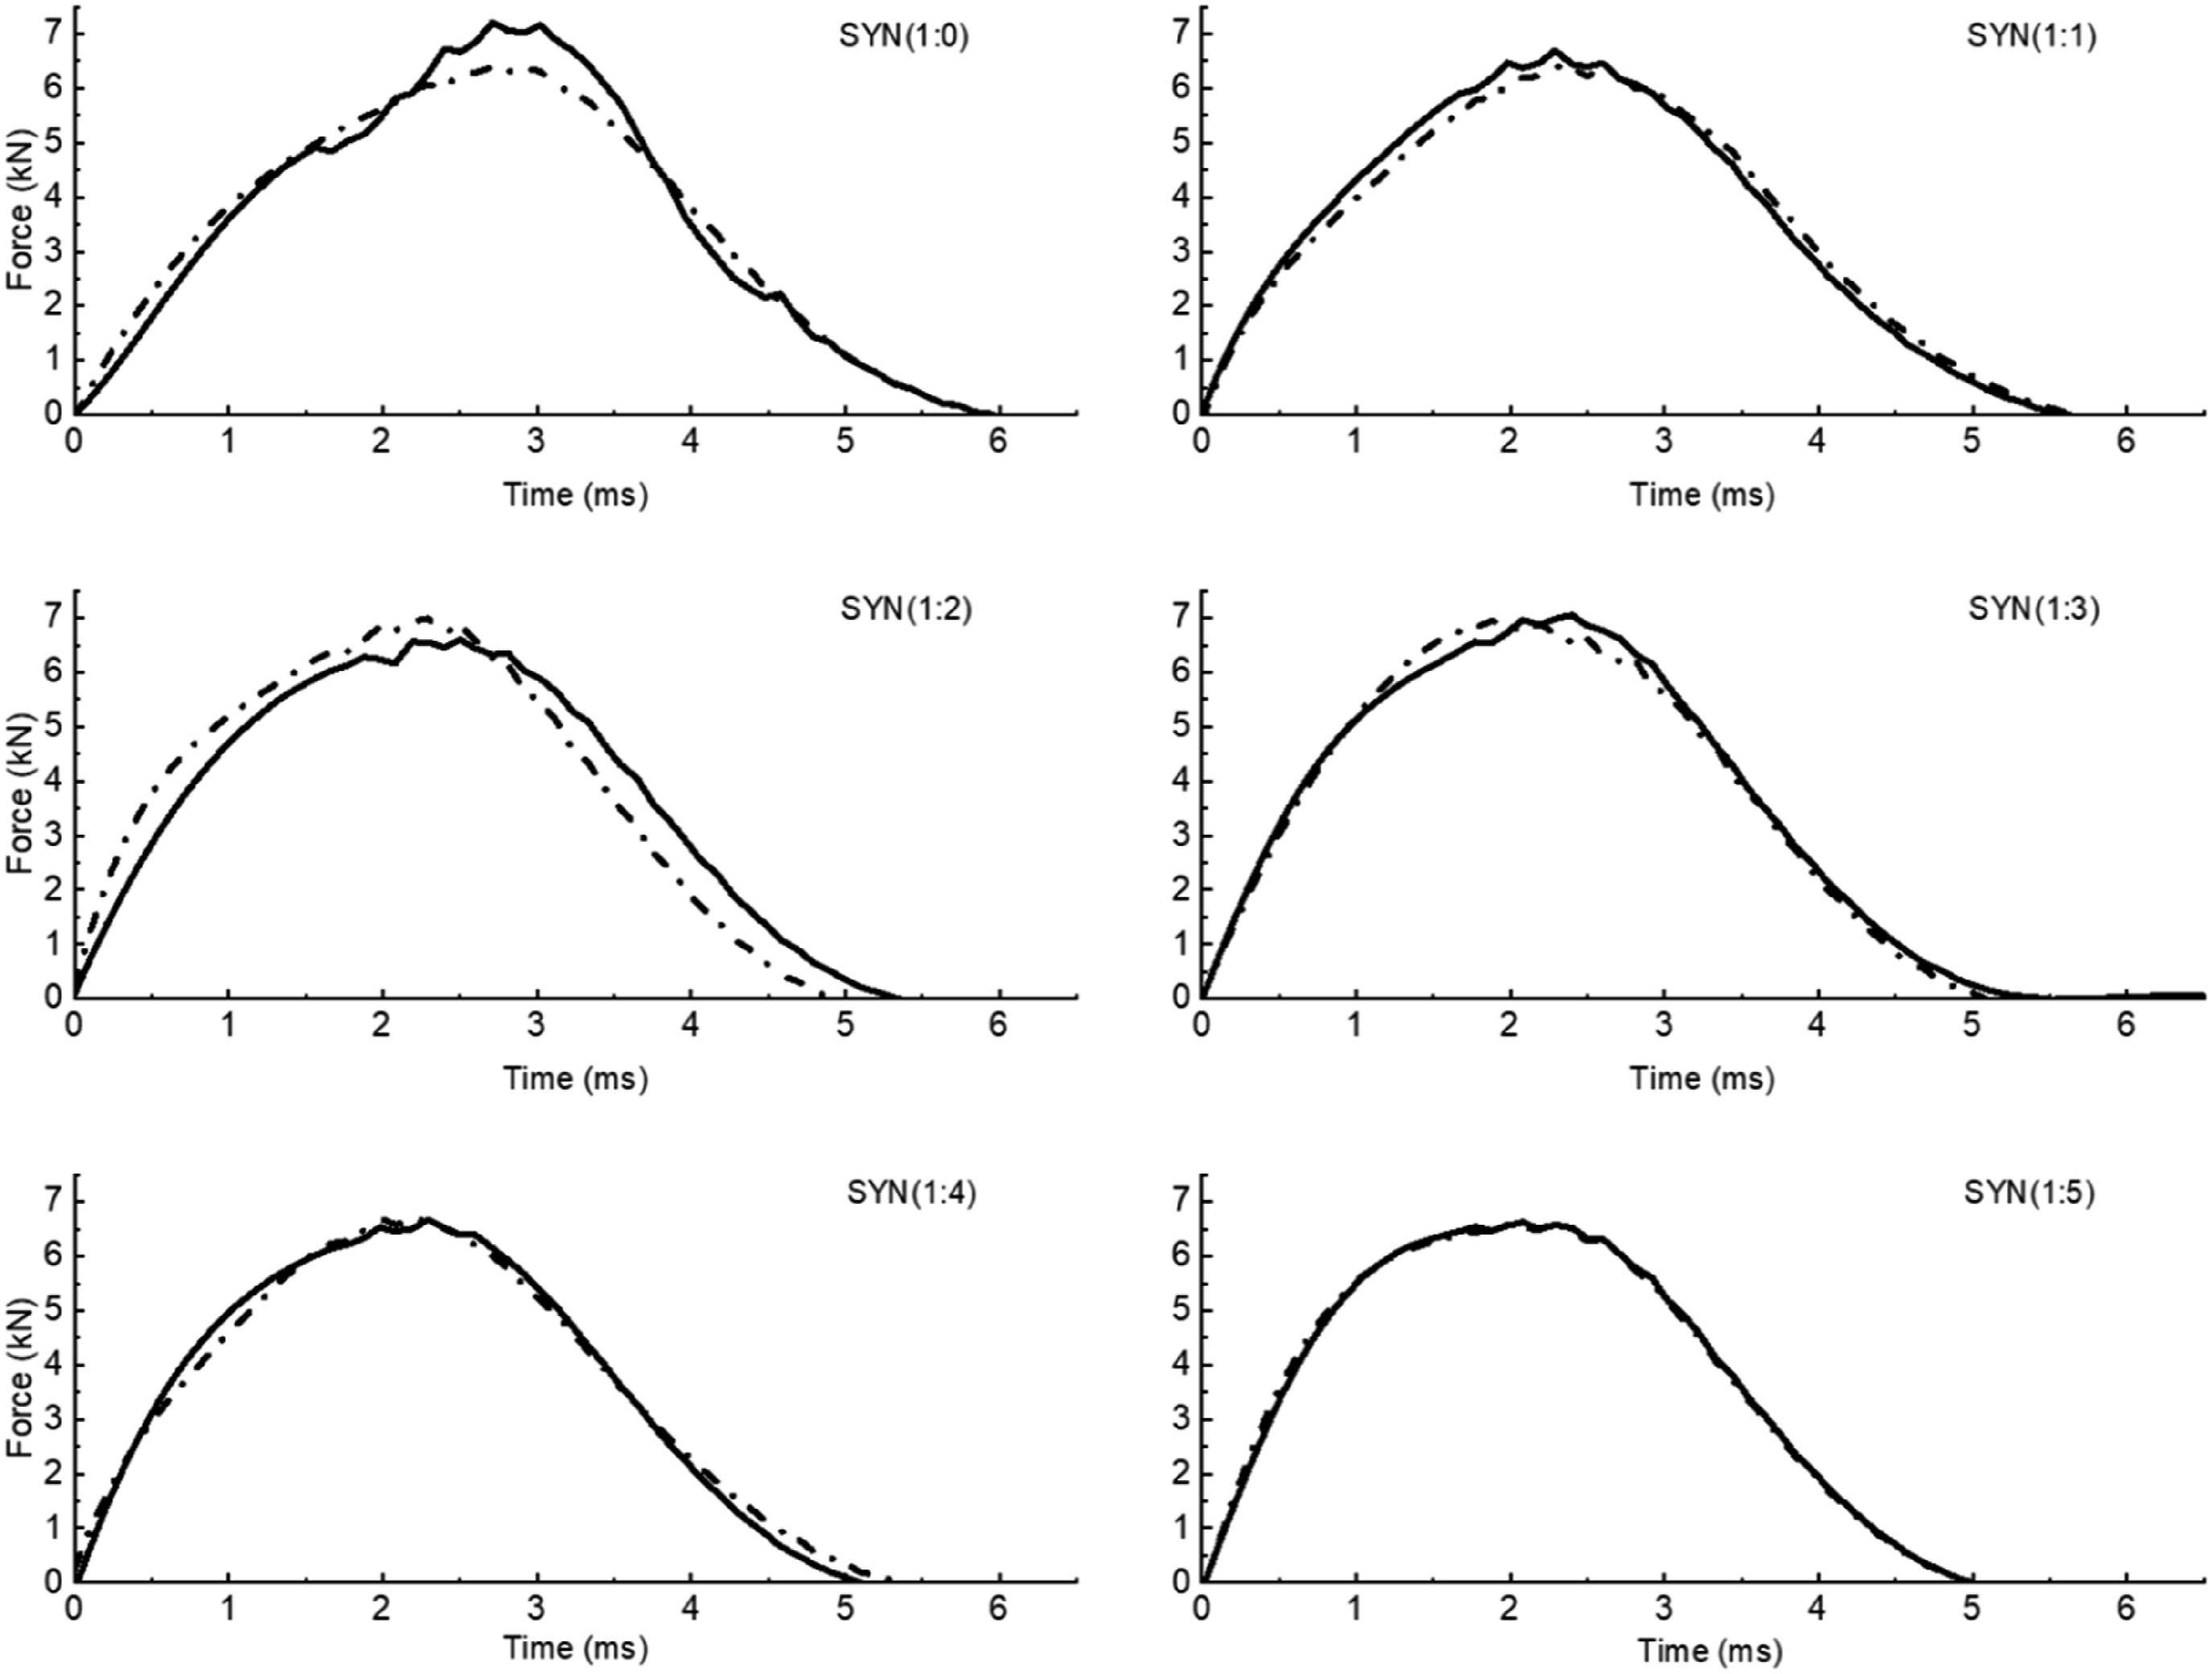
The composite without rubber particles in the core exhibited sharp oscillatory local peak events before the peak force value. These can be attributed to the brittle nature of the thermosetting epoxy matrix and the HGM ceramic particles.5,6 These oscillatory events were fewer or absent in composites with the rubberised foam core. The peak impact forces measured for both composites with and without rubberised foam cores were between 6.5 and 7 kN. The incorporation of rubber particles in the foam core slightly reduced the peak force during impact, due to the elastic deformation of rubber particles and subsequent absorption of the impact energy. 23 Plastic shear yielding, crack deflection by rubber particles, and debonding at the epoxy/rubber interface are some of the toughening mechanisms that can possibly arrest crack growth during an impact event.14,20,40
After reaching the peak value, the force remained relatively constant for a short period before gradually declining as the impactor retreated. The plateau region near the peak force is typically associated with energy absorption mechanisms, including crushing of the foam core, localised delamination at the core/face sheet interface, face sheet denting and delamination, core shear failure, and plastic deformation of the composite. 41 This plateau region represents a period where sustained damage propagation and energy absorption occur without significant increases in force. The force-time curves for composites with the rubberised foam core appeared smoother compared to the baseline composite. The expansion of the core material during the impactor rebound phase can generate upward forces that temporarily cause the impactor to lose contact with the composite surface, leading to oscillations in the force-time profile of the baseline composite. Rubber fillers, with their excellent viscoelastic characteristics, tend to smoothen these energy-release events.
The velocity-time data was generated from the numerical integration of the force-time data according to equation (2)
30
:


Figure 7(a) displays the force versus displacement profiles, while Figure 7(b) shows the maximum displacement for the foam-core composites, both with and without rubber particles. The results indicate that the maximum displacement decreased as the rubber content in the foam core increased. For instance, the maximum displacement value for the GFRE composite incorporating SYN(1:5) foam was approximately 20% lower than that for the composite without rubber particles. This implies that the rubberised foam absorbed significantly more impact energy than the unmodified foam, resulting in greater deflection of the composite upon impact. (a) Impactor force versus displacement and (b) maximum impactor displacement for sandwich composites incorporating SYN(n:m) foam and subjected to low-velocity impact. The percent values in (b) indicate the change in the maximum displacement values.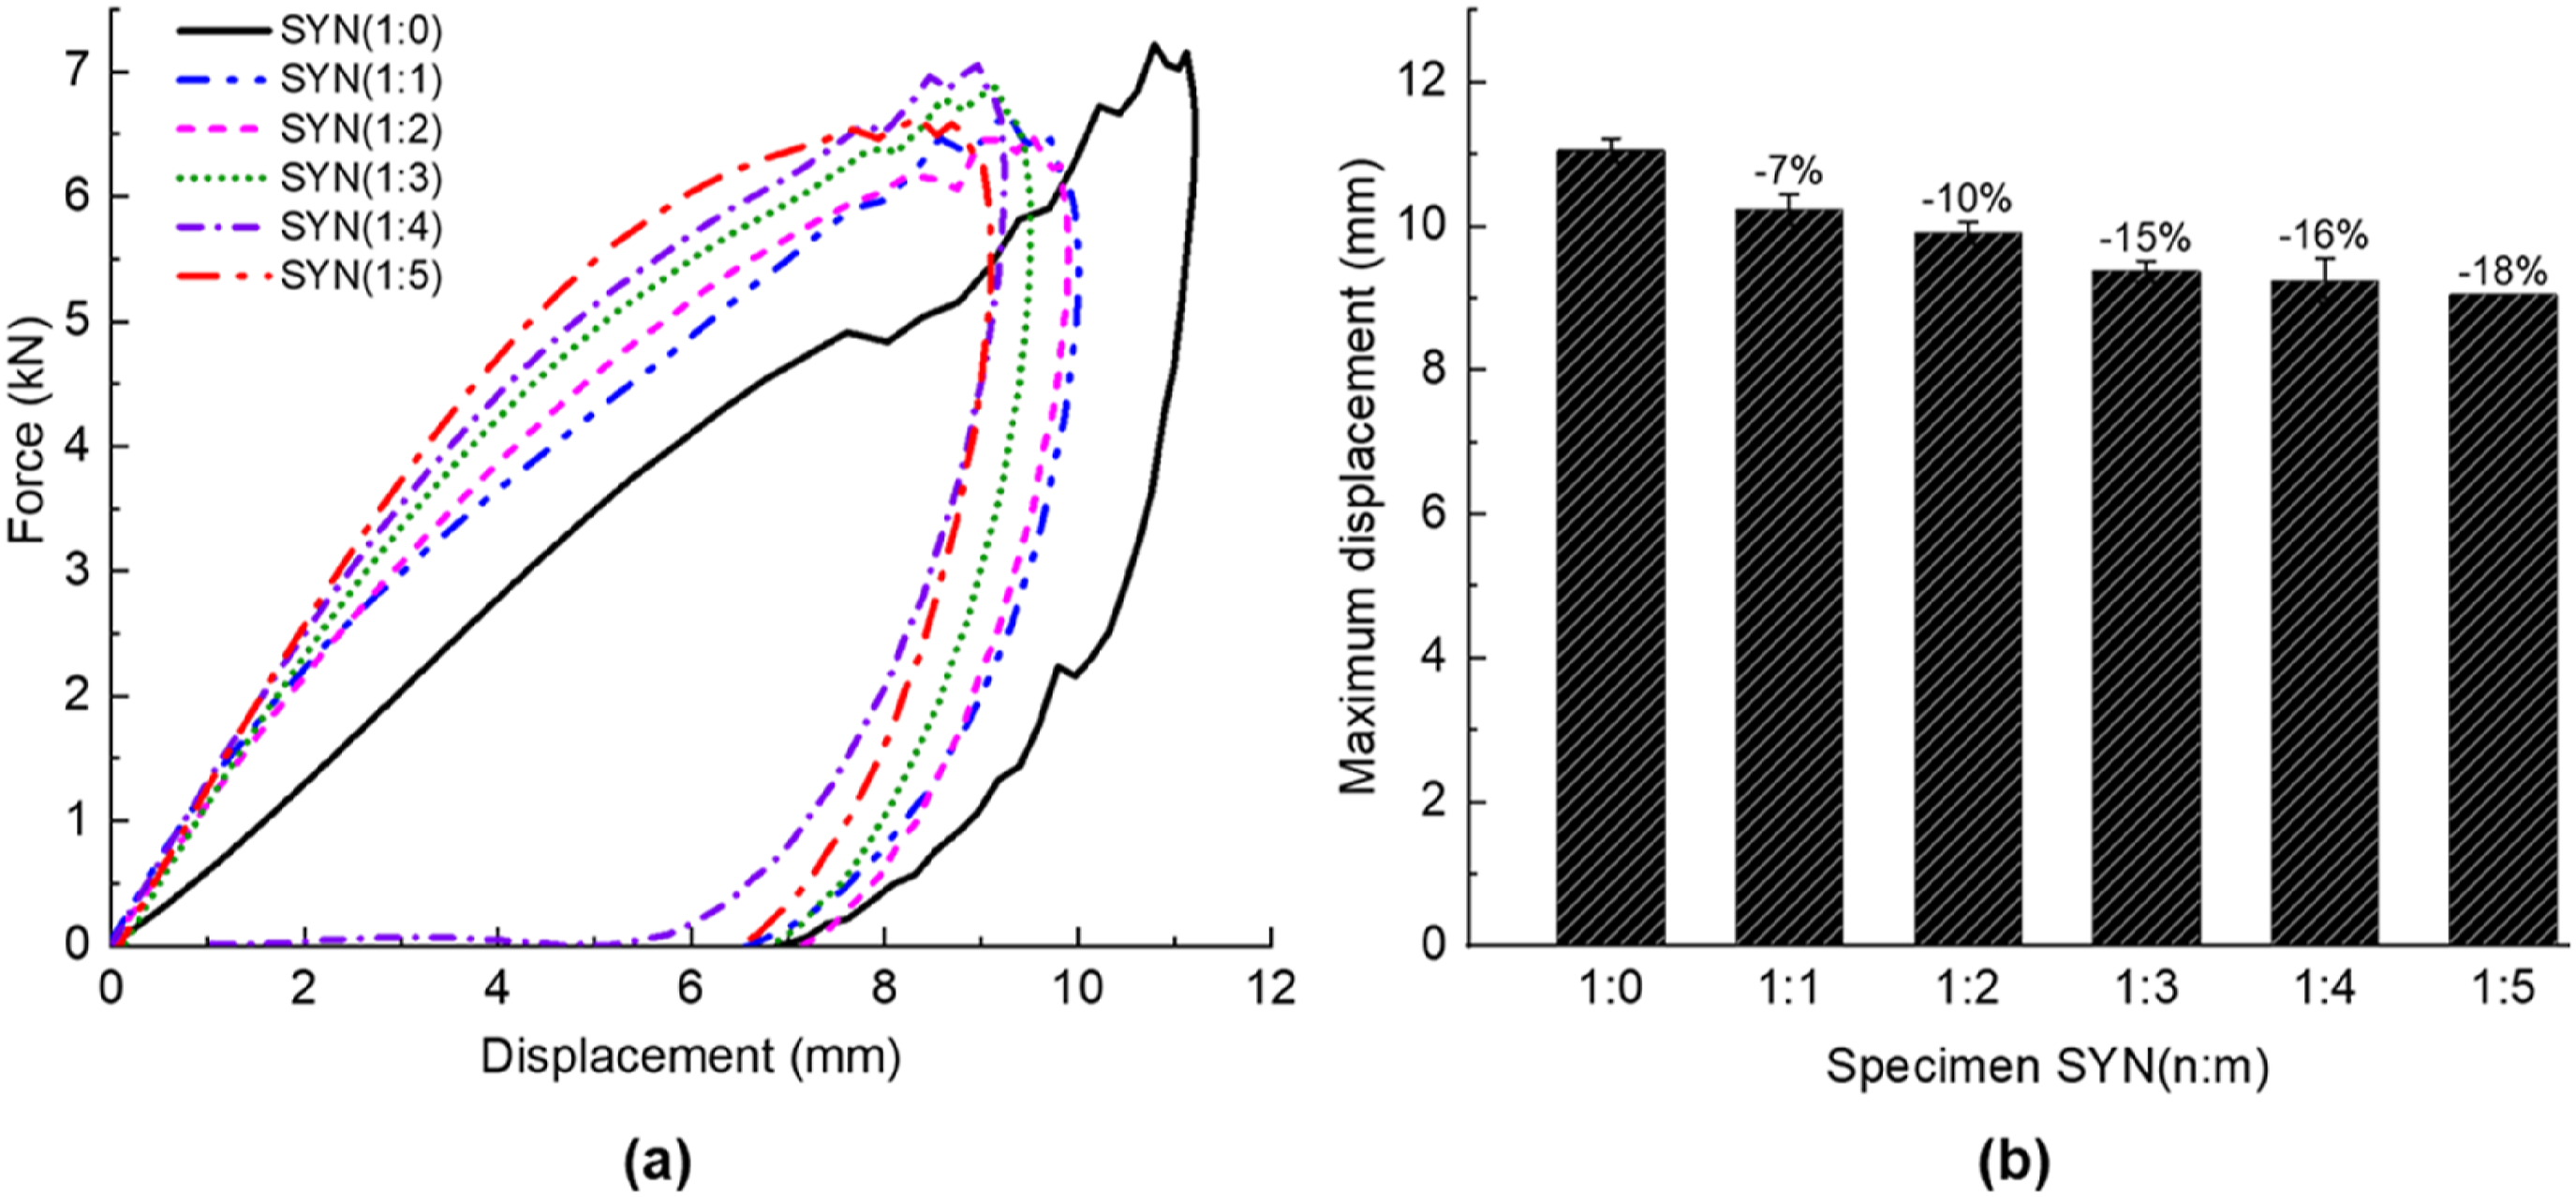
During the impact event, the composite undergoes deformation and damage, leading to the dissipation of kinetic energy through mechanisms such as plastic deformation, matrix cracking, fibre fracture, and delamination. The absorbed impact energy reflects the combined effect of these failure modes in dissipating kinetic energy. Materials with high energy absorption capacities can endure and dissipate more energy during impact, making them suitable for applications where impact resistance and damage tolerance are crucial. Figure 8(a) illustrates the energy absorbed per unit mass during impact, while Figure 8(b) depicts the total absorbed energy following the rebound of the impactor. The difference in mass-specific absorbed energy between the impacted composites is statistically insignificant. This observation suggests little to no effect of the rubber particles on impact energy absorption capability. However, the positive outcome is that the rubber particles can be used as a filler material in syntactic foam without a detrimental impact on the mechanics of the resultant foam-core composite. (a) Absorbed energy per unit mass versus time and (b) total absorbed energy per unit mass for SYN(n:m) foam-core composites. The percent values in (b) indicate the change in the absorbed energy per unit mass relative to the composite with the unmodified core.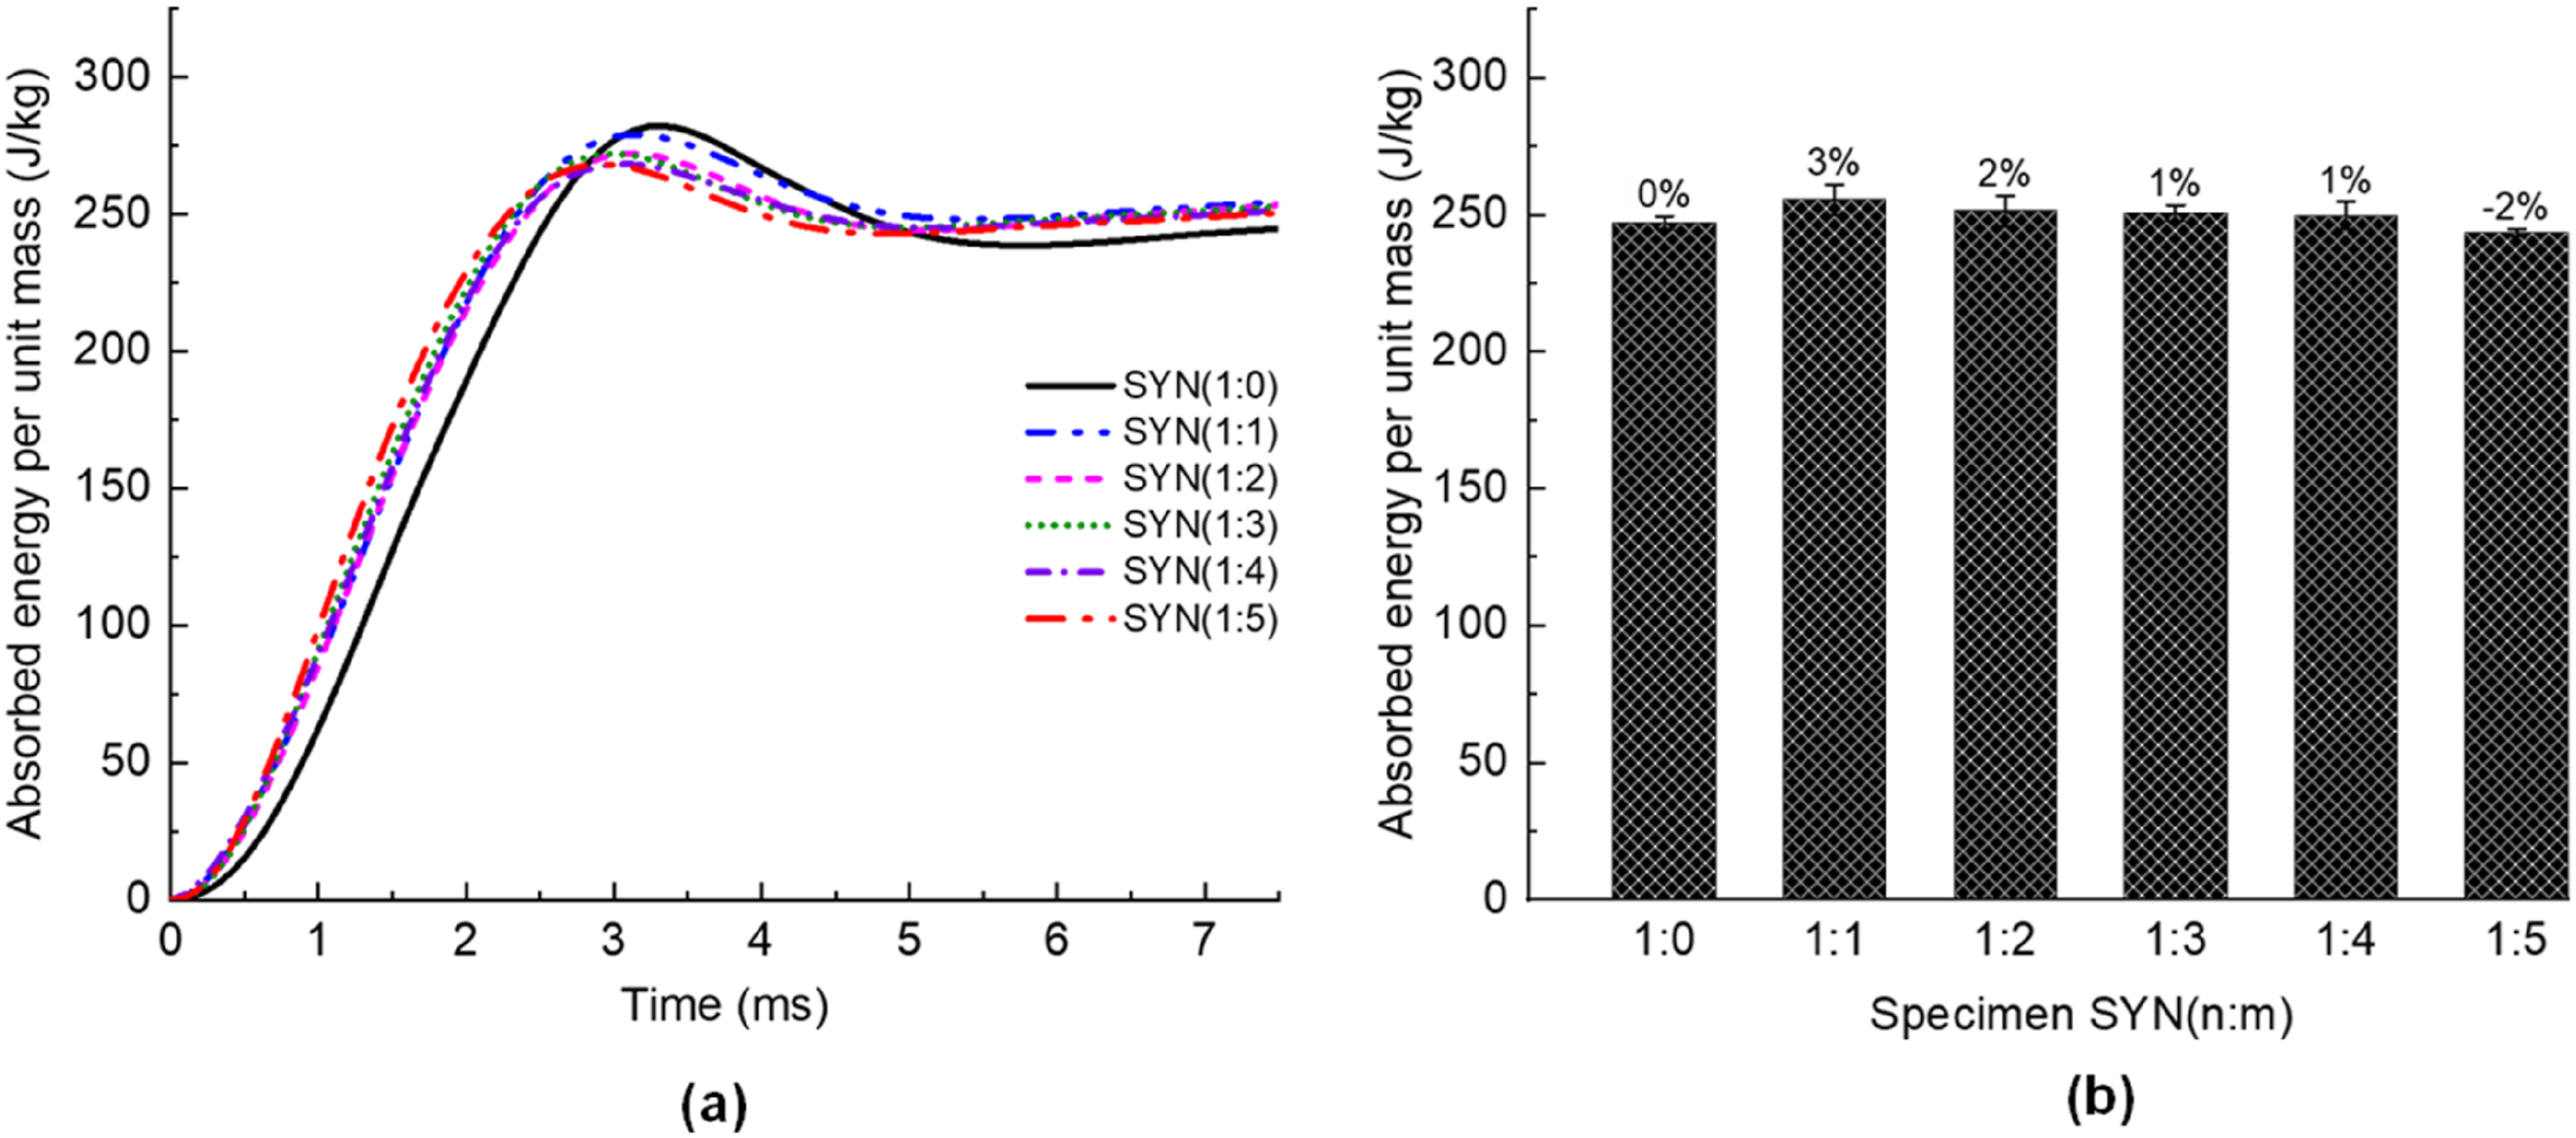
However, the extent of impact-induced damage may vary depending on the intrinsic damage mitigation mechanisms for different composite configurations. The extent and type of impact damage were, therefore, characterised using X-ray CT and ultrasonic testing. Figure 9 presents X-ray CT images depicting the core/back GFRE laminate interface of the impacted composites. The highlighted red area indicates cracking within the back face sheet, discernible by the white bordered margins that are a result of matrix cracking during impact. While the CT scan detects matrix cracking in the GFRE face sheet, it cannot identify bondline failure at the core/face sheet interface. To address this limitation, ultrasound C-scanning was employed for a more comprehensive assessment of delamination at the core/GFRE laminate interface. CT scan images of post-impact foam-core composites showing through-thickness damage patterns (highlighted in red) for composites incorporating different foam materials (a) SYN(1:0), (b) SYN(1:1), (c) SYN(1:2), (d) SYN(1:3), (e) SYN(1:4), and (f) SYN(1:5).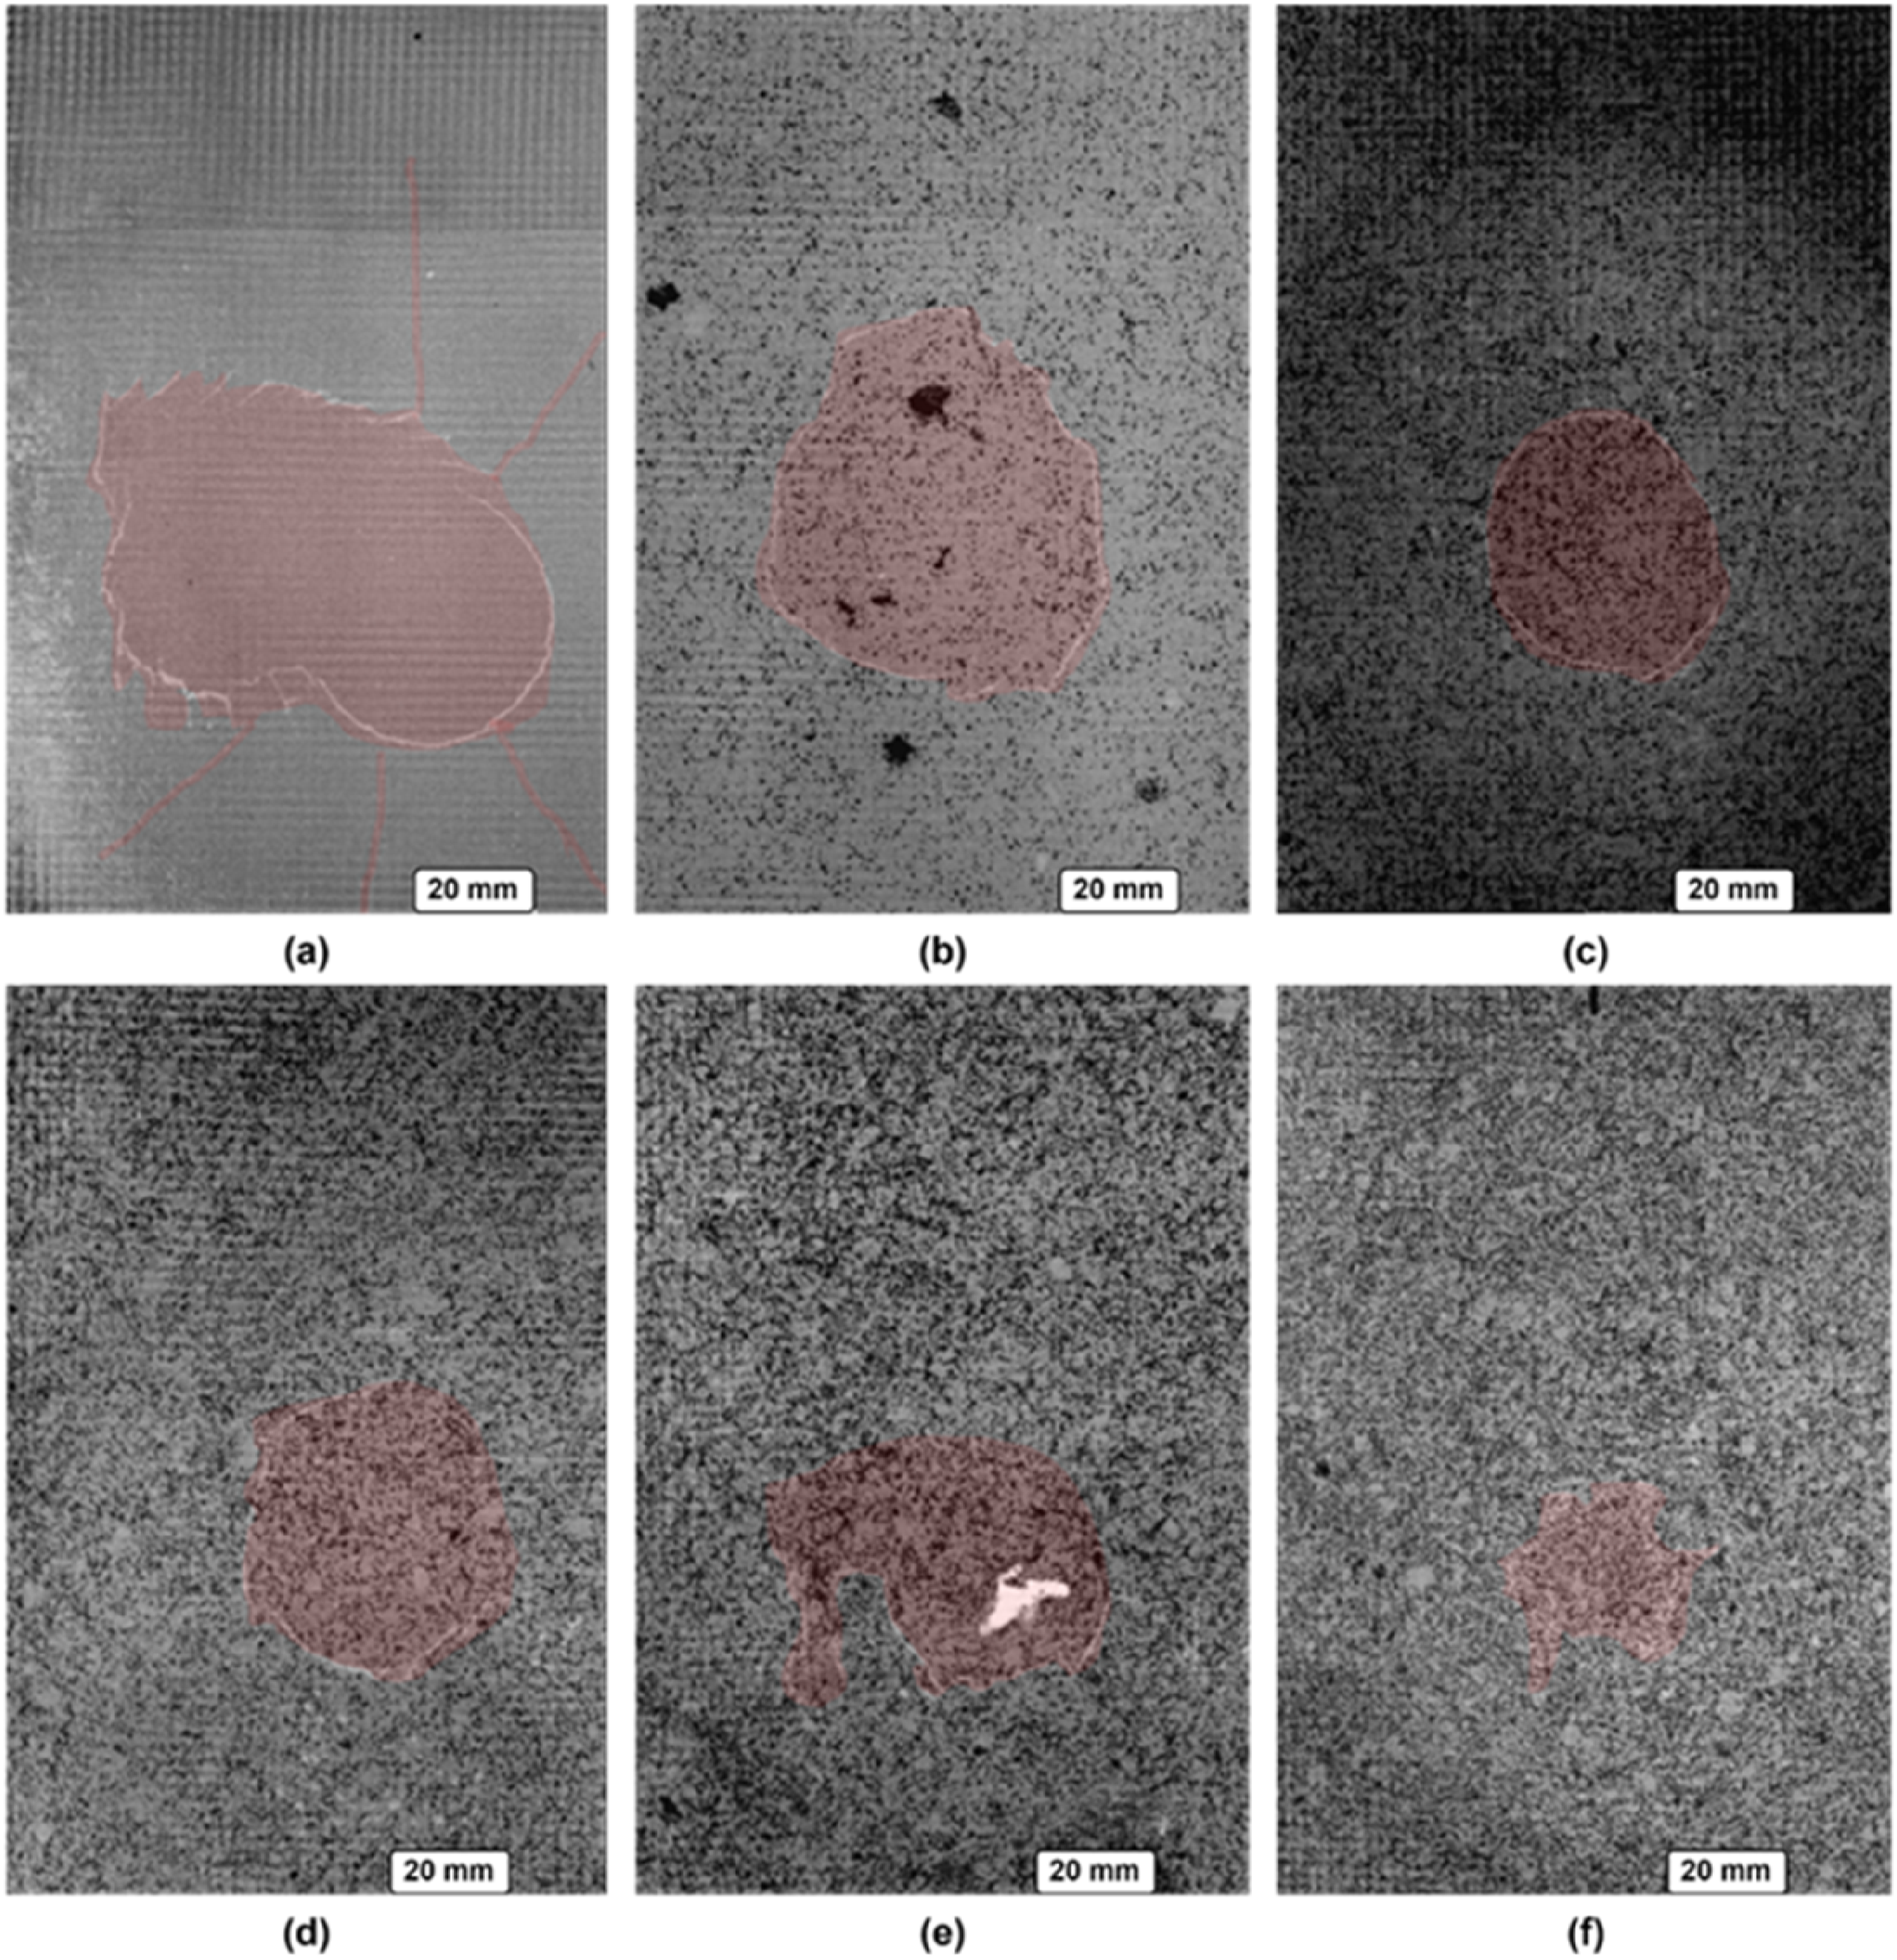
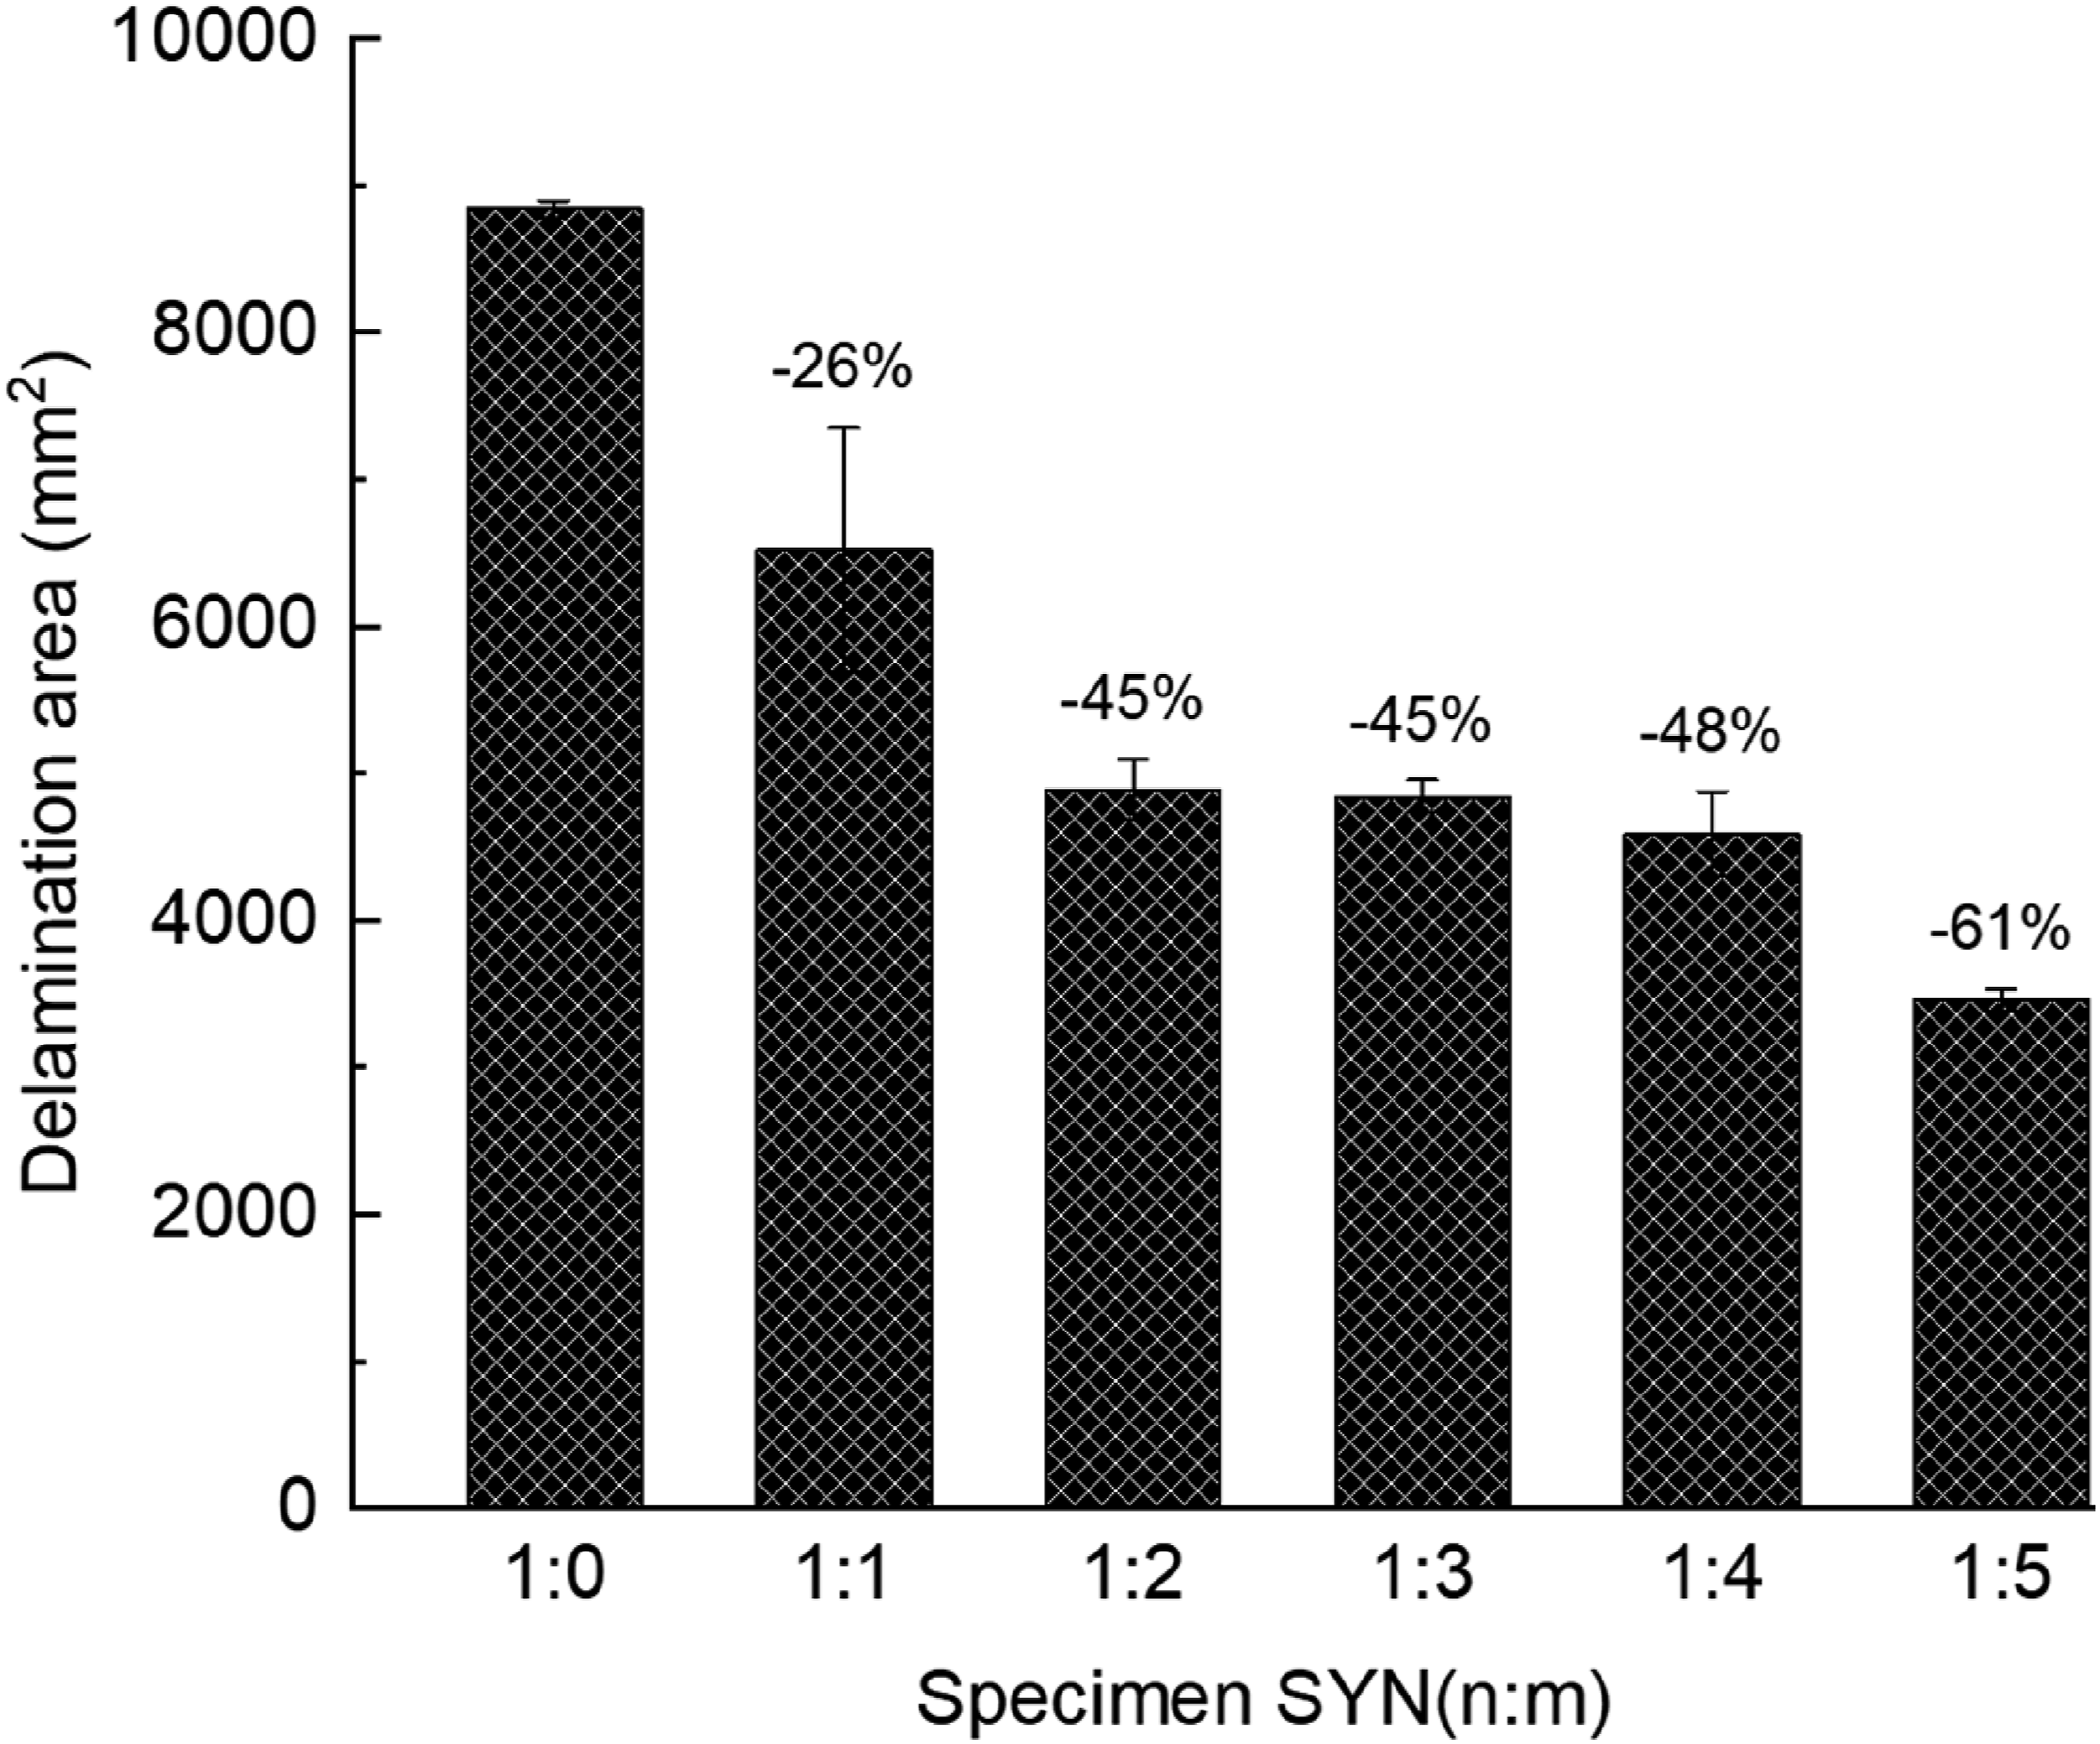
Figure 10 shows the ultrasound C-scan images of the impact-damaged composites. The images reveal a more substantial extent of damage in comparison to the damage discernible in the X-ray CT images. The ultrasonic data was, therefore, ultimately used to determine the extent of delamination at the core/face sheet interface. This is indicated by the dashed black lines superimposed onto the green colour on the C-scans. The 50% signal reduction or 6 dB-drop method was chosen as it provides the most accurate means of estimating a defect edge, assuming an idealised circular sound beam and defect geometry.42,43 Performing the measurement in transmission reduces diffraction effects exhibited by the pulse-echo (single-sided) method, while ensuring the sound loss through the entire material is captured. The delamination area was estimated based on selected pixel intensities inside the dashed perimeter using MATLAB®. Generally, the delamination area decreased as the rubber content within the foam core increased. The delamination area decreased by 1.7% when the rubber content increased by ∼ 1 wt.% as indicated in Figure 11. The composite incorporating SYN(1:5) foam exhibited ∼60% reduction in the delamination area compared to that without rubber. Ultrasonic C-scan for post-impact foam-core composites incorporating different foam materials (a) SYN(1:0), (b) SYN(1:1), (c) SYN(1:2), (d) SYN(1:3), (e) SYN(1:4), (f) SYN(1:5). Delaminated regions are indicated by the dark blue colour (low transmission amplitude) while the undamaged material is indicated by the white colour (high transmission). The post-impact delamination area calculated from C-scan response. Percent values indicate the reduction in the delamination area relative to the baseline composite.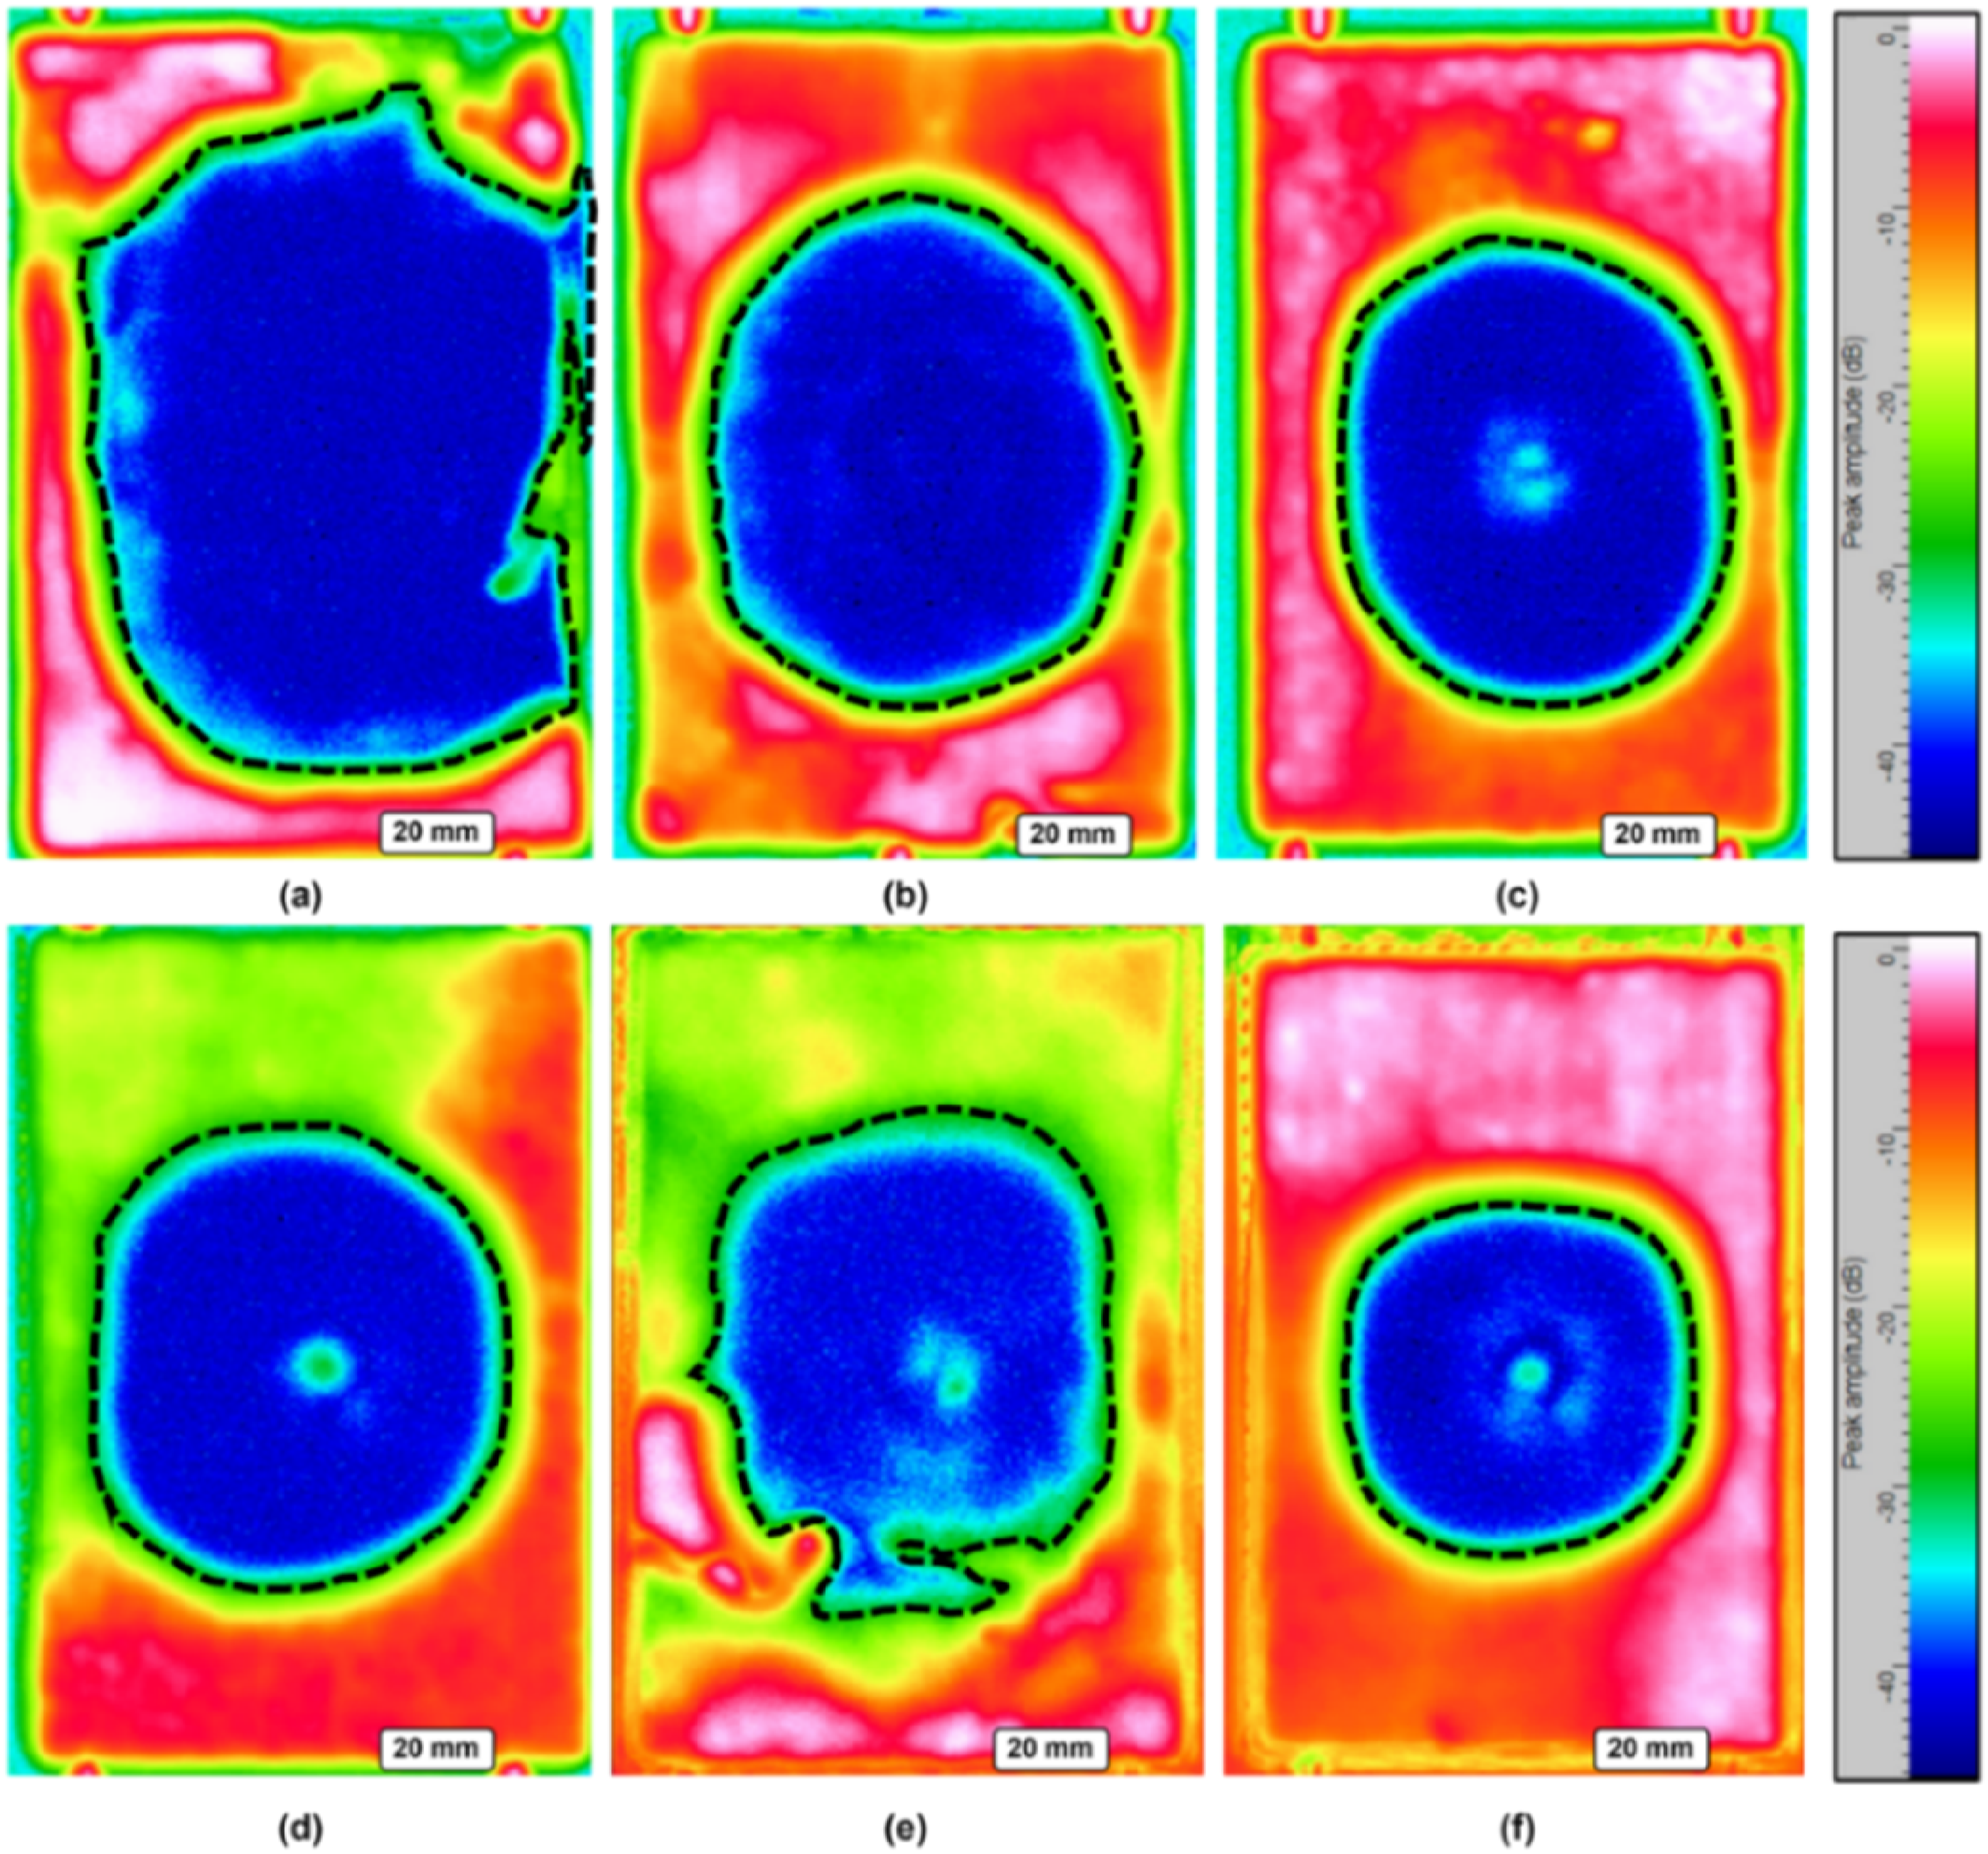
As shown in Figure 12, the delamination lengths estimated via C-scan were consistent with the delamination lengths determined from the sectioned specimens. The ultrasonic immersion testing accurately sized the impact delamination, with results falling within a ±12% deviation from the physically measured delamination length acquired via sectioning. This congruence in measurements shows that ultrasonic characterisation identifies the most extensive impact damage area, defined by the delamination occurring at the core material/back sheet interface. Delamination length measured along the specimen length of sectioned specimens and plotted against damage length determined from C-scan imaging.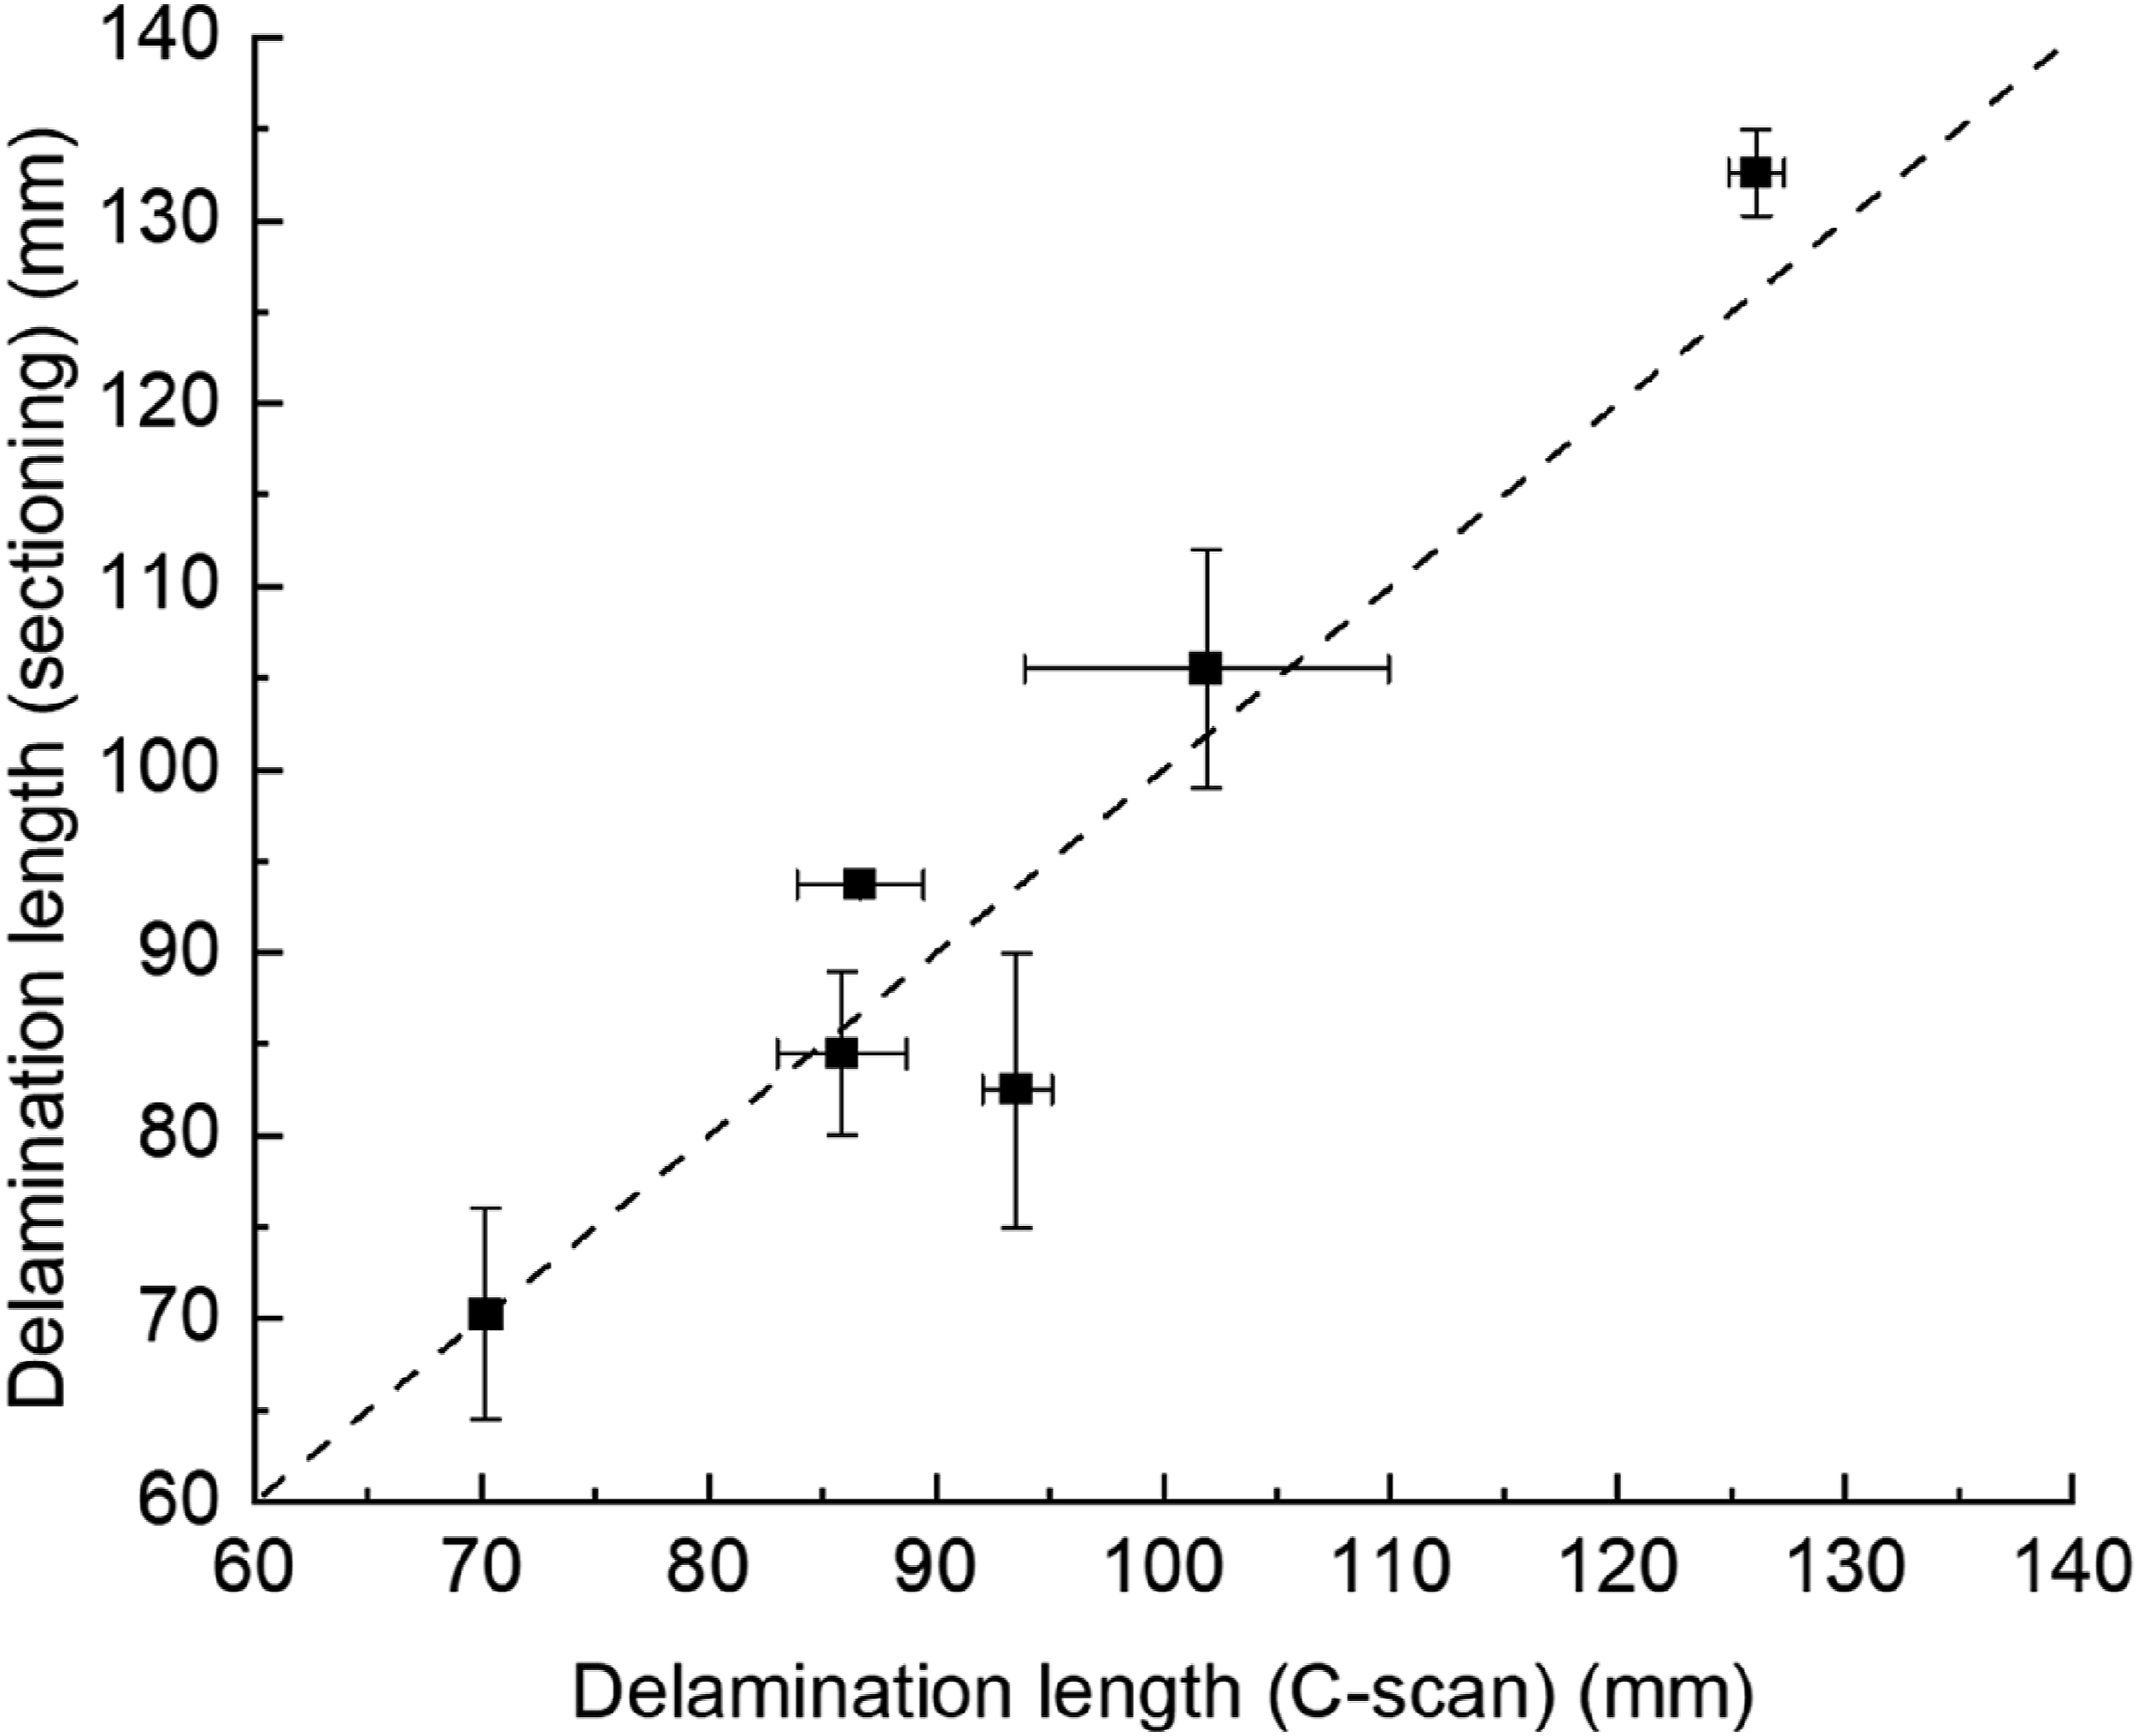
The reduced interfacial delamination in composites with rubberised foam suggests that the presence of viscoelastic rubber particles contributes to the mitigation of impact damage. Firstly, viscoelastic rubber particles possess inherent damping properties, enabling efficient absorption and dissipation of kinetic energy during impact. Rubber particles can undergo significant elastic deformation, absorbing large amounts of energy and reducing the force transmitted to surrounding materials and, consequently the extent of damage. Secondly, the presence of rubber particles can enhance the fracture toughness of the foam core through mechanisms such as crack pinning, crack deflection, and bifurcation.16,23,44 The crack-arresting mechanisms promoted by rubber particles within the foam core can slow down crack growth and limit damage. Thirdly, rubber particles can promote a more uniform distribution of applied load, reducing localised stress concentrations resisting core failure. 13 The elastic nature of rubber particles allows them to deform under load, which can smooth out stress concentrations that would otherwise lead to localised failure. By redistributing stresses, the rubber particles reduce peak stresses at critical points, such as the interface between the foam core and the composite laminate. Finally, rubber particles can improve the interfacial integrity between the rubber-reinforced core and the face sheets, enhancing load transfer and resisting skin/core interfacial failure, thereby limiting interfacial delamination. Further, in the event of micro-cracks or delamination initiation, the presence of rubber particles can interrupt the crack path, requiring more energy for the crack to propagate. Rubber particles may increase the surface roughness or provide additional bonding sites, leading to improved mechanical interlocking and chemical bonding between the foam core and the laminate. This improved adhesion can strengthen the interface, making it more resistant to delamination under stress. The rubber particles at the interface can also arrest or divert cracks mitigating interfacial failure.
The impact-damaged composites were cut along the centre of the impact dent, revealing the through-thickness plane, as depicted in the photographic images in Figures 13 and 14. All specimens exhibited permanent deformation at the impact location. In the CT image of SYN(1:0), the baseline composite, cone-shaped shear failure occurred, accompanied by cracks at approximately ±45° relative to the impact loading direction, as depicted in Figure 13. Impact damage characterisation of the baseline foam-core composite revealing (a) transverse and delamination cracks within the impacted face sheet, (b) face sheet/core delamination, (c) shear failure of the foam core and (d) delamination at the foam core/back sheet interface. Impact damage characterisation of the rubberised foam-core composite (SYN(1:5)) revealing (a) transverse and delamination cracks within the impacted face sheet, and (b) crack arrest. Toughening mechanisms in (b1), (b2) and (b3) due to rubber particles involved crack pinning, crack bifurcation and rubber/matrix interfacial disbonding.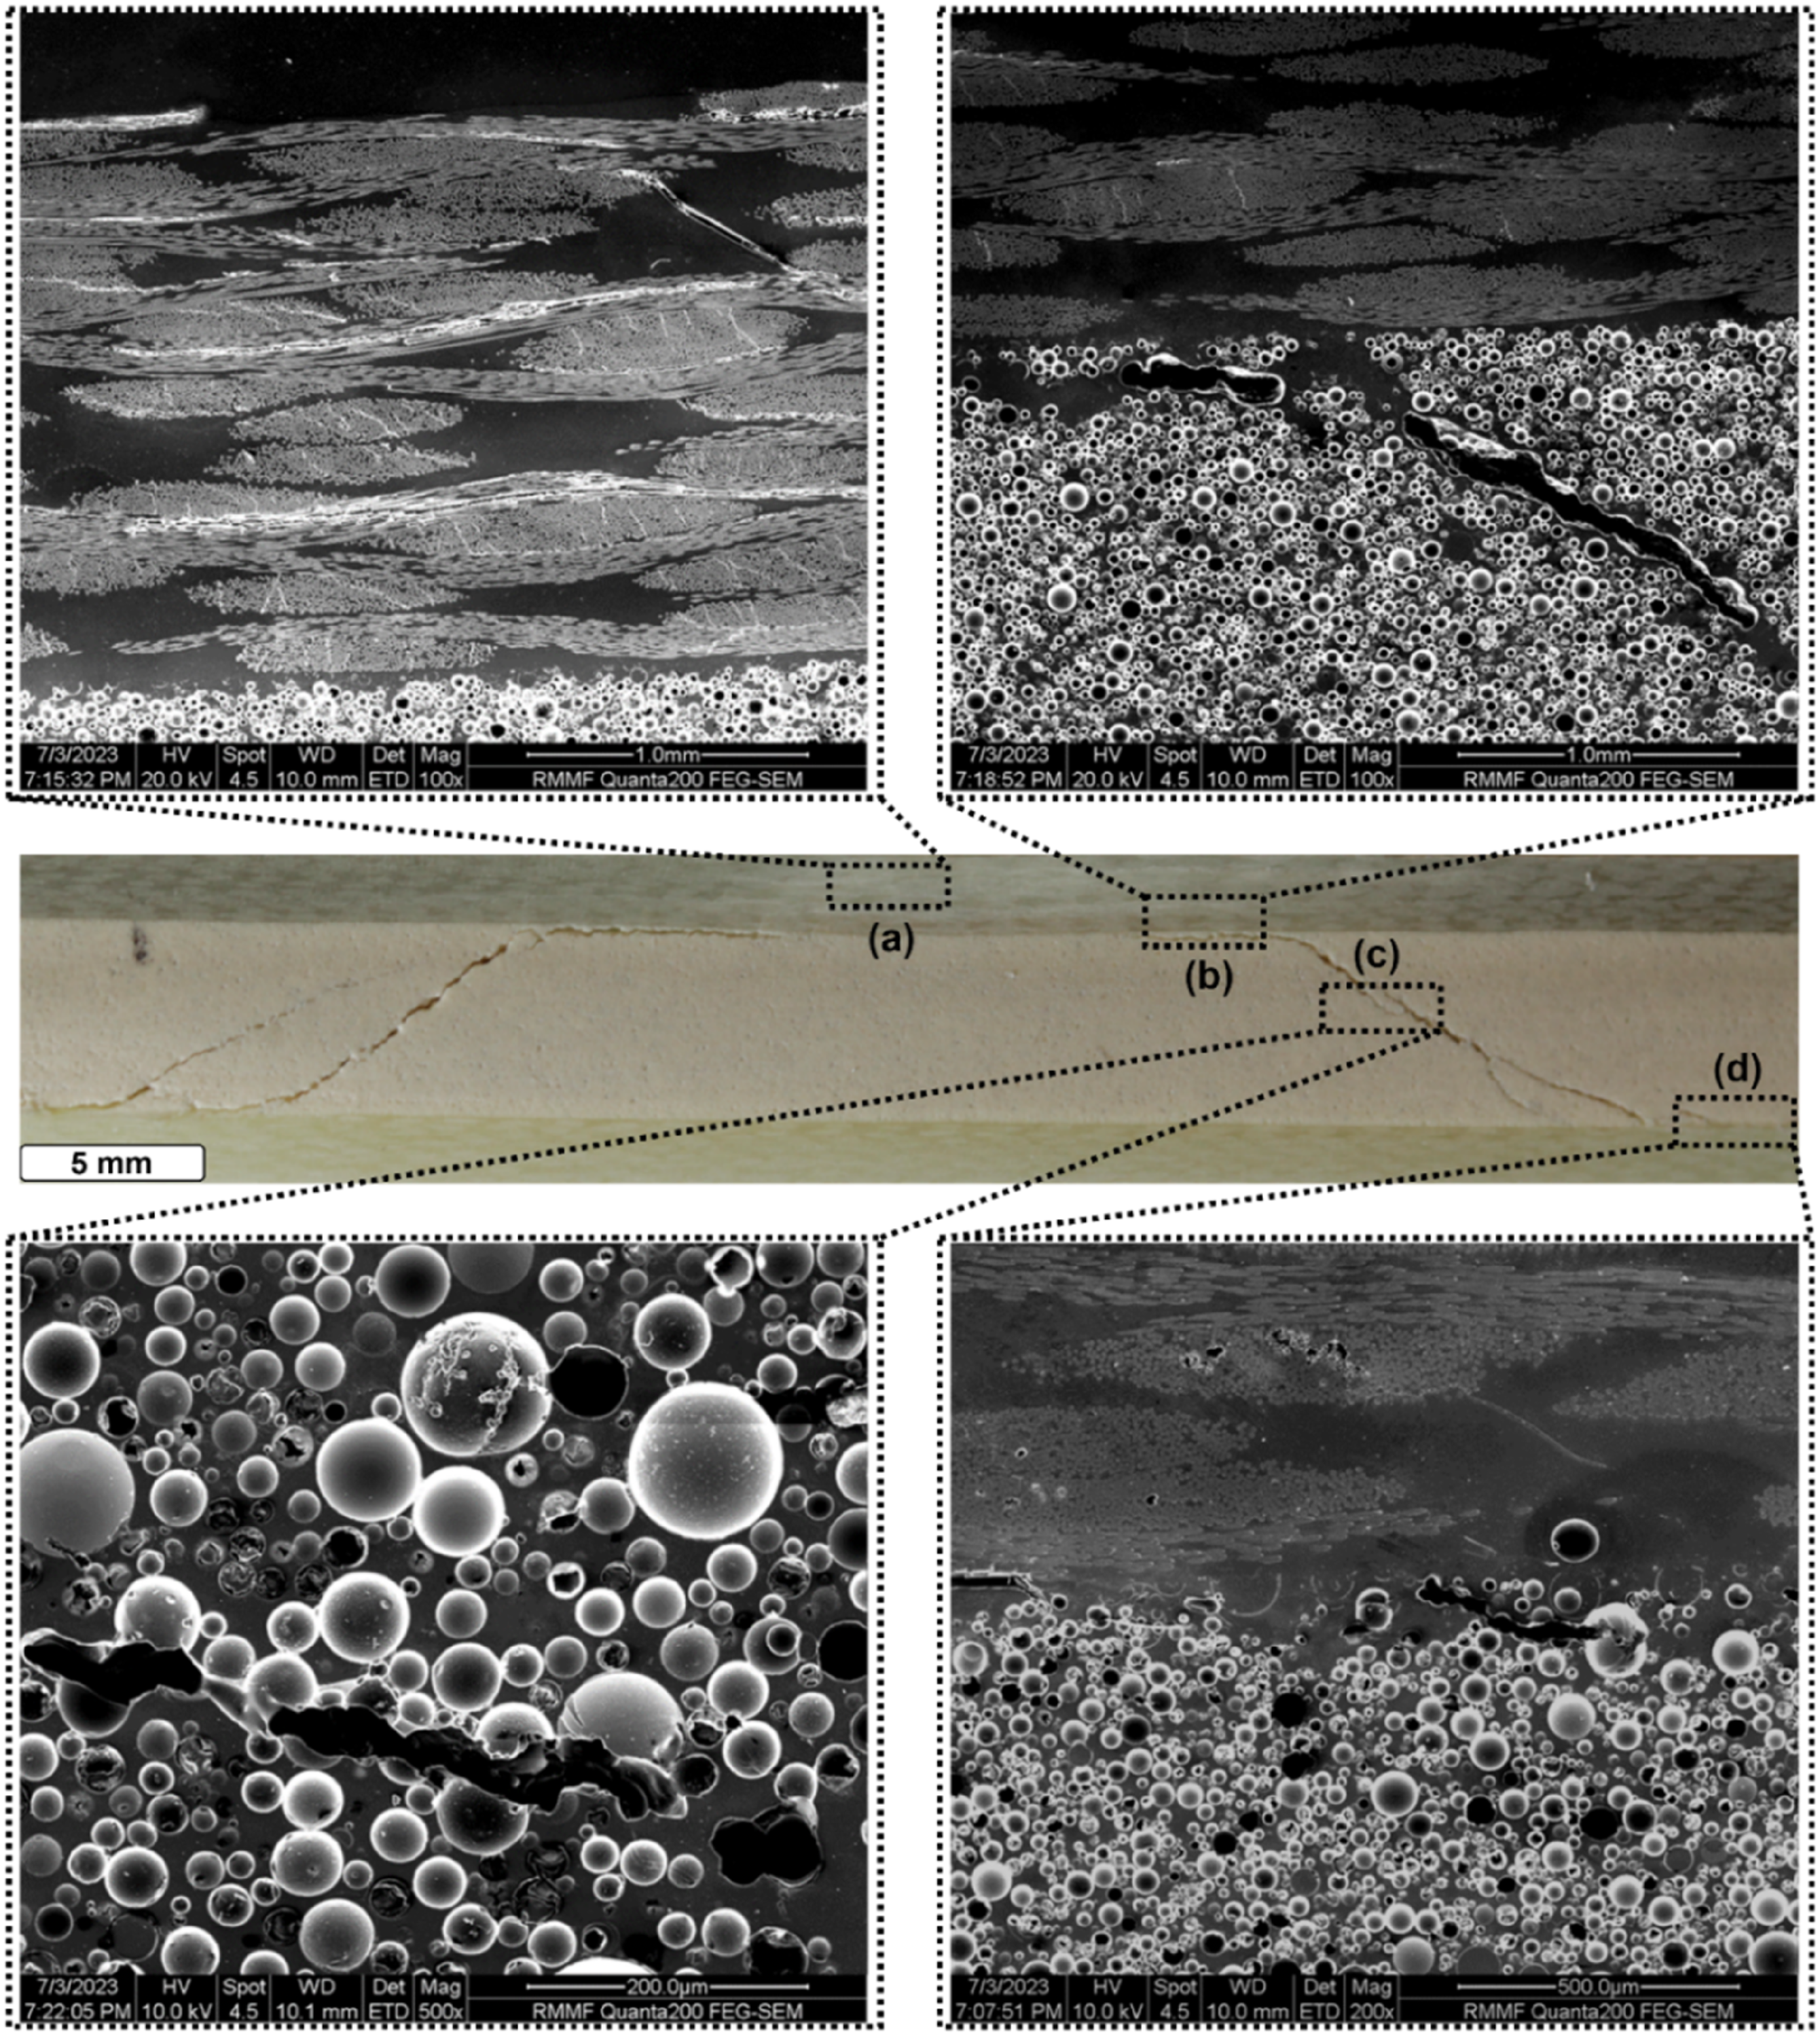
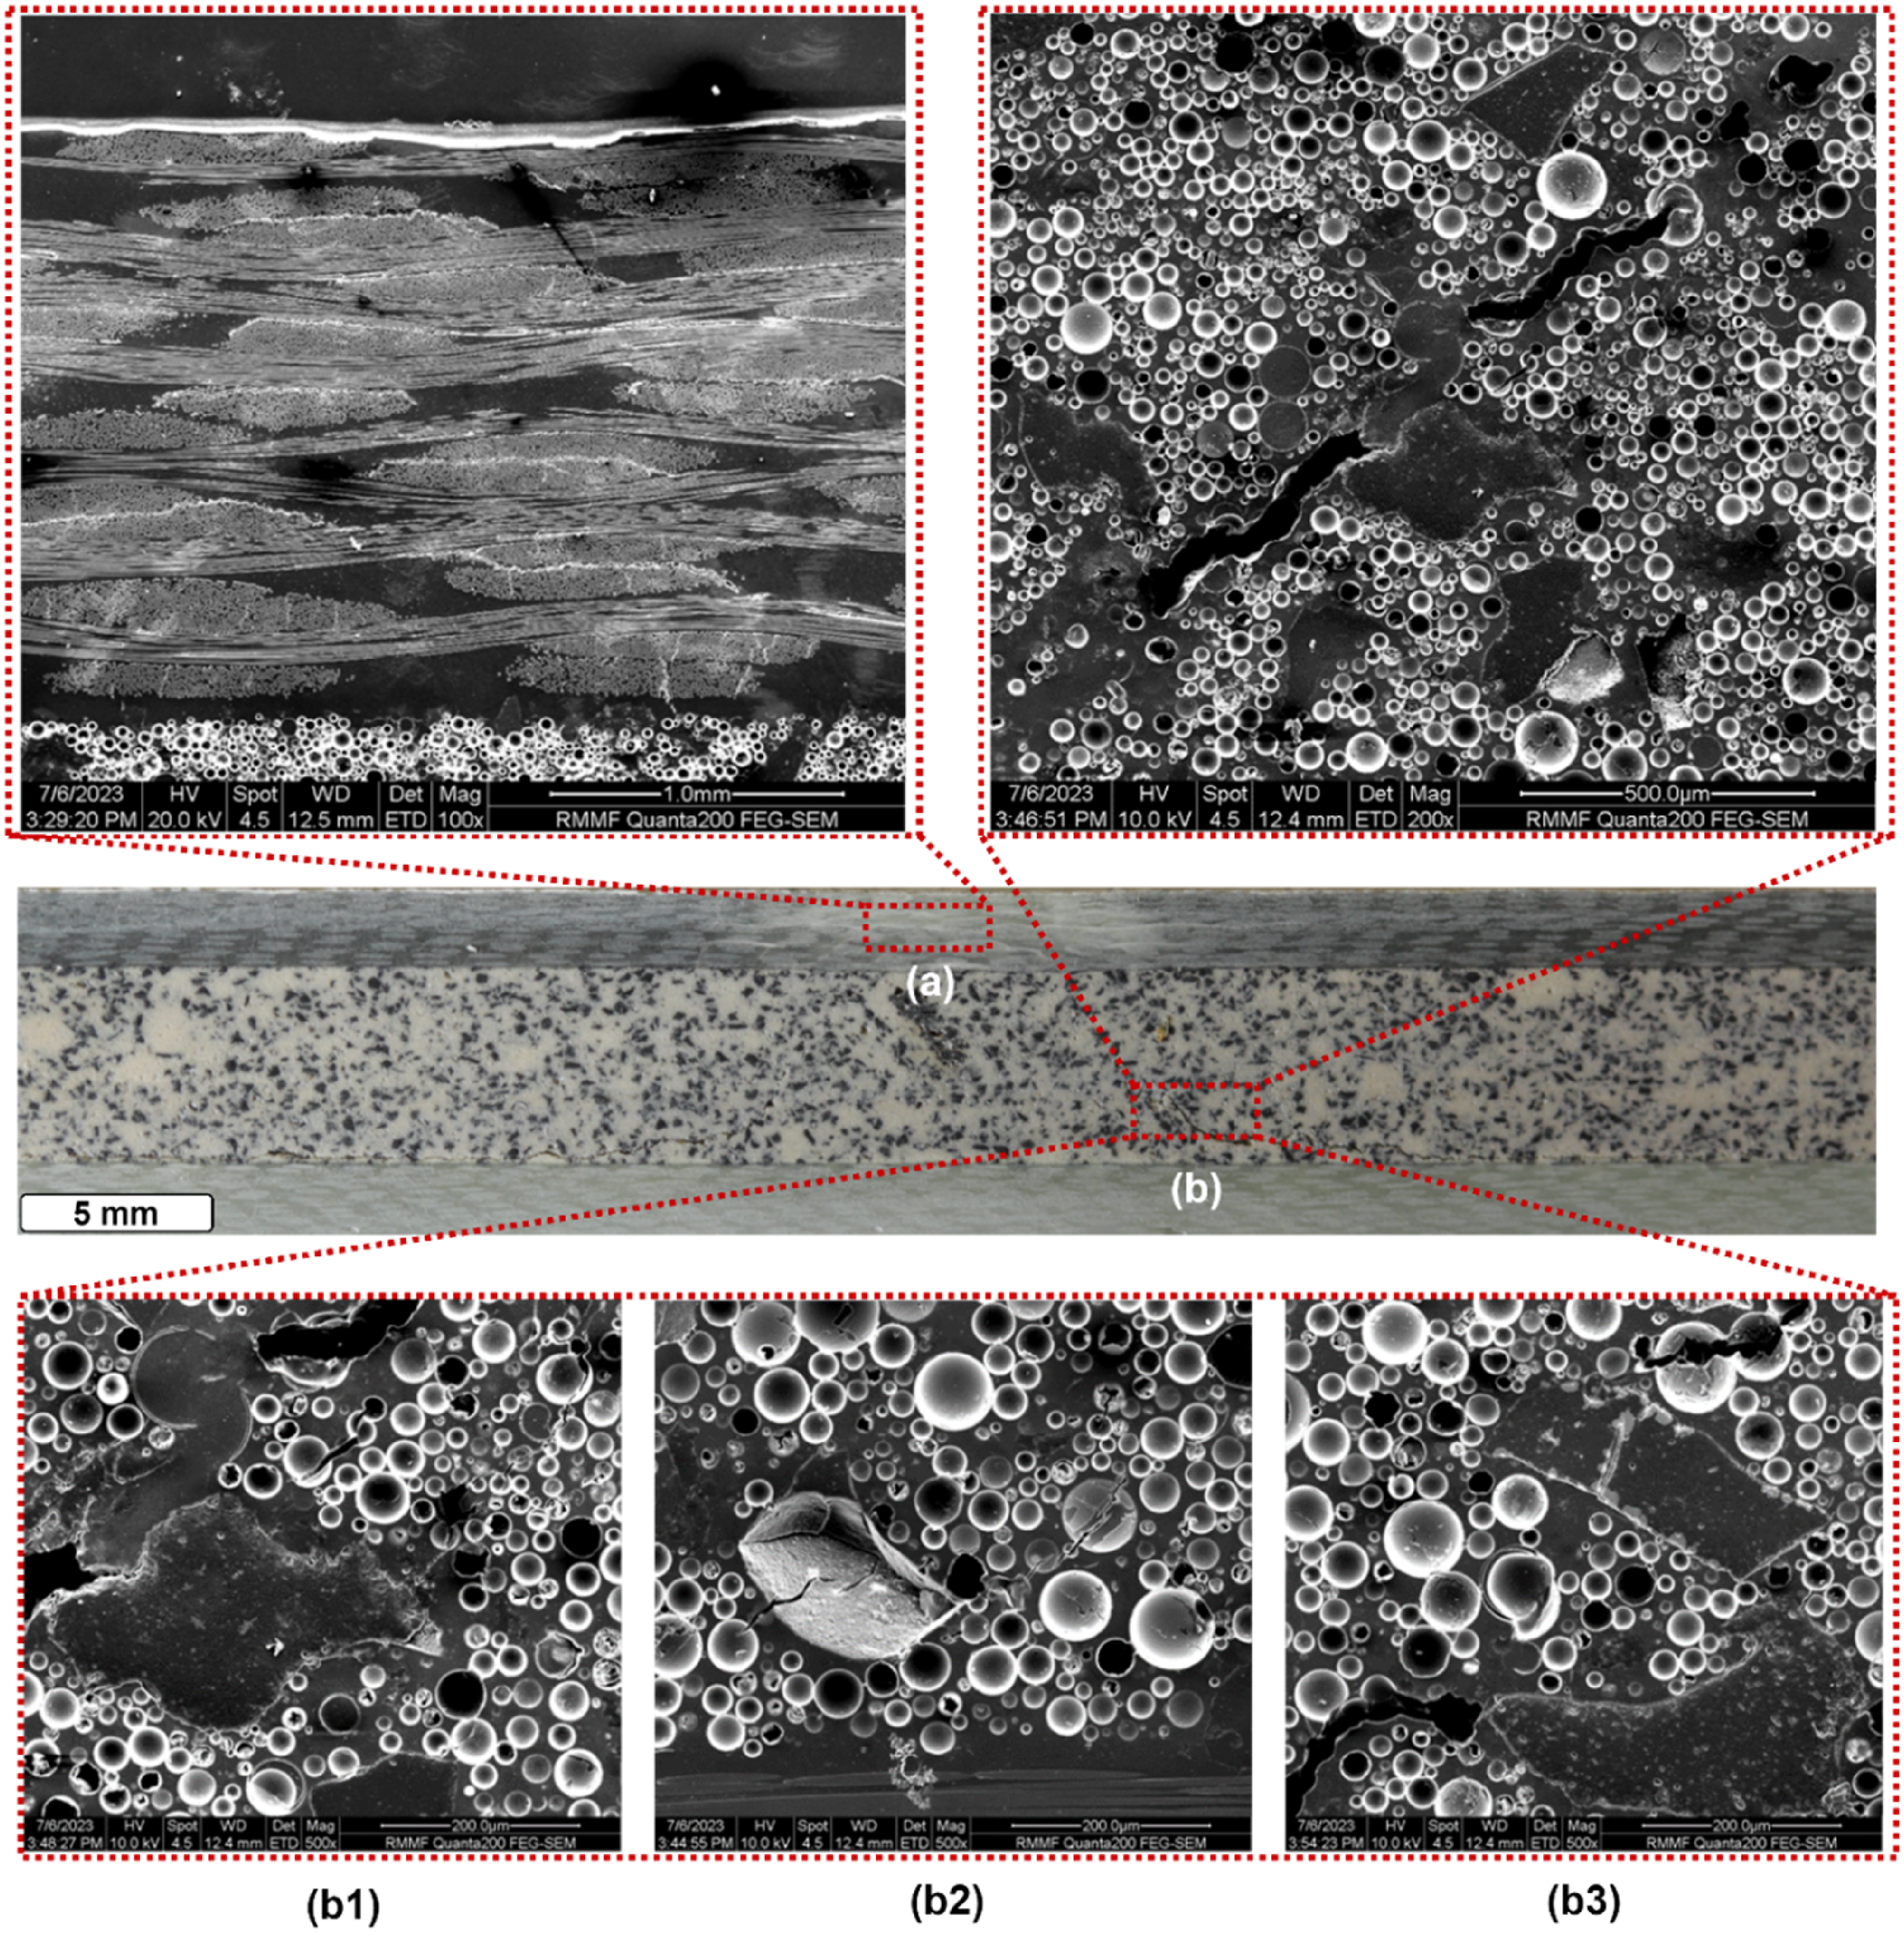
In addition to the shear core failure, there was evidence of delamination at the interface between the foam and the face sheet. The cone-shaped damage patterns within the foam core were similarly observed in composites incorporating rubberised foam, as shown in the CT image of SYN(1:5) in Figure 14. However, the damage area for the rubberised foam-core composites was noticeably smaller, suggesting an enhanced impact damage resistance. Fibre breakage, transverse cracking and interlaminar delamination were visible within the impacted face sheet laminate in both SYN(1:0) and SYN(1:5). Debonding was observed at both the top and bottom face sheet/core interfaces with bond line failure more pronounced in SYN(1:0) than SYN(1:5). In SYN(1:0) the core material failed via shear along ±45° direction relative to the loading direction. However, in the case of SYN(1:5), the crack followed a tortuous pathway. There is evidence of crack deflection and pinning due to rubber particles as shown in Figure 14 in agreement with findings reported by Kaynak et al. 45 for a similar composite system. Further, rubber/epoxy debonding was evident in the rubberised foam core providing a pathway for impact energy dissipation. The rubberised foam core appears to reduce the extent of impact damage possibly due to enhanced crack-arresting mechanisms, energy absorption capacities and viscoelastic characteristics of the rubber particles.
Compression tests were conducted to assess the effect of rubber particles on the pre- and post-impact in-plane compression properties of the foam-core composites.32,46 The pre- and post-impact stress-strain curves under in-plane compression loading are presented in Figure 15, while the derived pre- and post-impact in-plane compression properties are displayed in Figure 16. Strain values were derived from global displacement data measured using the DIC technique. The deformation behaviour of composites incorporating unmodified and rubberised foam was both before and post-impact. There were no statistically significant differences in the in-plane compression strength and modulus values measured before impact for composites with and without rubber particles, as shown in Figure 16. In-plane compression stress-strain curves of (a) pre-impact, (b) post-impact composites. Insert in (b) shows the boundary conditions for the CAI test. The effect of the rubber content on the (a) compression strength and (b) compression modulus of pre- and post-impact foam-core composites.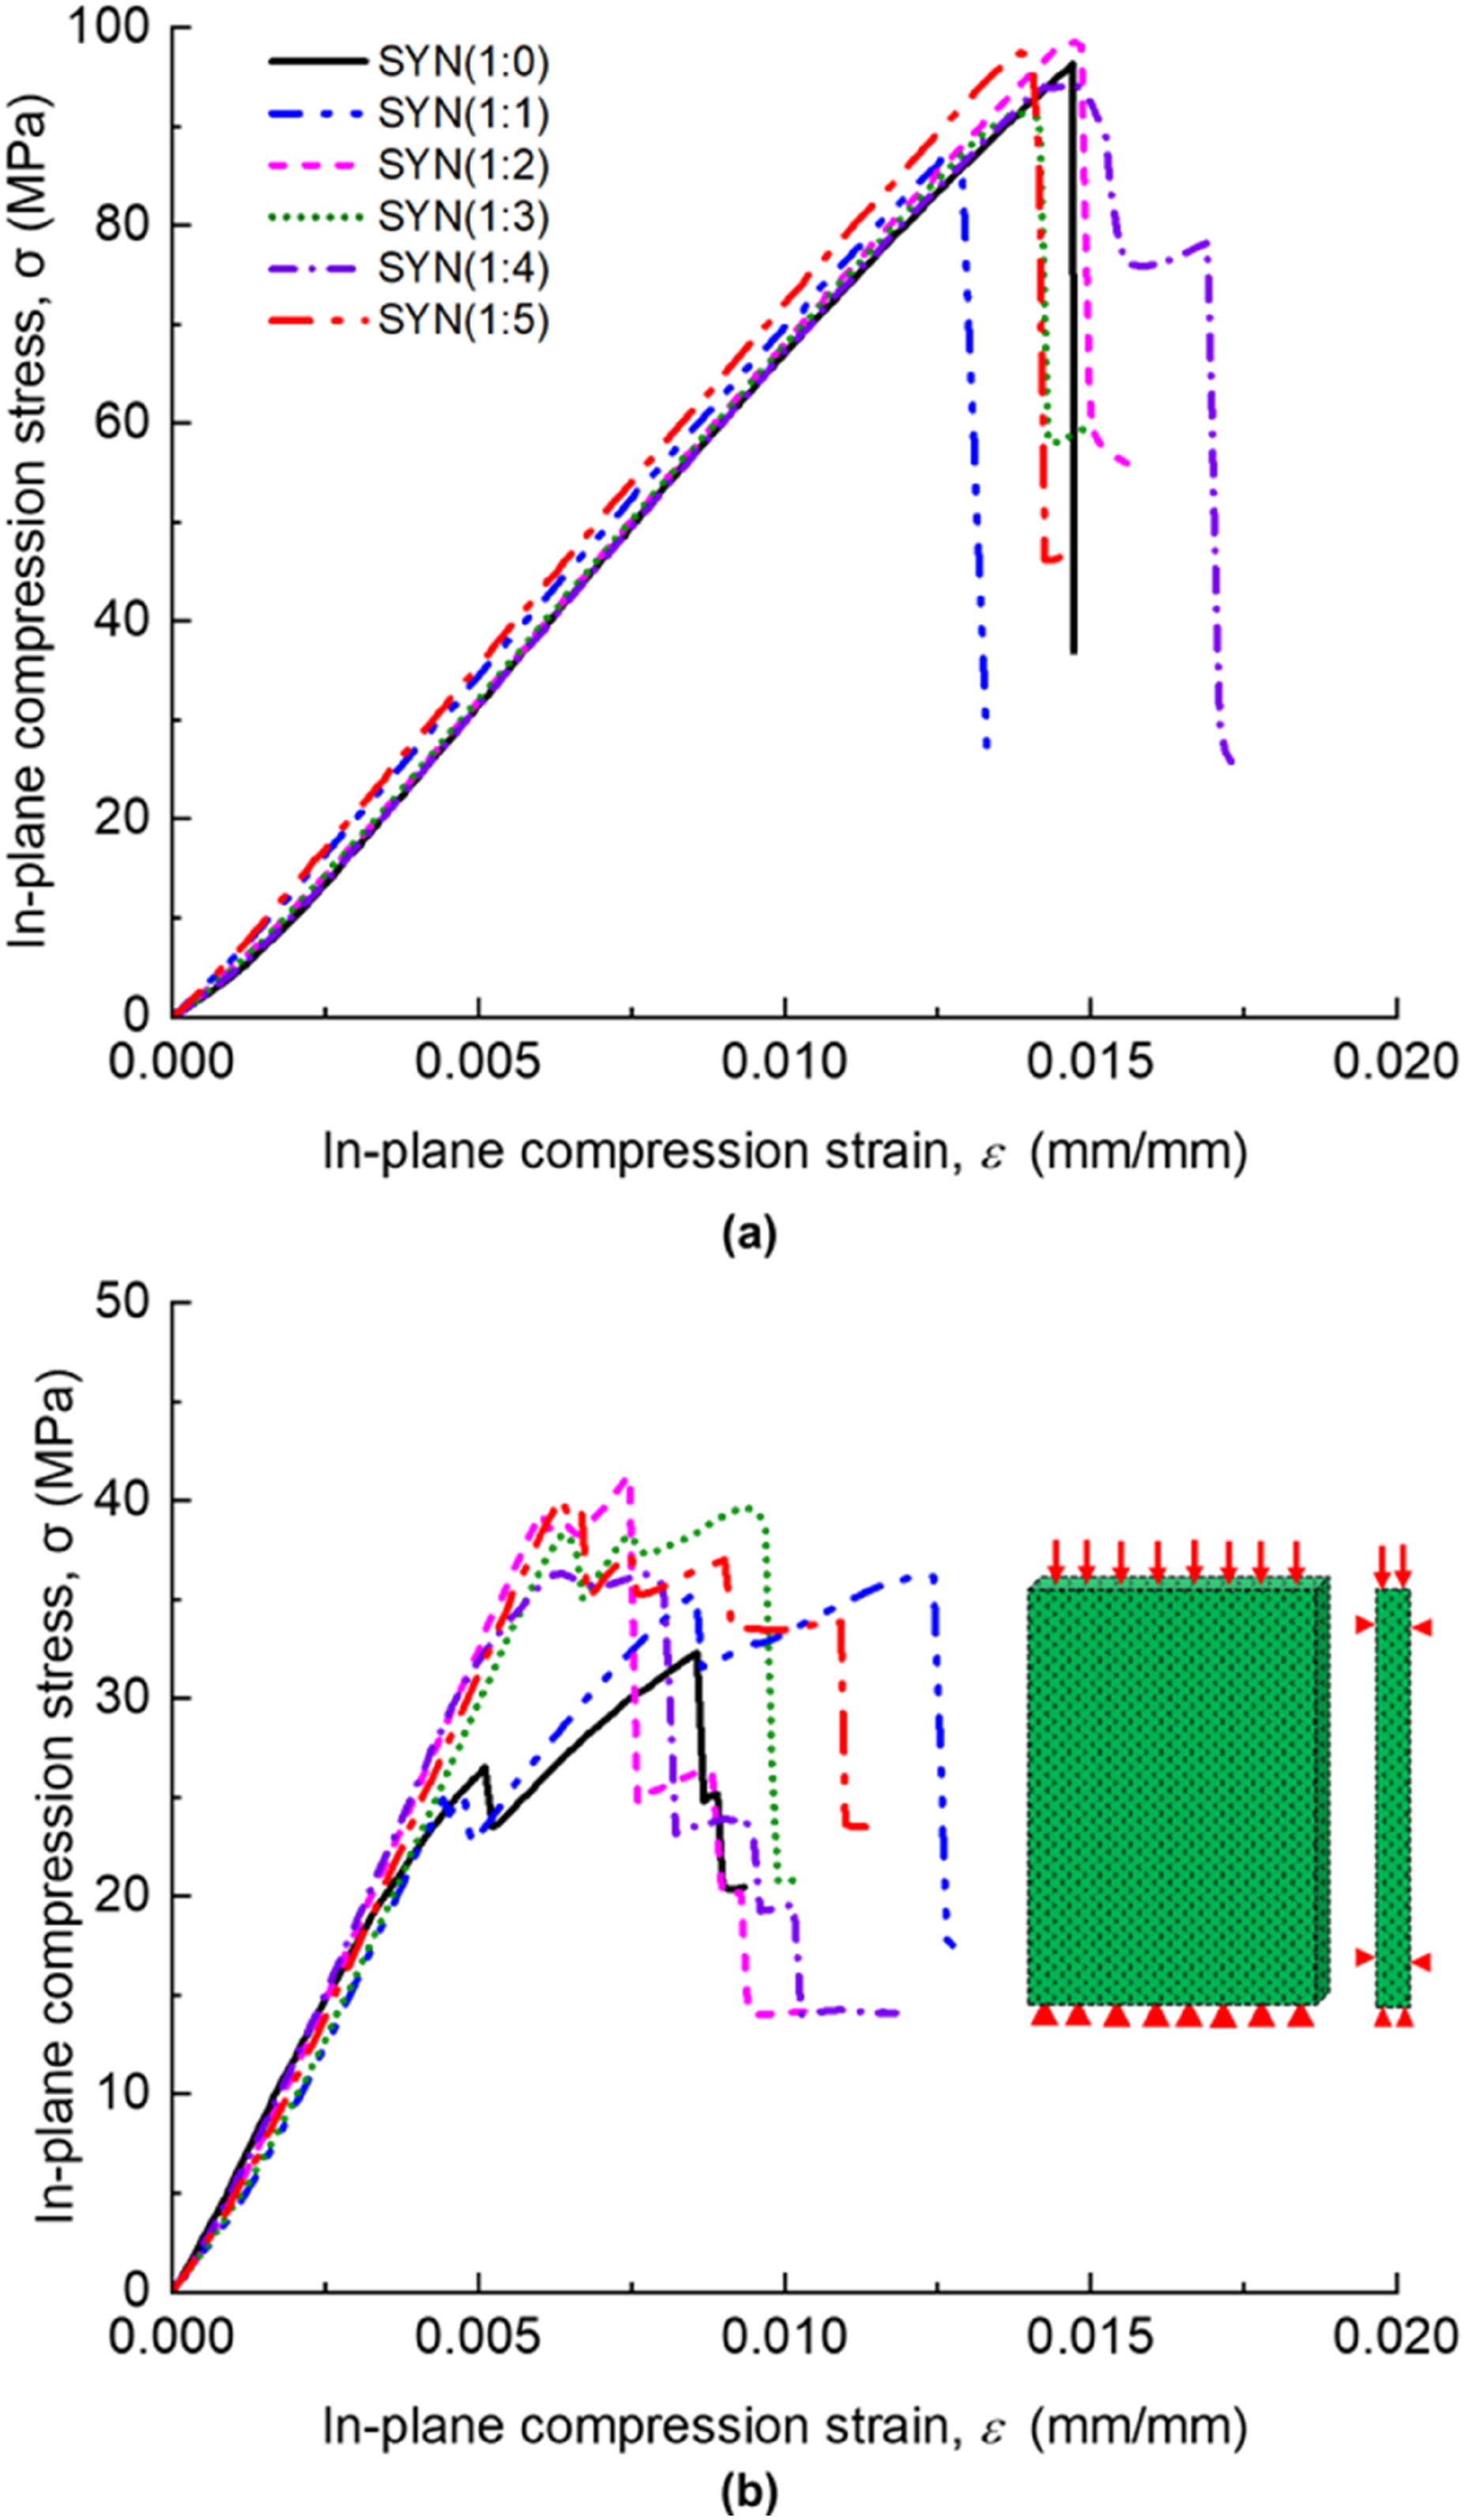
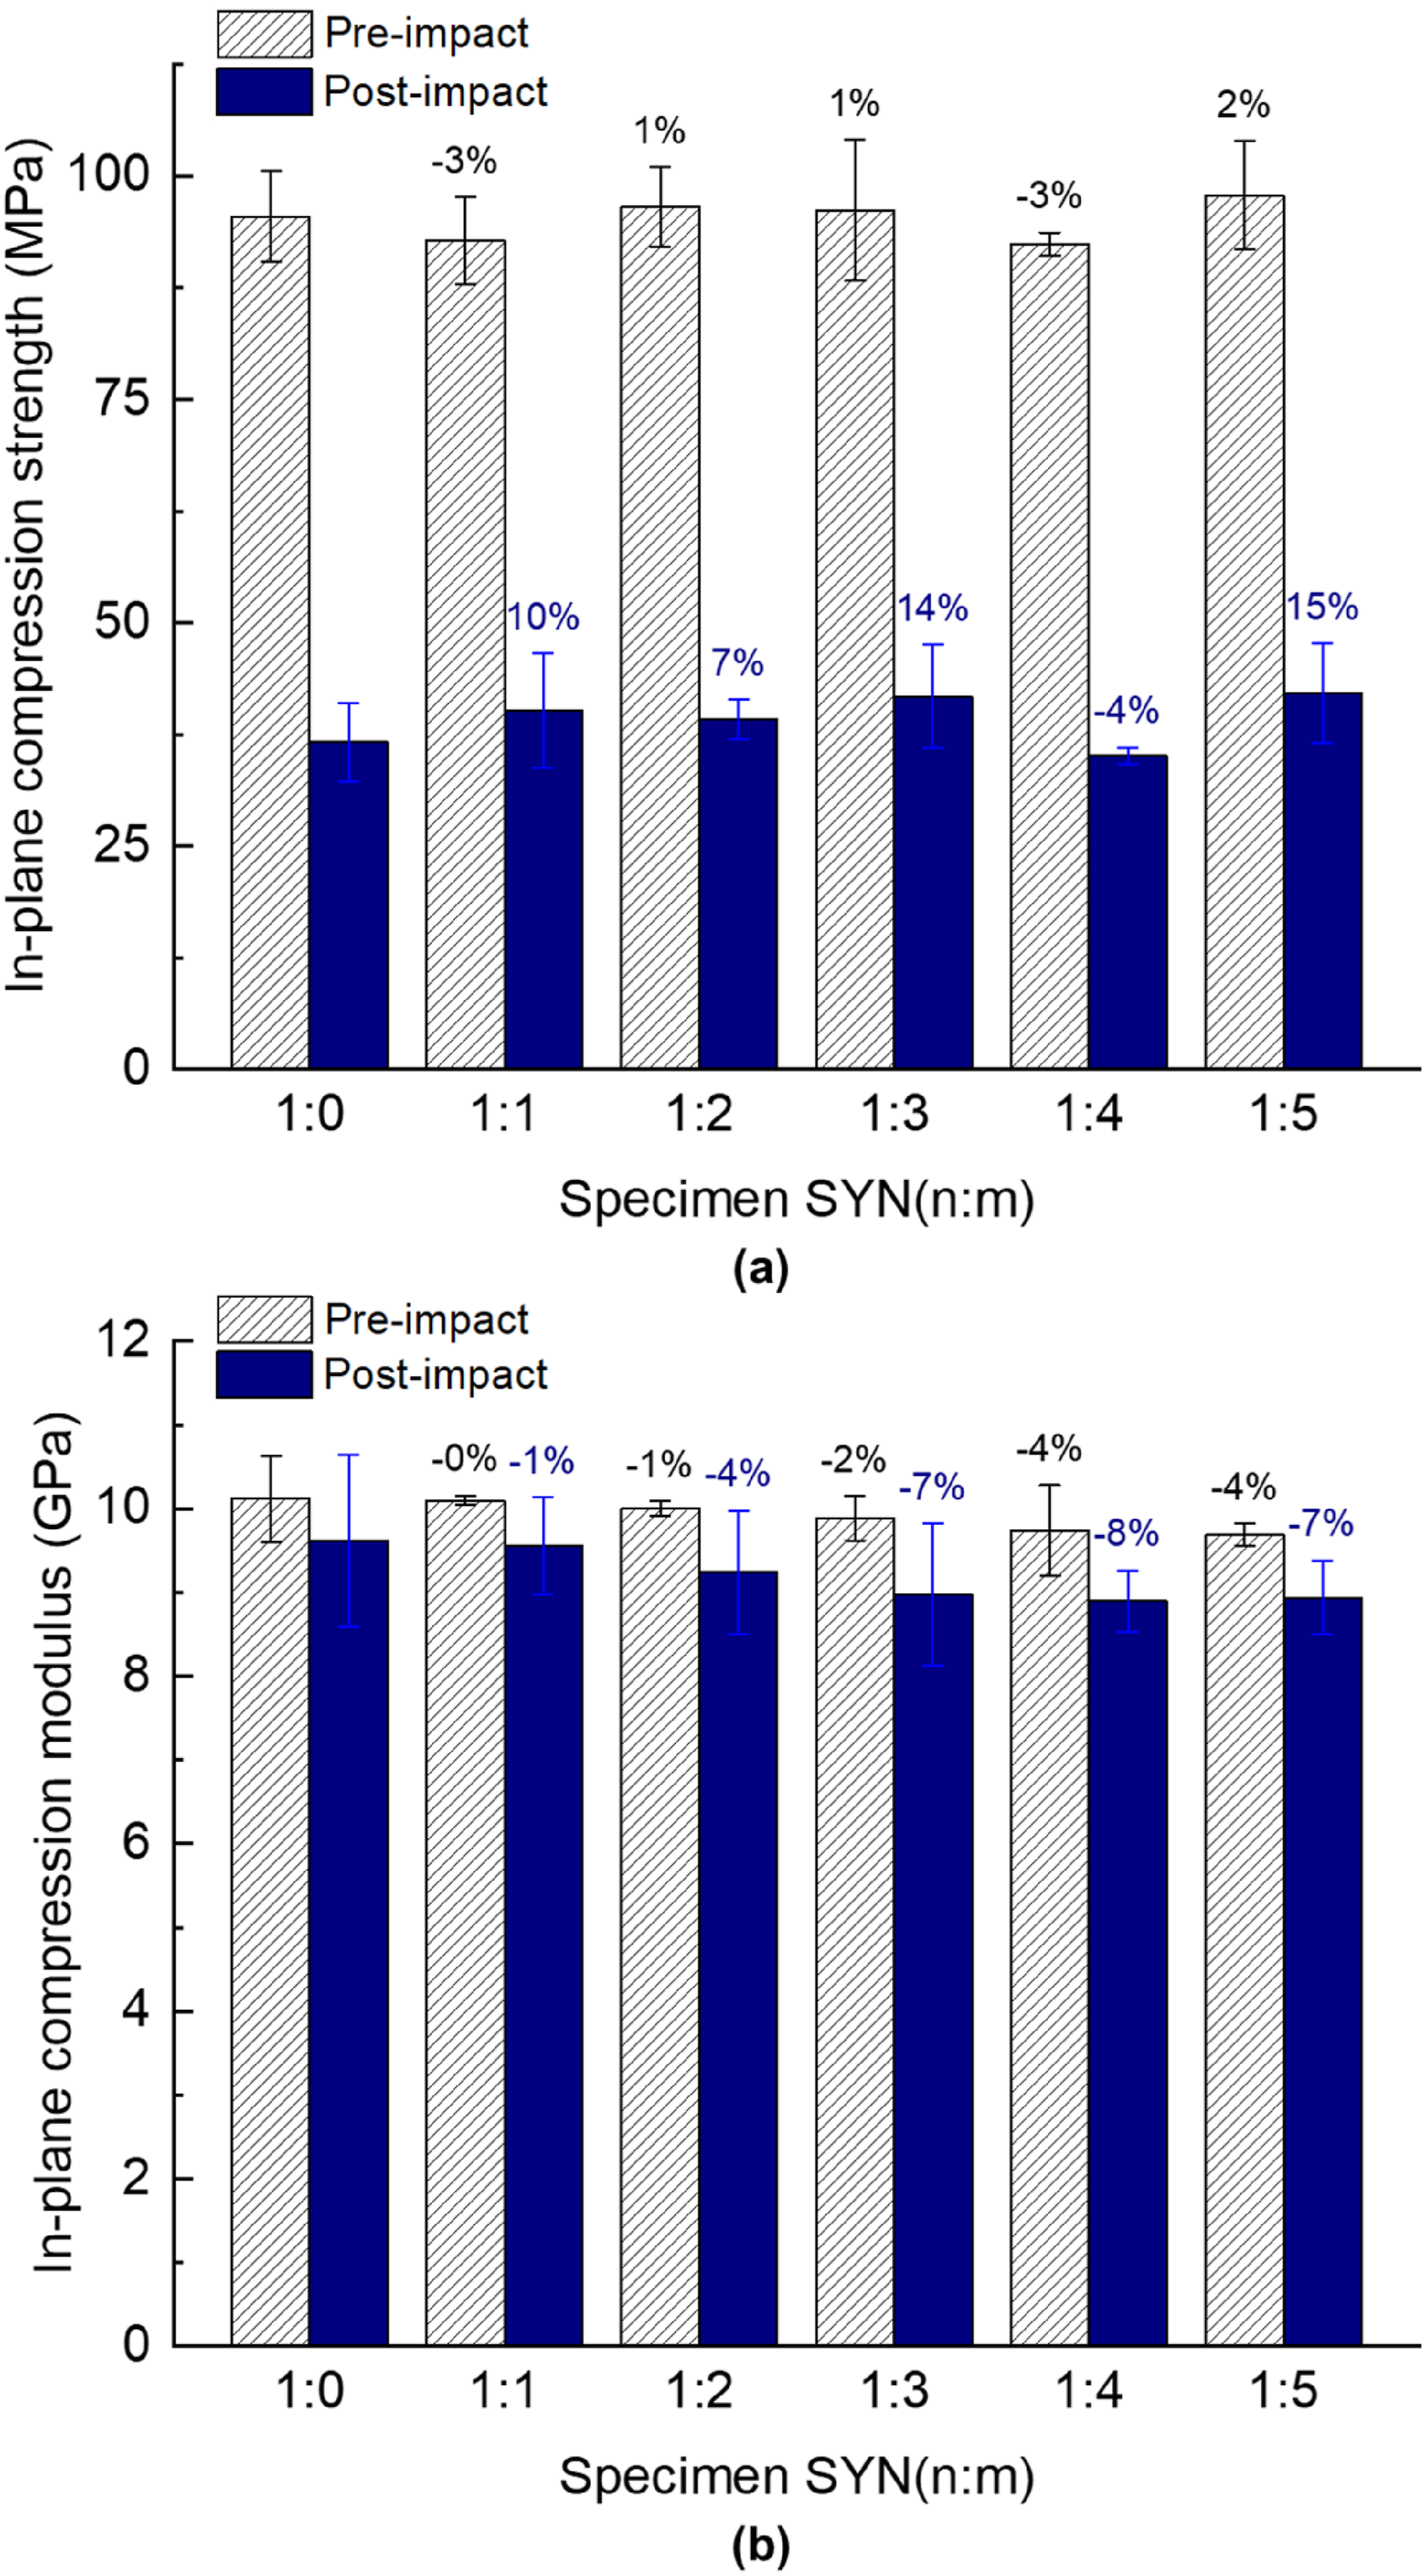
The compression strengths and moduli of rubberised foam-core composites were within ±4% of the baseline composite, SYN(1:0). These results suggest that the glass/epoxy face sheet laminates carried most of the in-plane compression loads. Upon impact damage, the in-plane compression strength of the baseline composite decreased by 62%. Similar reductions in the in-plane compression strength, between 57% and 62%, were recorded for the rubberised foam core composites. This observation, which was similar to the case of in-plane compression properties before impact, suggests a limited contribution to the composite performance by the foam core. The post-impact in-plane compression modulus was between 5% and 9% lower than the pre-impact values. Despite delamination at the face sheet/core interfaces, the modulus of the impacted composites was comparable to that of the pre-impact specimens. Factors contributing to the observed constancy in modulus of elasticity despite the bondline failure include: (i) the relatively small delamination area and (ii) the redistribution of the applied compression load through unaffected composite regions.
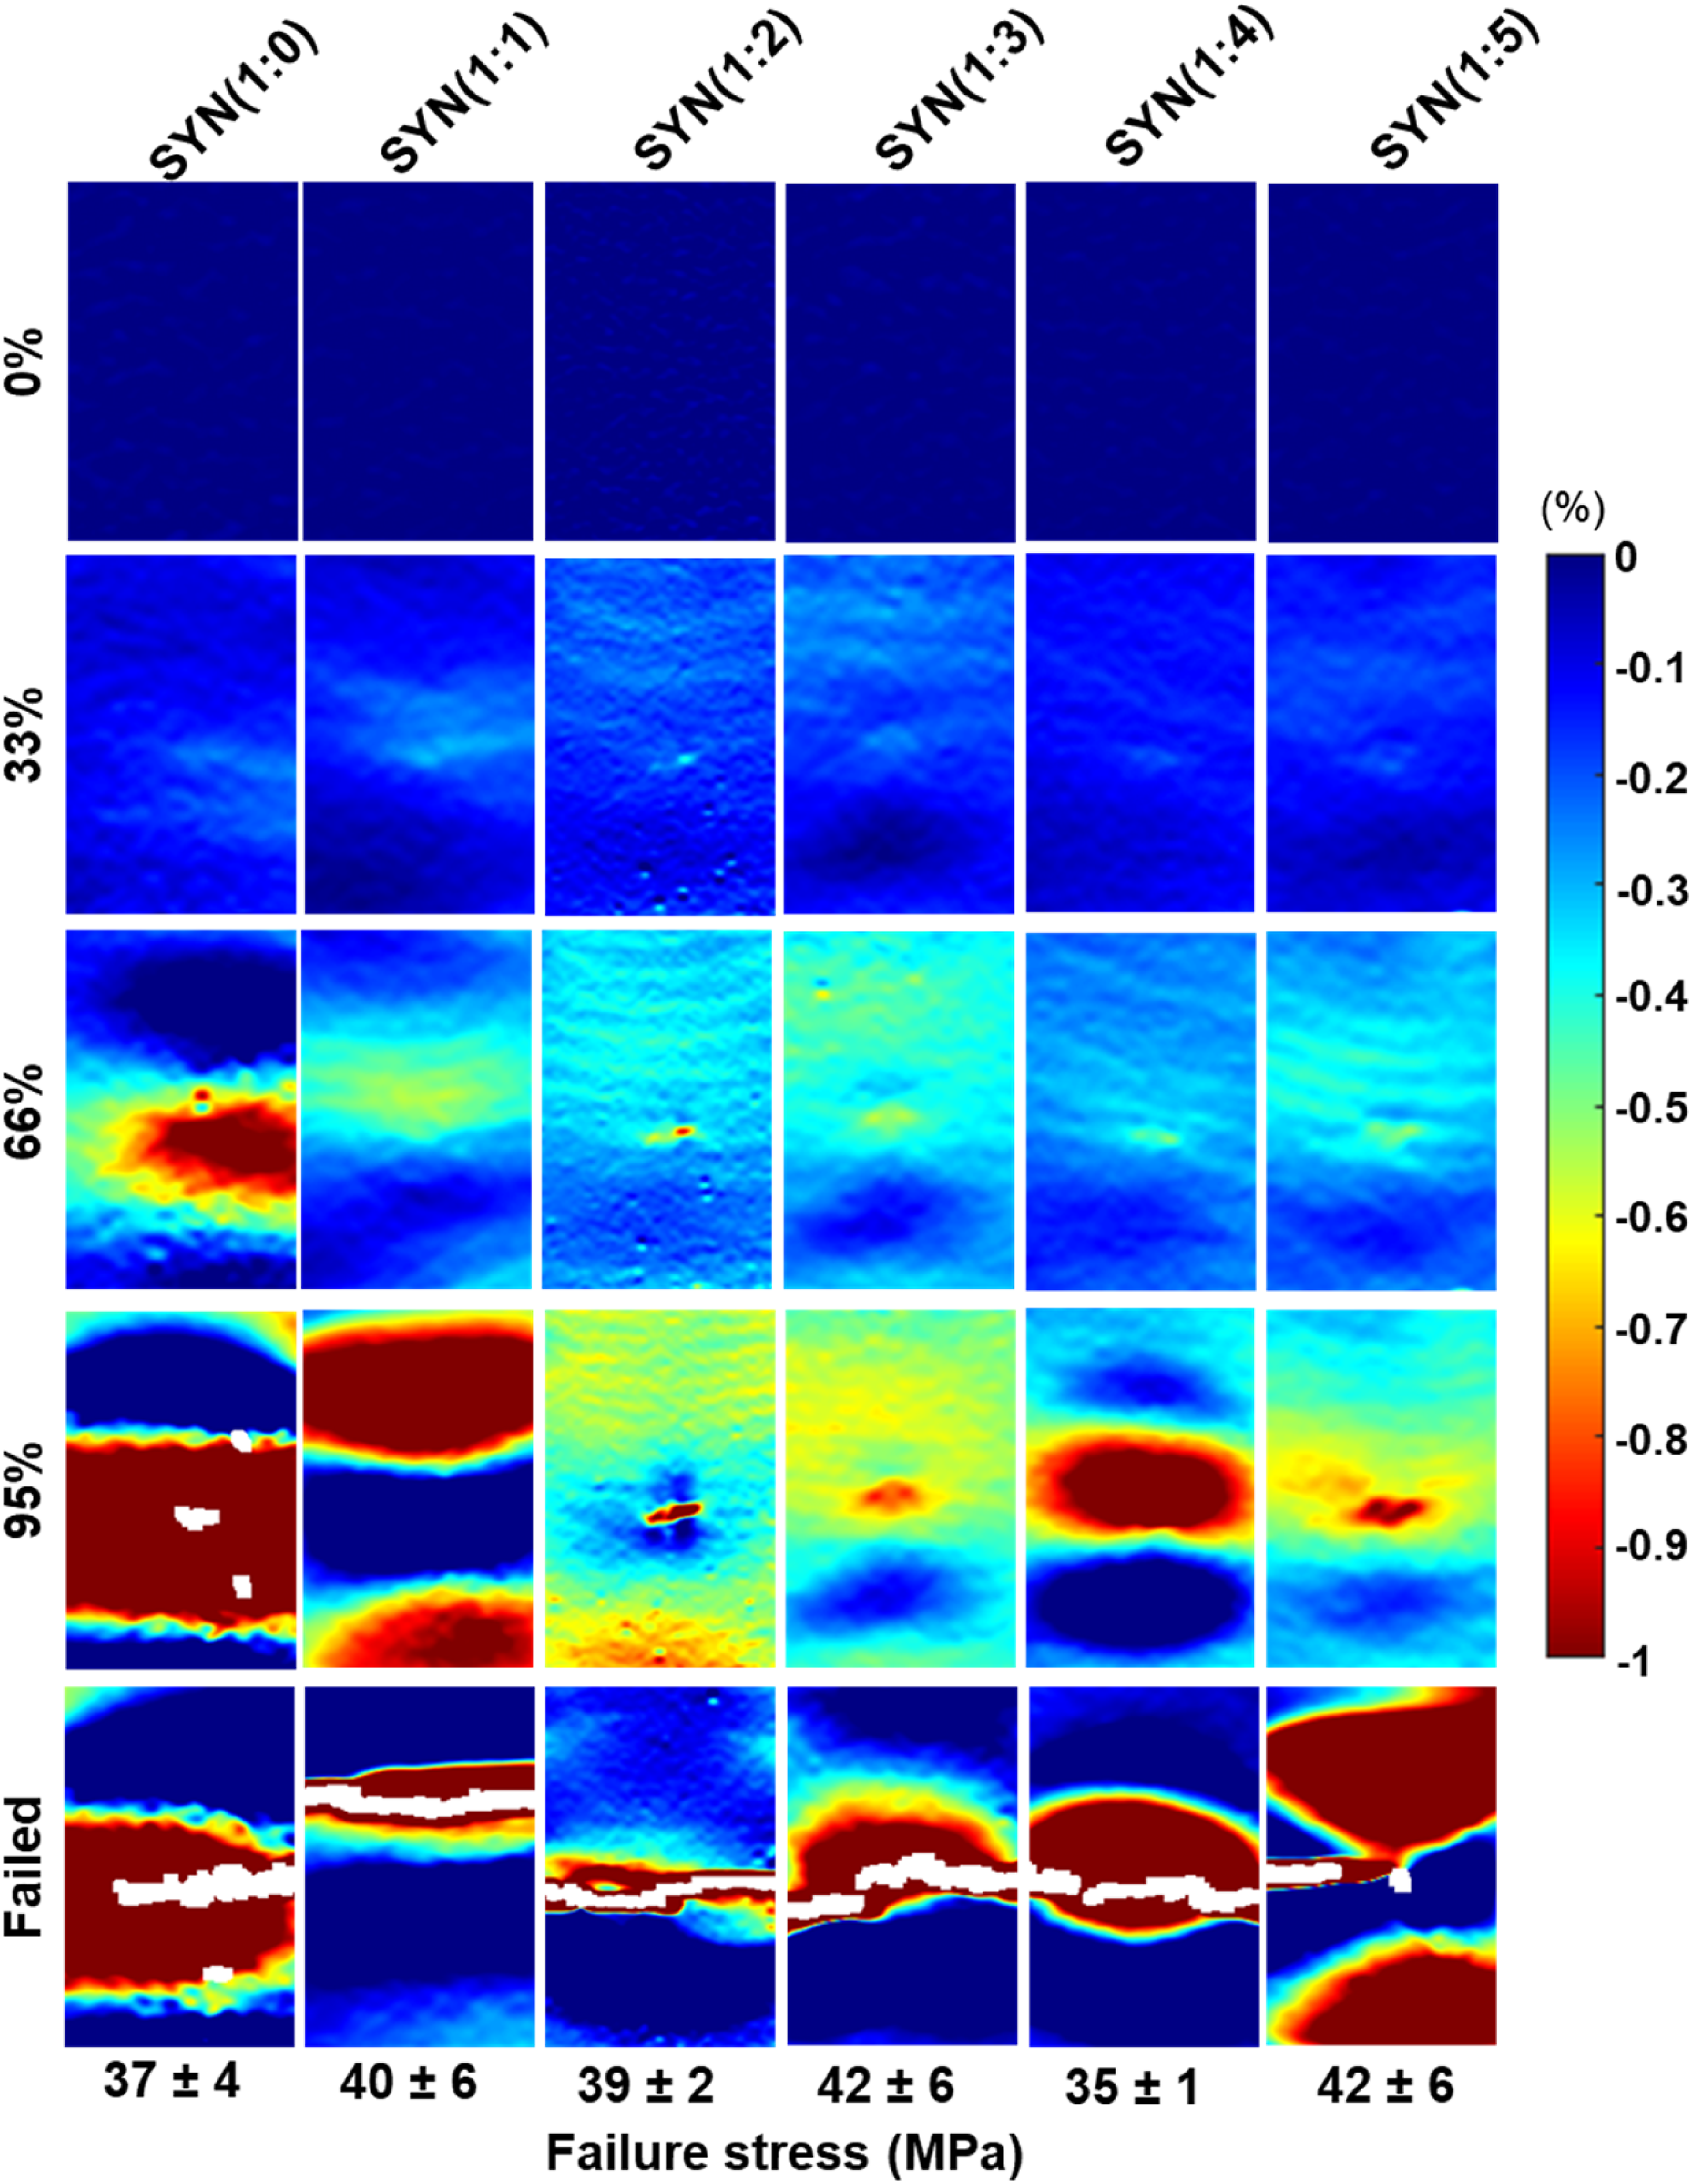
The progression of damage in pre-impact composites was tracked using DIC field strain maps at 33%, 66%, and 95% of the compression failure strength, as depicted in Figure 17. Before discussing the DIC strain evolution, it important to note that the recorded strain can be influenced by out-of-plane displacements. Therefore, the strain maps presented in this paper, especially closer to the ultimate failure, primarily provides qualitative insights into the deformation field under compression. The DIC field maps indicated uniform stress distribution, implying uniform dispersion of manufacturing defects. Failure in pre-impact specimens occurred at random locations across the specimens primarily due to kinking failure of the GFRE face sheets. Strain uniformity across different configurations of the pre-impact specimens suggest that the inclusion of rubberised foam core materials in foam-core composites has little effect on the in-plane compression response. In contrast, the DIC strain field maps revealed stress concentrations (blue regions) near the impact site, as shown in Figure 18. Ultimately, all impact damaged specimens failed along the mid-section within the impacted region. Pre-impact DIC illustrations of the strain field maps of the representative GFRE foam-core composites with and without rubber particulates syntactic foam core. Images are shown at applied compressive loads of 0%, 33%, 66%, and 95% of the composite failure strength shown at the bottom of each column. The scale bar on the right represents the normalised strains benchmarked against the highest strain value measured. Post-impact DIC illustrations of the strain field maps of the representative GFRE foam-core composites with and without rubber particulates syntactic foam core. Images are shown at applied compressive loads of 0%, 33%, 66%, and 95% of the composite failure strength shown at the bottom of each column. The scale bar on the right represents the normalised strains benchmarked against the highest strain value measured.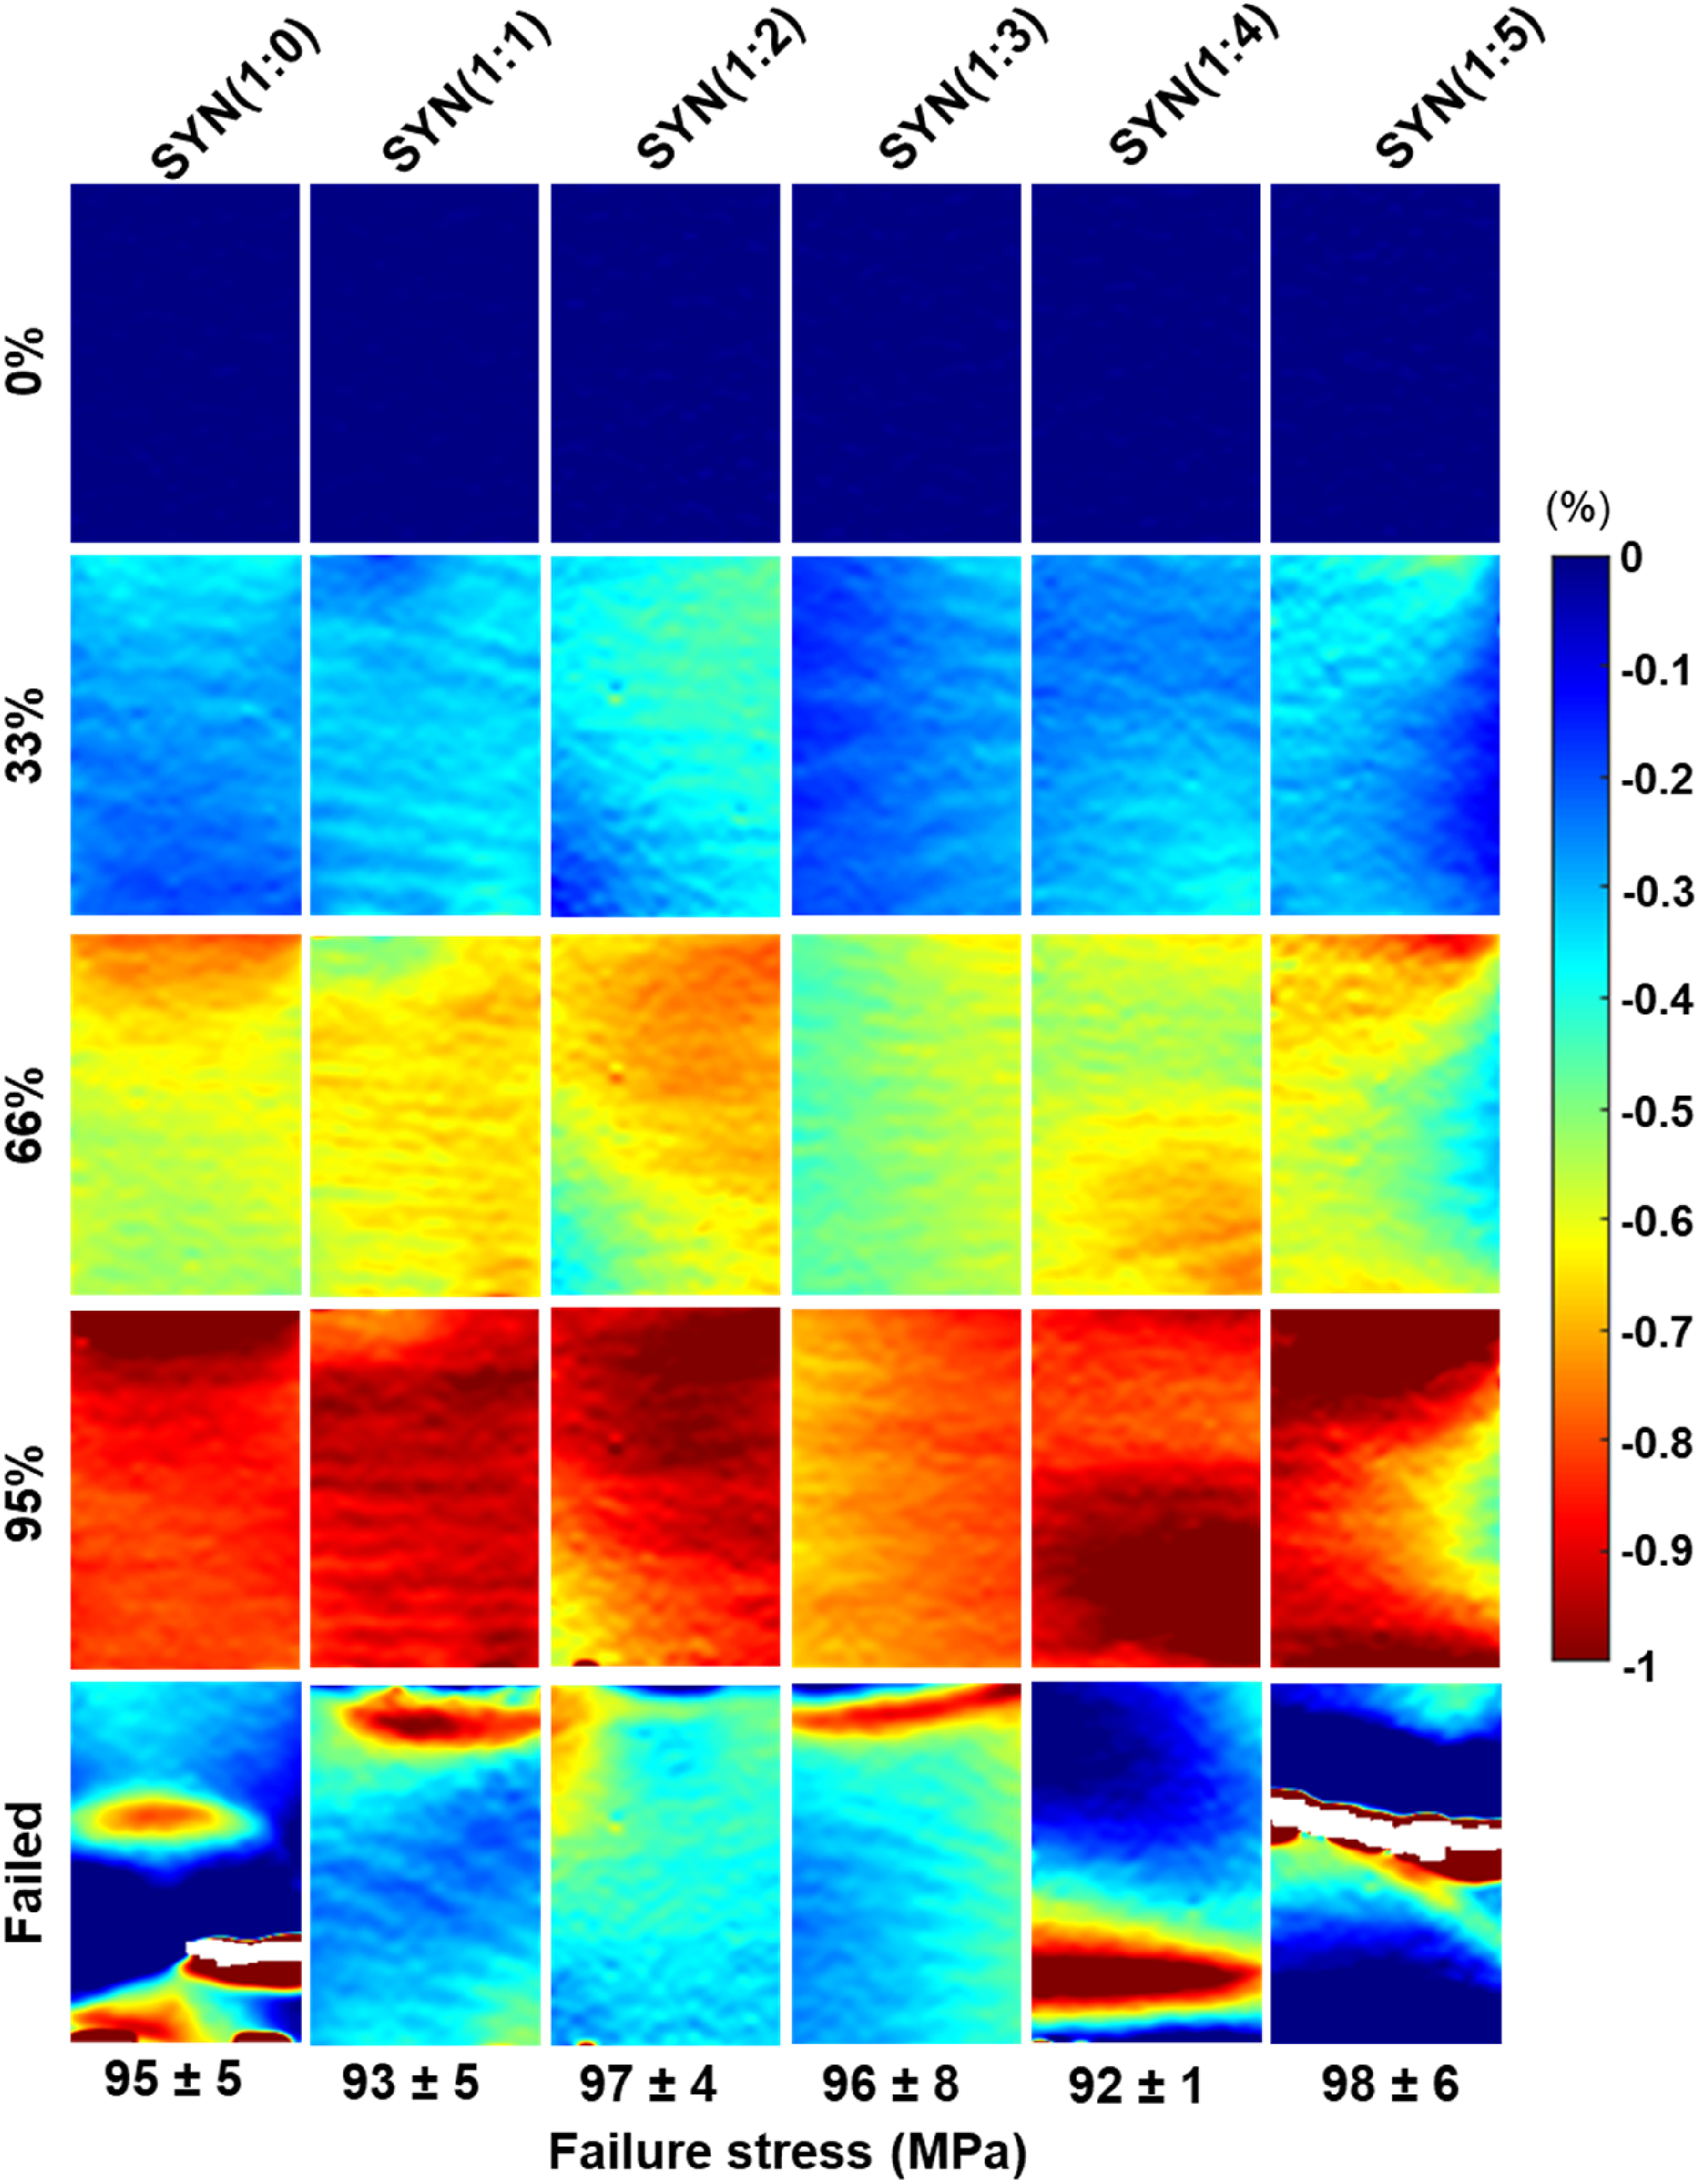
Conclusion
This study investigated the role of a rubberised foam core on the LVI response and CAI properties of sandwich composites with GFRE face sheets. VARTM was used to manufacture rubberised syntactic foam, achieving a void content of under 2 vol% and a maximum rubber concentration of 33 wt.%. The compression strength and modulus of the rubberised foam decreased with increasing rubber content. Poor rubber/matrix interfacial bonding and relatively low rubber stiffness were implicated for the compression property reduction in rubberised foam.
Integrating rubber particles into the core material of foam-core composites led to substantial reductions in the maximum peak force during impact. The apparent delamination area measured for the rubberised foam-core composite incorporating the highest weight fraction of rubber particles, SYN(1:5), was around 60% lower than measured for the baseline composite without rubber particles. The presence of the rubber phase did not affect pre-impact compression properties since the load-bearing elements were the GFRE face sheets. Yet, post-impact compression tests revealed slightly higher residual compression strength in rubberised foam-core composites, attributed to diminished delamination and foam damage. There were marginal reductions in the compression moduli of the impact-damaged composites. There was no statistically significant variation in the residual compression modulus with the varying rubber content suggesting that the modulus of elasticity of impact-damaged foam-core composites was largely dictated by the residual stiffness of the GFRE face sheets. Moreover, the damage due to impact was too small to affect the overall stiffness of the composites. DIC provided visualisation and quantification of the global strain evolution during pre- and post-impact in-plane compression tests. Ultrasonic immersion testing sized the impact delamination to within ±12% of that measured via sectioning. Microscale interactions between rubber particles and the epoxy matrix were enabled by X-ray CT scanning allowing for the establishment of the microstructure-mechanical property response of rubberised foam and its sandwich composite.
The insights from this study shed light on the sustainable management of scrap tyres by integrating derived rubber particles into foam-core composites. Additionally, the creation of value-added, sustainable, and affordable composite structures with enhanced impact resistance opens opportunities for diverse engineering applications.
Footnotes
Author contributions
Nathaphon Buddhacosa (N.B.) and Everson Kandare (E.K.) conceived the research idea. N.B. conducted research activities including foam and composite fabrication, scanning electron microscopy, and compression tests. Chananya Charnsethikul (C.C.) and Parichamon Santivongskul (P.S.) manufactured the foam and the foam-core composites working closely with N.B. Matthew Ibrahim (M.I) conducted C-scan experiments to assess impact damage in foam-core composites. Akbar Khatibi (A.K.) and E.K. provided technical guidance in setting up and execution of experiments. N.B. and E.K. drafted the manuscript and all the other authors; M.I., A.K., C.C., P.S., and Raj Das (R.D.) reviewed and provided feedback. E.K. acquired the research funding. A.K., E.K. and R.D. were academic supervisors to N.B’s doctoral research.
Declaration of conflicting interests
The author(s) declared no potential conflicts of interest with respect to the research, authorship, and/or publication of this article.
Funding
The author(s) disclosed receipt of the following financial support for the research, authorship, and/or publication of this article: Nathaphon Buddhacosa reports financial support was provided by Tyre Stewardship Australia (INT-1175).