
Abstract
The integration of inserts into sandwich panel constructions is a complex multi-step process with significant human intervention that also limits the geometrical freedom of the insert design. In a standard sandwich construction, the panel core is made up of multiple materials across its main components: insert, potting and core. This multi-material assembly is not only difficult to manufacture, but it also promotes stress jumps at the insert-core interface, leading to a sub-optimal load distribution from the bolt to the panel core. Additive manufacturing (AM) can lead to a single-part core and insert assembly with more optimised insert geometries that can better transmit the loads applied to the panel. Previous work by the authors has explored the manufacturing limits and the failure modes of AM inserts integrated in cores printed out of sintered AlSi10Mg. The conclusions were that the core walls and insert elements should have a minimum design thickness of 0.5 mm to survive the tapping process without facesheets attached and it was found that the main failure mode of the geometries tested in pull-out was buckling of the insert walls. Based on these results, the paper proposes a novel insert design philosophy that can delay the buckling of 3D printed inserts and move the failure point of the insert away from the bolt. A set of inserts that follow this design direction is manufactured and tested under normal pull-out loads and the optimised designs outperform standard printed insert geometries by a factor of three. The design philosophy can be further developed to offer a suitable alternative to the current insert standard.
Keywords
Introduction
The design of sandwich panel inserts has remained mostly unchanged over the last few decades, but additive manufacturing (AM) has opened up a wide range of design philosophies that can improve on the current potted insert. The manufacturing process of standard sandwich cores does not allow for design changes across the panel unless honeycomb cores of different cell sizes are glued together, which could lead to a sub-optimal structure. At the same time, the insert geometry is fixed due to its integration requirements and it is far from optimised in terms of load transfer into the core.
It has been shown that significant stress jumps occur at the insert- core interface due to material discontinuity caused by the presence of the insert.2,3 This promotes a common failure mode for both hot and cold bonded inserts: honeycomb core failure by shear buckling of the cell walls.
4
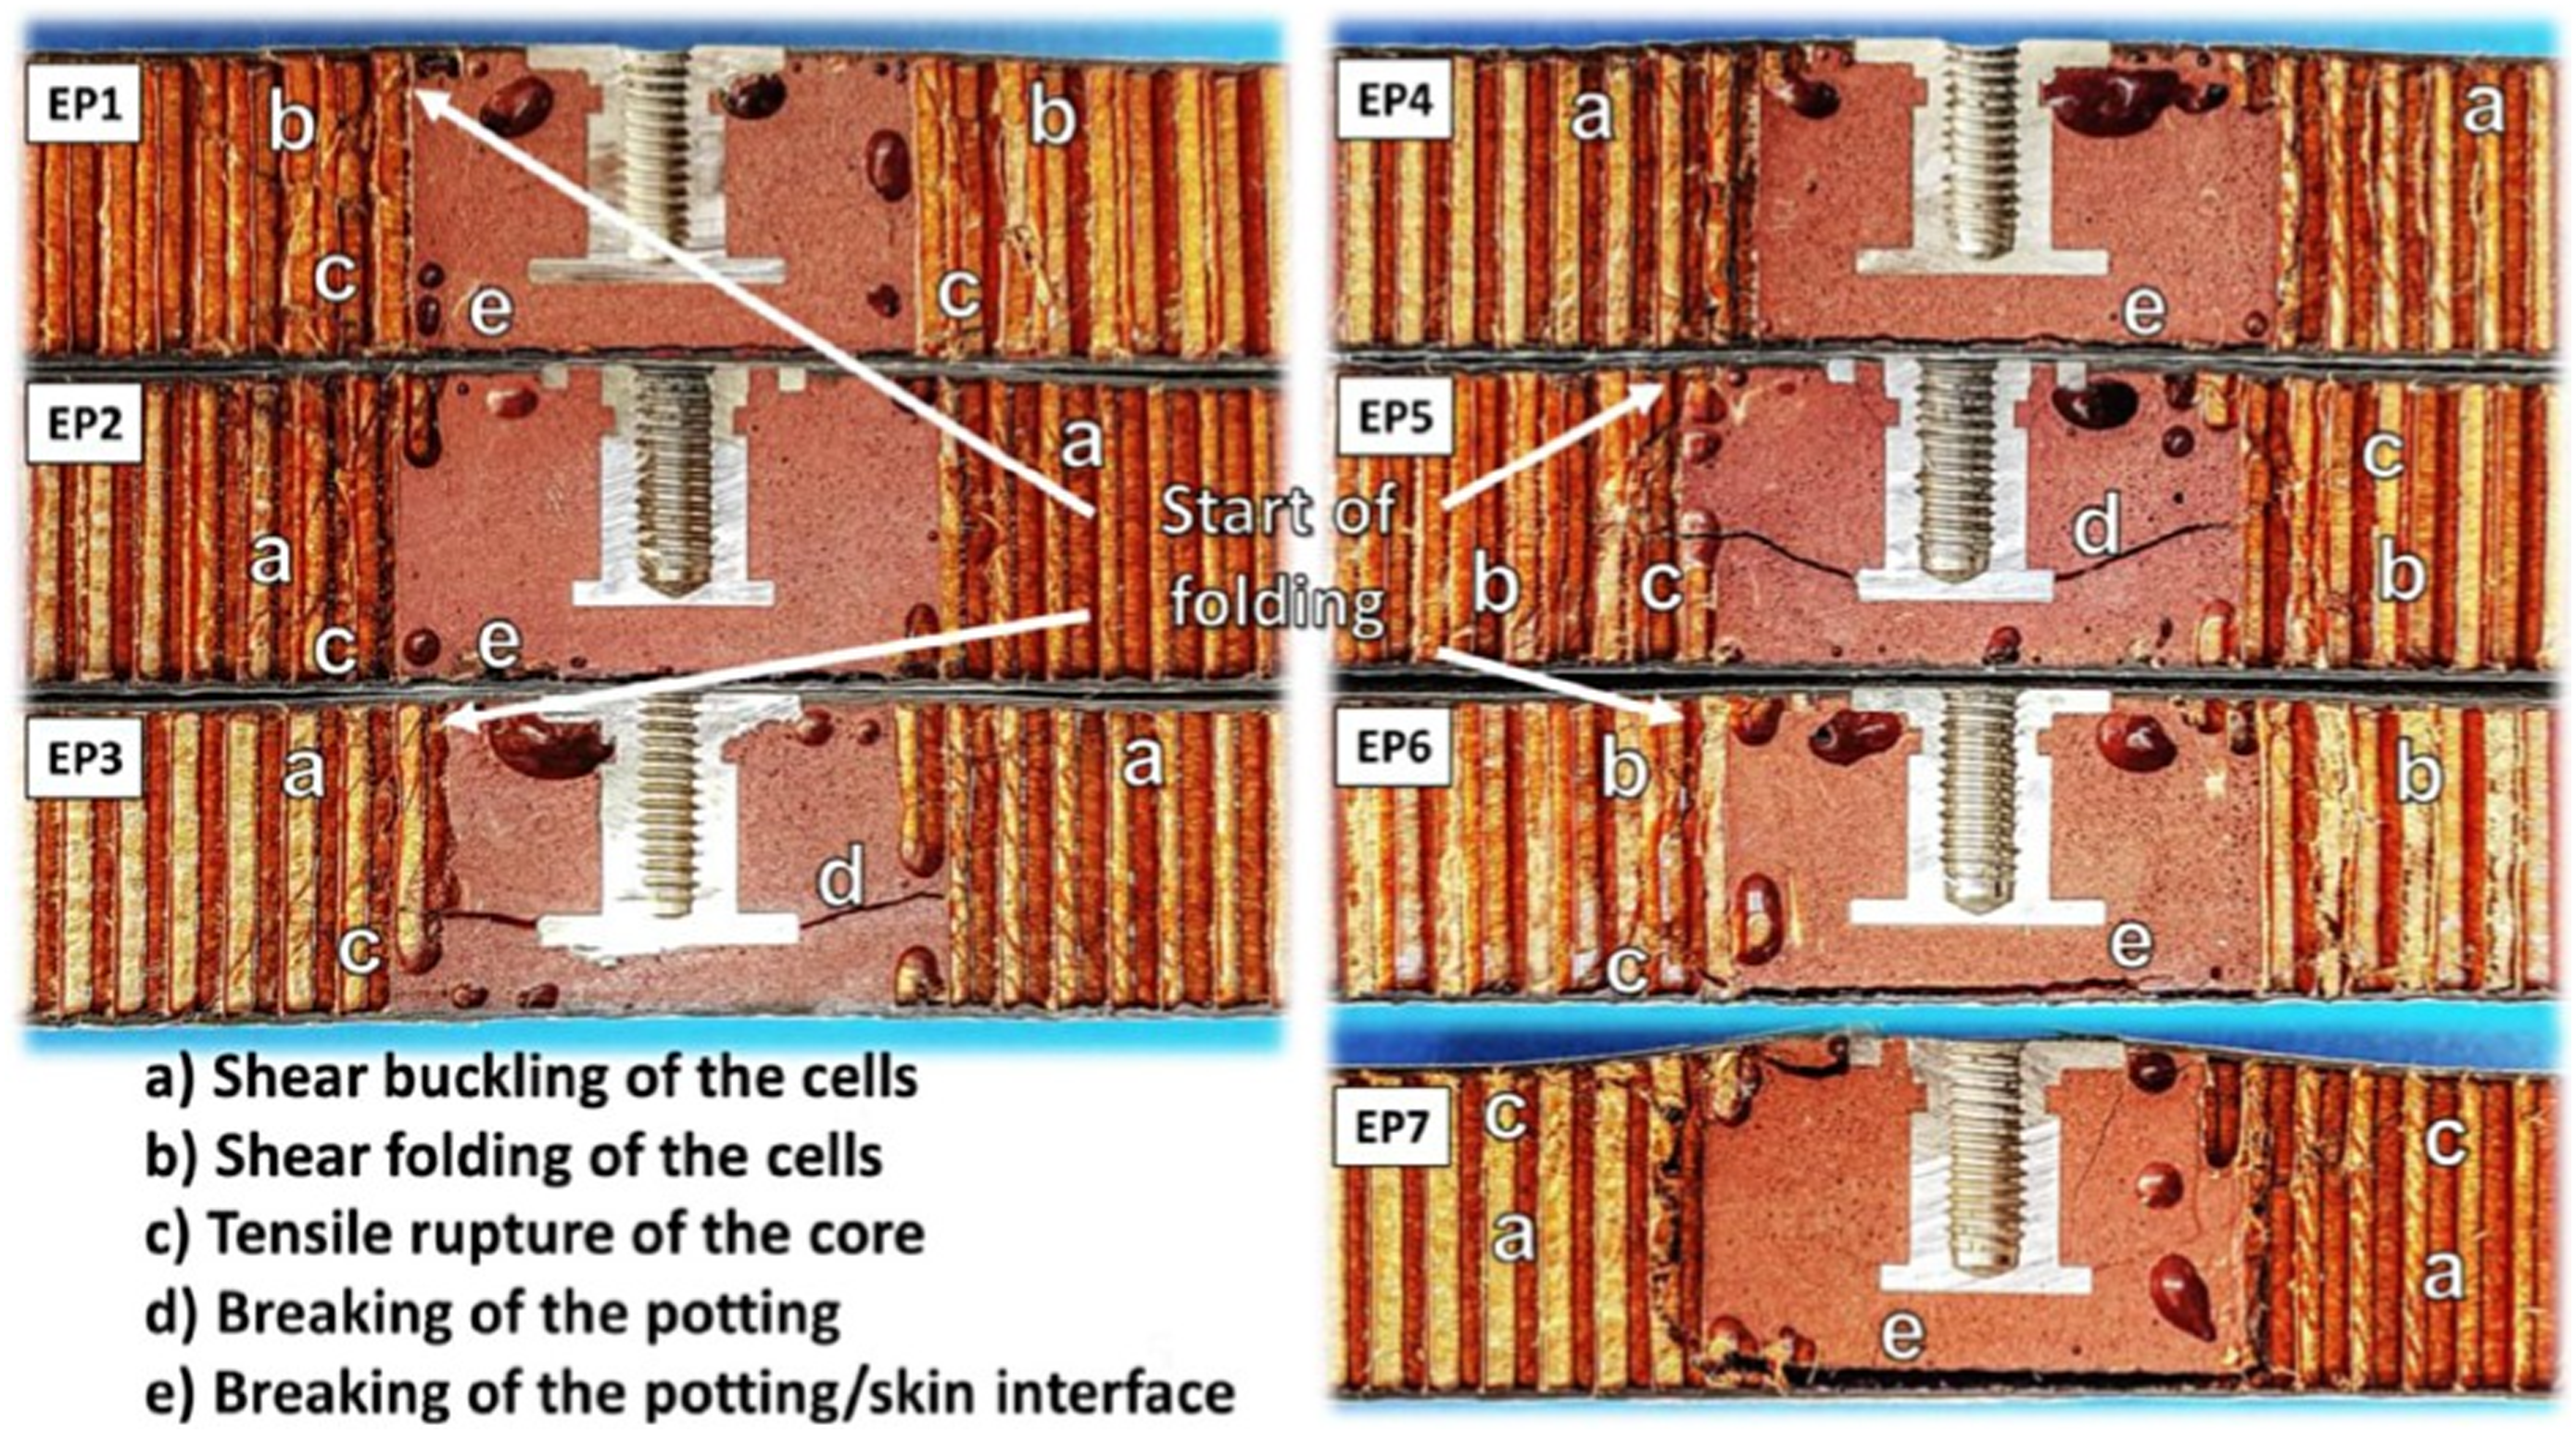
Several insert failure modes can be observed in Figure 1. While these stress jumps can be alleviated by adding a material of intermediate shear stiffness between the insert and the core or by changing the shape of the core junction, such solutions further increase manufacturing complexity and do not fully resolve the issue.2,3 The discrete nature of the honeycomb core materials leads to high variability in the strength-carrying capability of an insert,
5
which consequently increases the safety margins. These limitations demonstrate the need for a new design philosophy for sandwich panel cores and inserts. Example of failure modes for a standard stainless steel insert bonded to a Nomex core with G939/145 faces.
1
Adding inserts to the core is a slow and costly process that requires human intervention throughout regardless of whether the insert is hot or cold bonded. The human factor increases variability in terms of the structural properties of the core because the potting compound may be added inconsistently and pockets of air may be created. The properties of an insert can also change with potting depth 5 and with the relative in plane location of insert with respect to the honeycomb cells. 6 The first affects the structural failure modes of the insert, while the latter results in a variation in the number of honeycomb cells that are filled with potting compound which further changes the structural properties around the insert.
Several aerospace companies and research groups are working on automating the insert potting process to decrease manufacturing time and increase process control. RUAG Space performed a study into how more modern Industry 4.0 methodologies could be applied to their sandwich panel manufacturing process and determined that the stages after panel bonding, panel machining and insert installation are critical in terms of using sensor data to monitor the production of the panel. 7 Work by Carlos Campos 8 investigated the automation of the insert potting process and the procedure proposed reduced the injection time by a factor of 3.5 compared to the current baseline. As a result, companies such as GEBE2 and Viscotec9,10 are commercialising such automation techniques. However, the rest of the insert integration process that involves cutting the core and placing the insert remains manual. One way to completely remove the need for a multi-step potting process is 3D printing the entire panel core with an integrated insert. The high cost of AM could be offset by lowering expenses for labour and decreasing manufacturing time, while the price of producing AM panels could drop further when printed cores become the norm and enter mass production.
The majority of previous research in the area of AM inserts has focused on metal 3D printed optimised inserts glued to a standard Aluminium honeycomb core with Aluminium or CFRP facesheets. Work by Ferrari 11 involved a topologically optimised AlSi12 selective laser melting (SLM) insert that was developed, integrated in a standard Aluminium sandwich panel and tested under pull-out loads. The optimised design lead to a mass saving of 30% compared with the standard potted insert. Two similar projects cited by Ferrari 11 looked at blended honeycomb inserts 12 and a lattice insert, 13 reinforcing the previous conclusion that printed inserts can save mass compared with standard designs. Another study detailed the optimisation for AM of several satellite structural components, including an edge insert for an SSTL platform. 14 The printed edge insert was 40% lighter compared with the baseline solid design.
Two other research projects investigated SLS stainless steel 15 and titanium 16 inserts integrated in honeycomb sandwich panels with CFRP facesheets. The stainless steel insert was developed in the context of an aircraft frame and it halved the number of components while saving 40% in terms of mass compared with an Aluminium reference panel. 15 The titanium insert was topologically optimised and it reduced peak stresses by 30% and the mass by 10% for a structural panel based on the optical instrument for the EUMETSAT Polar System. 16
One study tackled the idea of improving insert performance by increasing the potting radius in the context of an ABS printed insert attached to an aramid honeycomb core with glass fiber facesheets. 17
The optimised insert geometries outperformed the standard printed insert showing that the design freedom provided by 3D printing can lead to a better stress distribution through the insert and the core.
There are two projects that investigated the concept of a 3D printed insert integrated in a 3D printed sandwich panel core as a single part. The first is a study from 2020 which investigates the topological optimisation of a star-shaped insert printed out of a photopolymer synthetic resin together with the rest of the honeycomb core. 18 The project points out the difficulty in comparing AM cores with standard honeycomb cores because of the need to print very thin walls to match their masses. Instead, the optimised star design is compared against a standard printed geometry. The optimised insert is 50% stiffer and two times stronger than the standard design, but the result of the topological optimisation is highly dependent on the boundary conditions so the optimal solution can change significantly based on the optimisation process.
The second is the EU funded ReDSHIFT project which finished in 2019, where an initial assessment of the structural performance of AlSi10Mg 3D printed honeycomb cores with integrated inserts was performed.
19
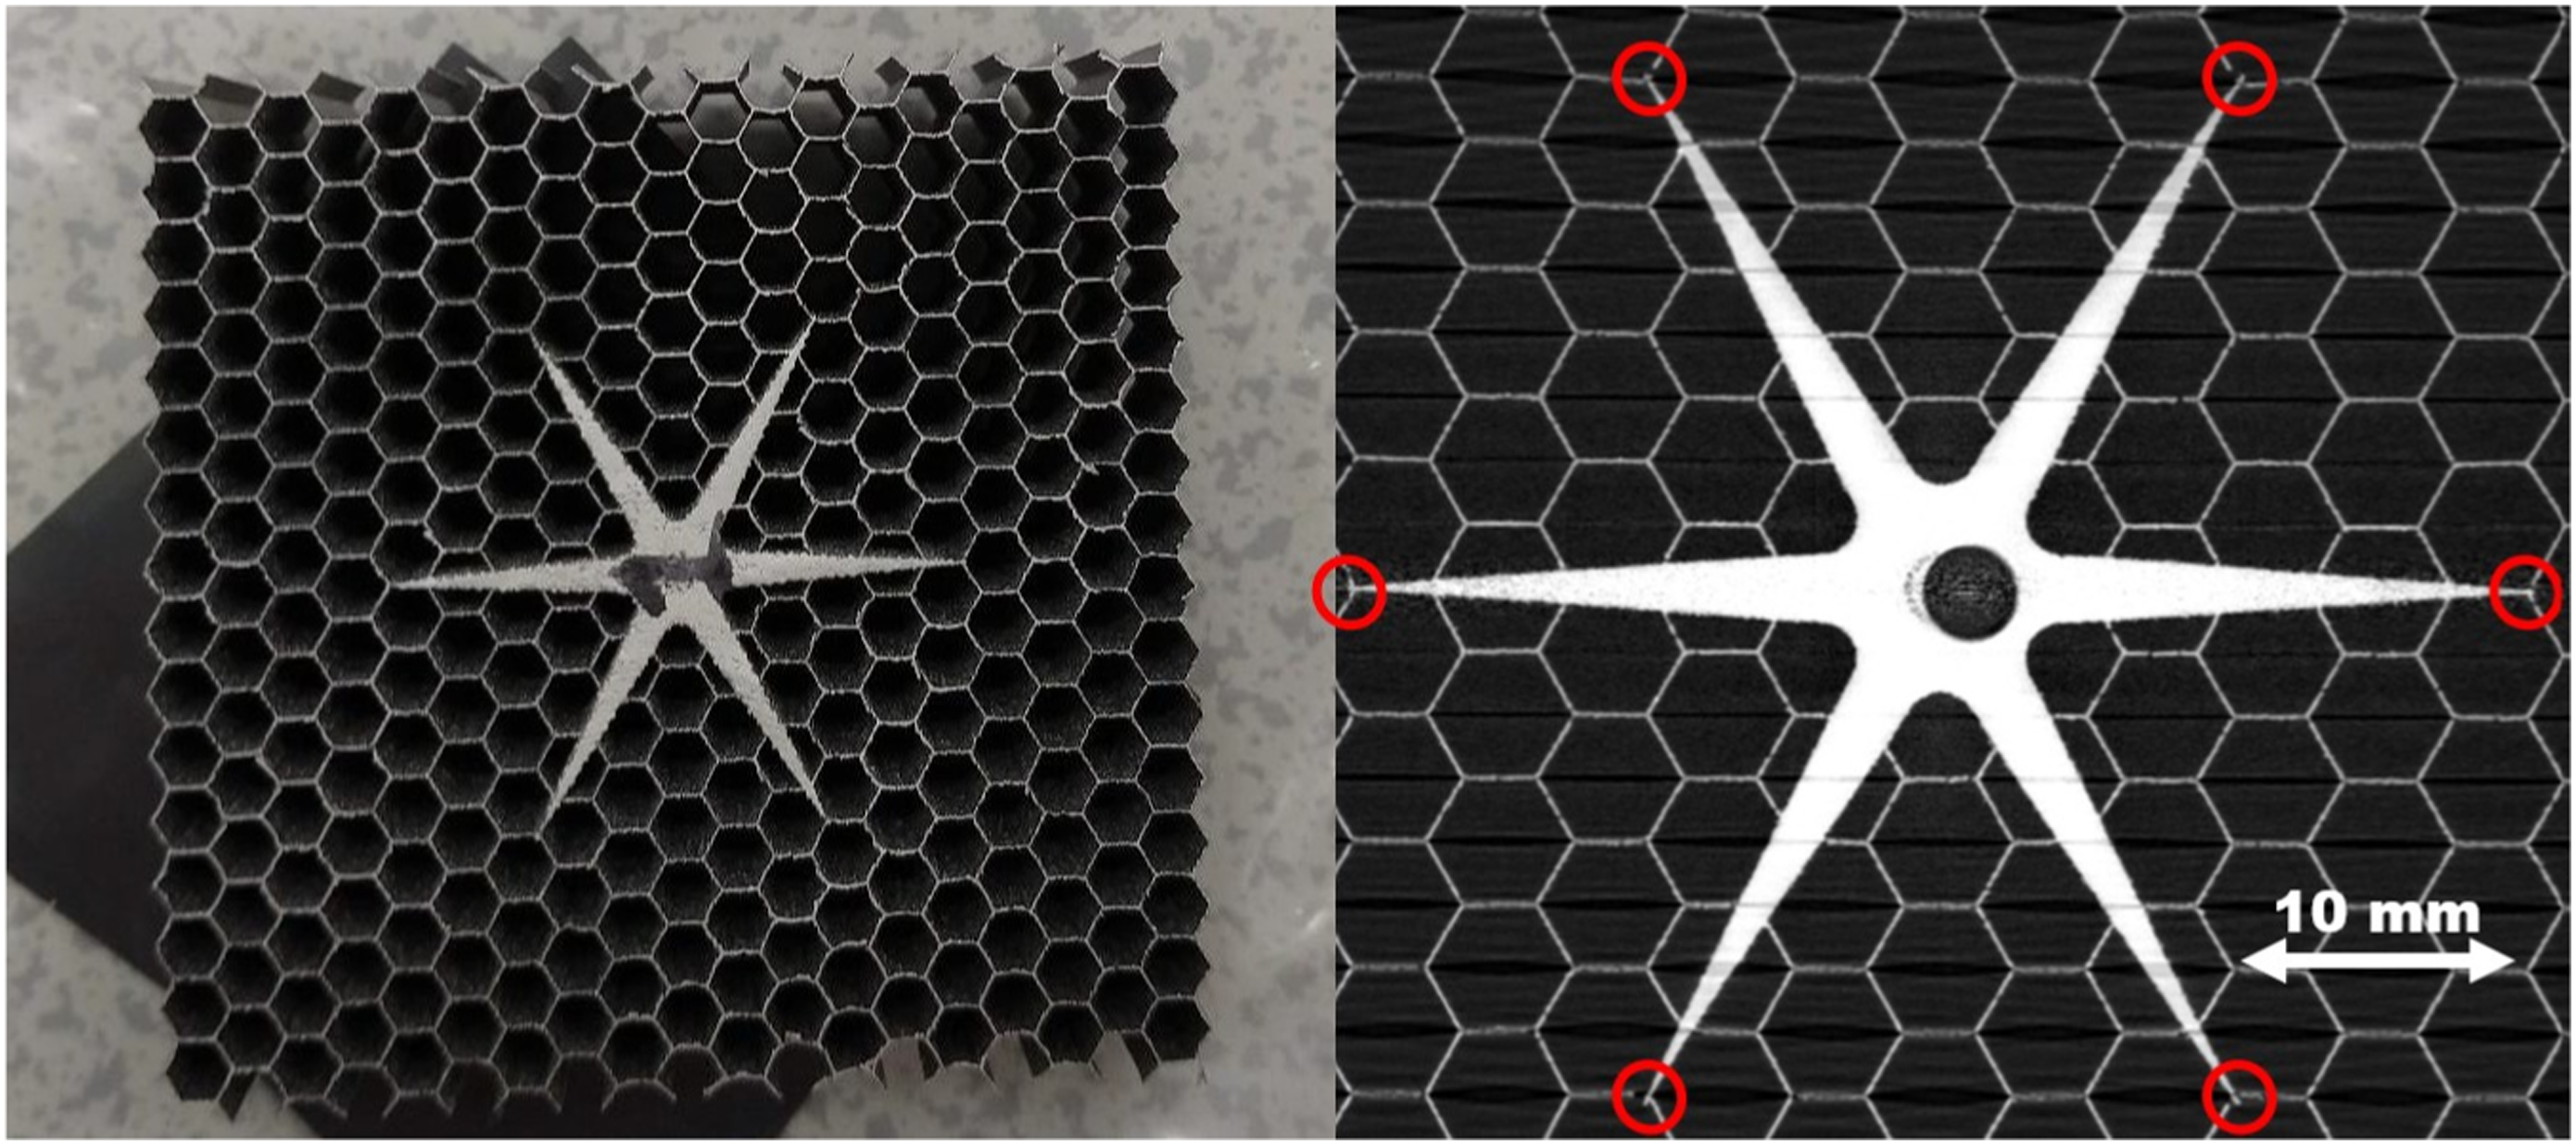
Two types of sandwich panels with CFRP facesheets and a 3D printed AlSi10Mg honeycomb core and insert were produced and tested under pull-out loading. Both panels had 0.64 mm thick TORAY M55J CFRP facesheets with 80 mm × 76 mm × 19.4 mm printed cores with a cell size of 4.7625 mm and wall thickness of 0.3 mm. One core had a standard 8 mm diameter circular insert, while the other had an optimised star shaped insert as shown in Figure 2. Three samples of each type were tested on an Instron 5569 test machine with a 50 kN load cell at a test speed of 2 mm/min to comply with ECSS standards.
20
The optimised geometry failed just above 5 kN and carried 6.7 times more load per unit mass when compared with the standard geometry for a 20% increase in sample mass. A very simple design change enabled through 3D printing lead to a more uniform stress distribution from the insert to the core and it significantly increased the structural performance of the insert. The printed optimised insert (left) and a CT scan cross section through the sample after testing (right). Sample failure points highlighted in red. Reprinted from ECSSMET study.
21
The ReDSHIFT samples were tested with CFRP facesheets attached, which made assessing the failure mode of the insert after testing difficult. As shown in Figure 2, the samples were CT scanned, but at a 50 µm resolution it is hard to make a distinction between fractures and open pores in the material. As a result, a more in depth analysis on samples without facesheets is needed to observe and understand the failure modes of novel 3D printed insert geometries.
Continuing on this work, the authors have previously investigated the manufacturing limits and the failure modes of several printed insert geometries. 21 This study presented at ECSSMET 2023 has identified that in order to survive the tapping process without the shear support of facesheets, the core walls should have a minimum design thickness of 0.5 mm. Moreover, it was concluded that thin walls close to the insert center should be avoided and if by design buckling can be delayed, then printed inserts can have an improved pull-out strength. This lead to the introduction of a novel insert design philosophy that can delay the buckling of 3D printed inserts and move the failure point of the insert away from the bolt where the facesheet can better contribute to supporting the core and increase the pull-out strength of the panel.
This paper expands on the work presented at ECSSMET 2023 21 by performing a parametric sweep to further investigate this design philosophy. The paper uses the outputs of this parametric study to inform a range of novel integrated insert designs that are 3D printed and tested through a series of pull-out experiments. The samples are tested without facesheets attached to allow for a better observation and understanding of the failure modes that will inform future designs and testing of the full sandwich panel configuration.
Optimised insert design philosophy
Several optimised inserts were discussed in Section 1 and apart from the geometry developed in the ReDSHIFT project, 19 all the designs proposed used topological optimisation. This can be an effective approach for complex one-off parts that have to survive a very specific loading scenario. However, as was concluded by both Campbell 13 and Schwenke, 18 the boundary conditions and the loading case will significantly affect the topology optimisation output and the final insert design, leaving much of the design optimisation in the hands of the structural engineer. A more robust design approach starts from the idea of keeping the cross sectional load bearing area constant with the radial position away from the bolt in order to maintain a constant shear stress in the panel.
Looking at Figure 3, the reference load bearing area is the outer surface of the solid insert, which is shown in the top left of the image. For optimal stress distribution from the insert into the sandwich panel core, this load bearing area should be the same at every radial position away from the centre of the insert. Two other locations into the core are shown, one at a 3 mm radial distance from the outer surface of the insert and the other at 7 mm. At the second location (circumference 2 in Figure 3) there are six load bearing areas, while at the third location (circumference 3) there are 18 smaller material areas that carry the load. As shown in the bottom half of Figure 3, when summed up, the six areas at circumference 2 and the 18 areas at circumference 3 should each match the reference area at circumference 1. If this area is not kept constant from the insert center to the core, weak points are created at locations where there is a large load bearing area jump. All the samples tested in the ECSSMET study
21
failed close to the central solid insert because that is where the load bearing area drops significantly. The cross sectional load bearing area considered at three locations across the insert - core geometry for a blended geometry. Areas highlighted in blue on the CAD are summed in the bottom half of the figure.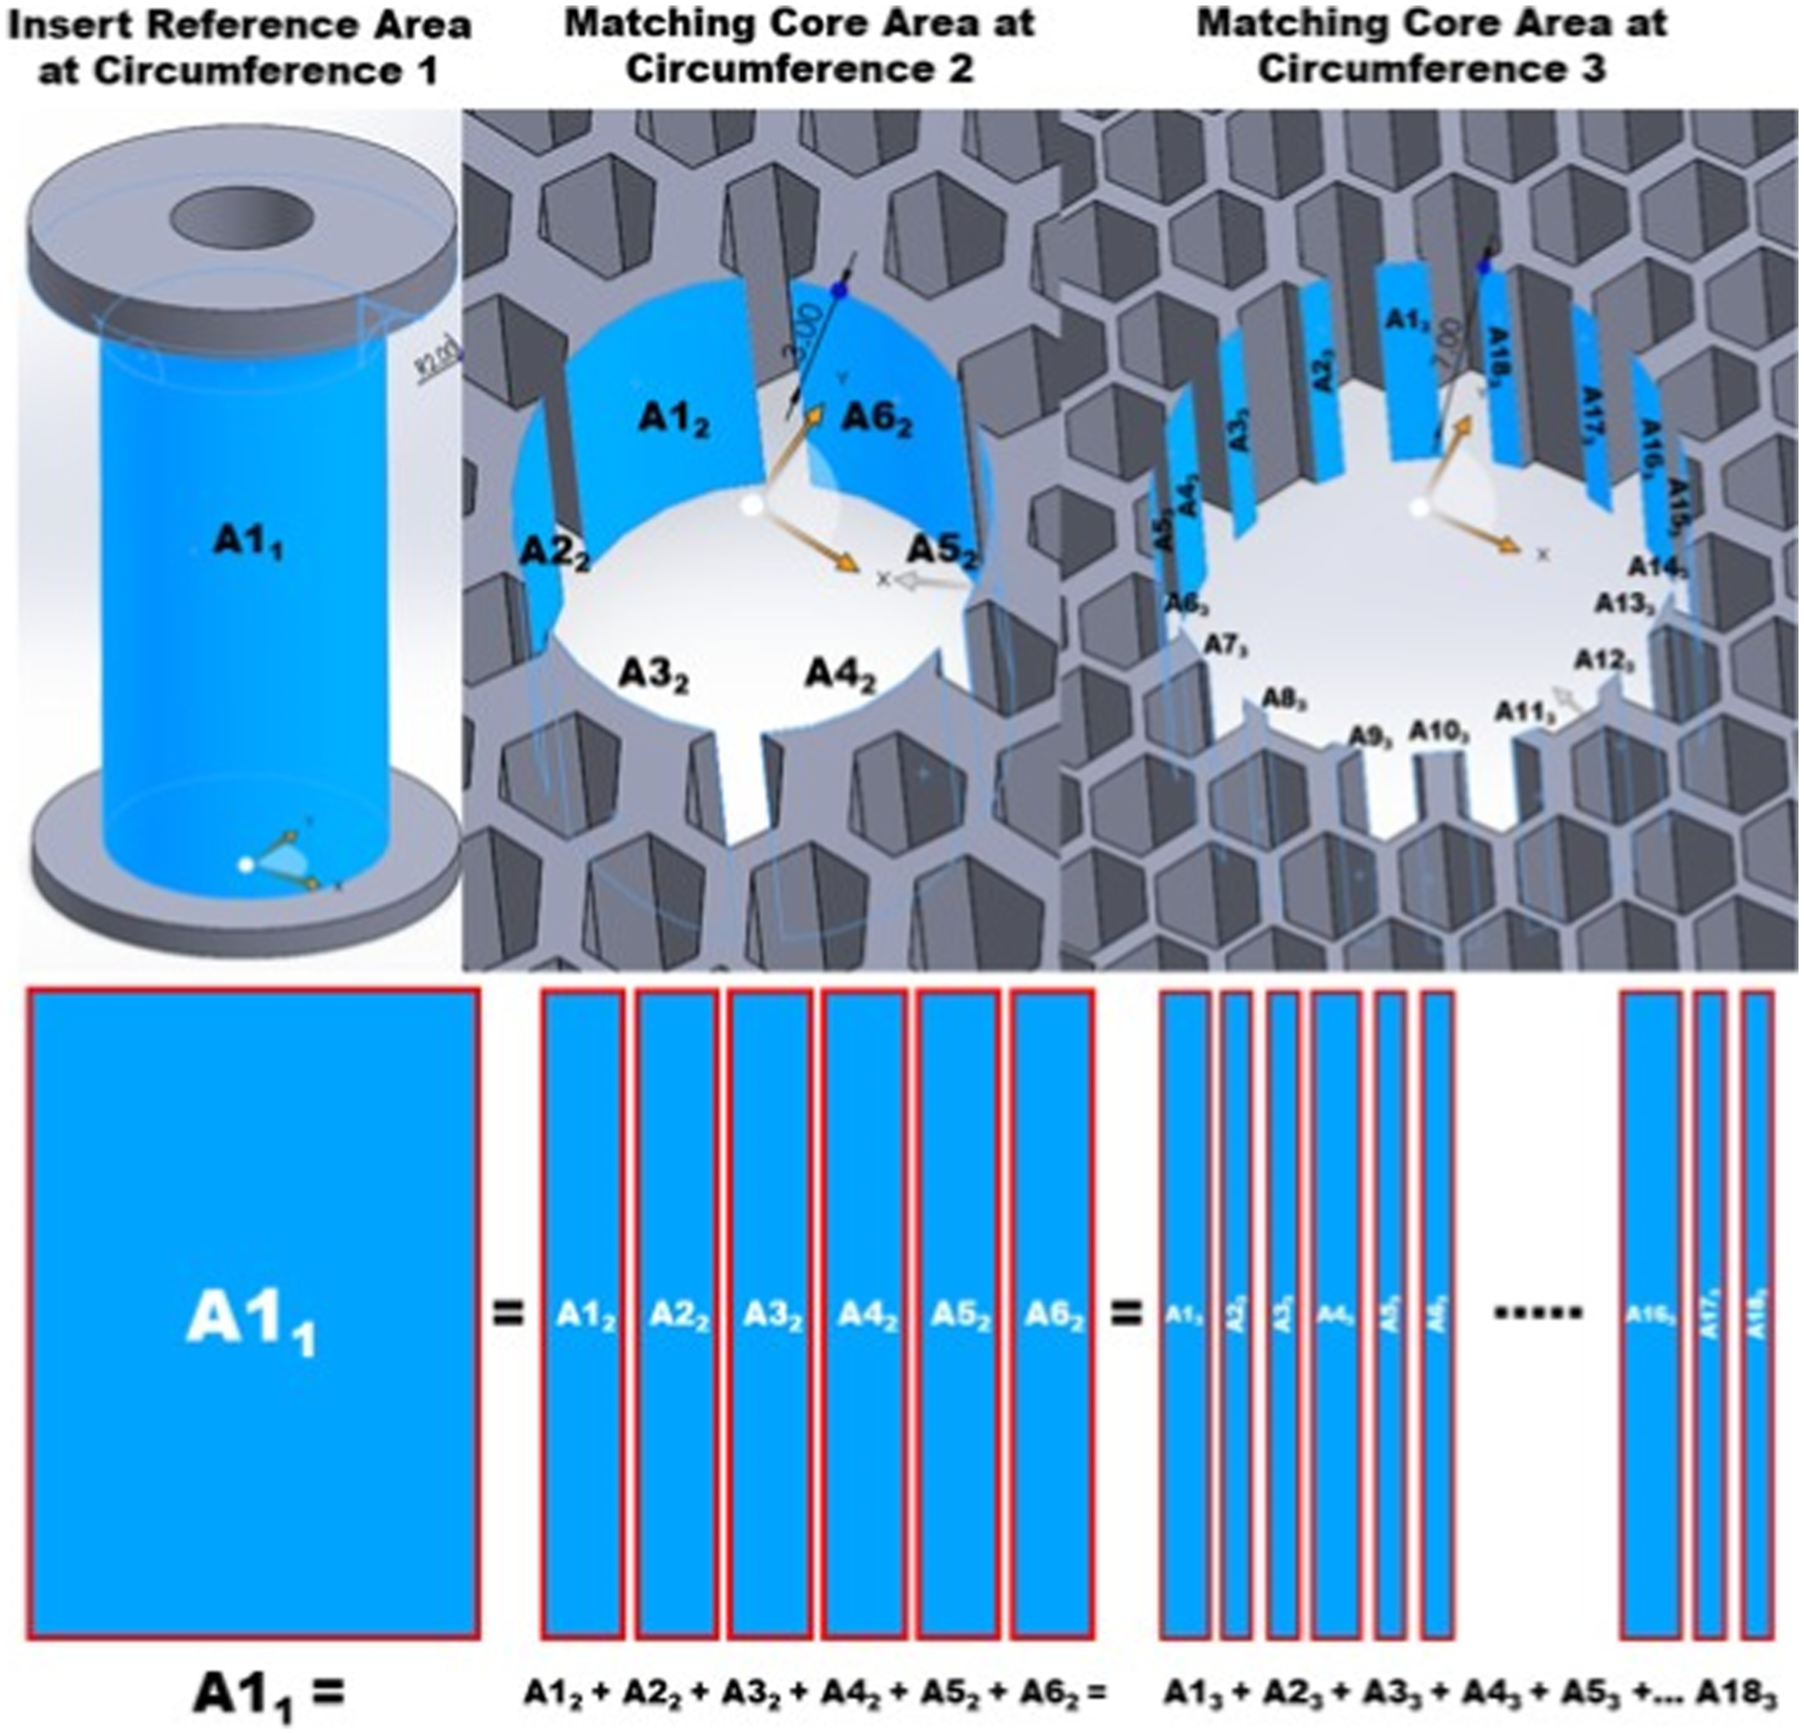
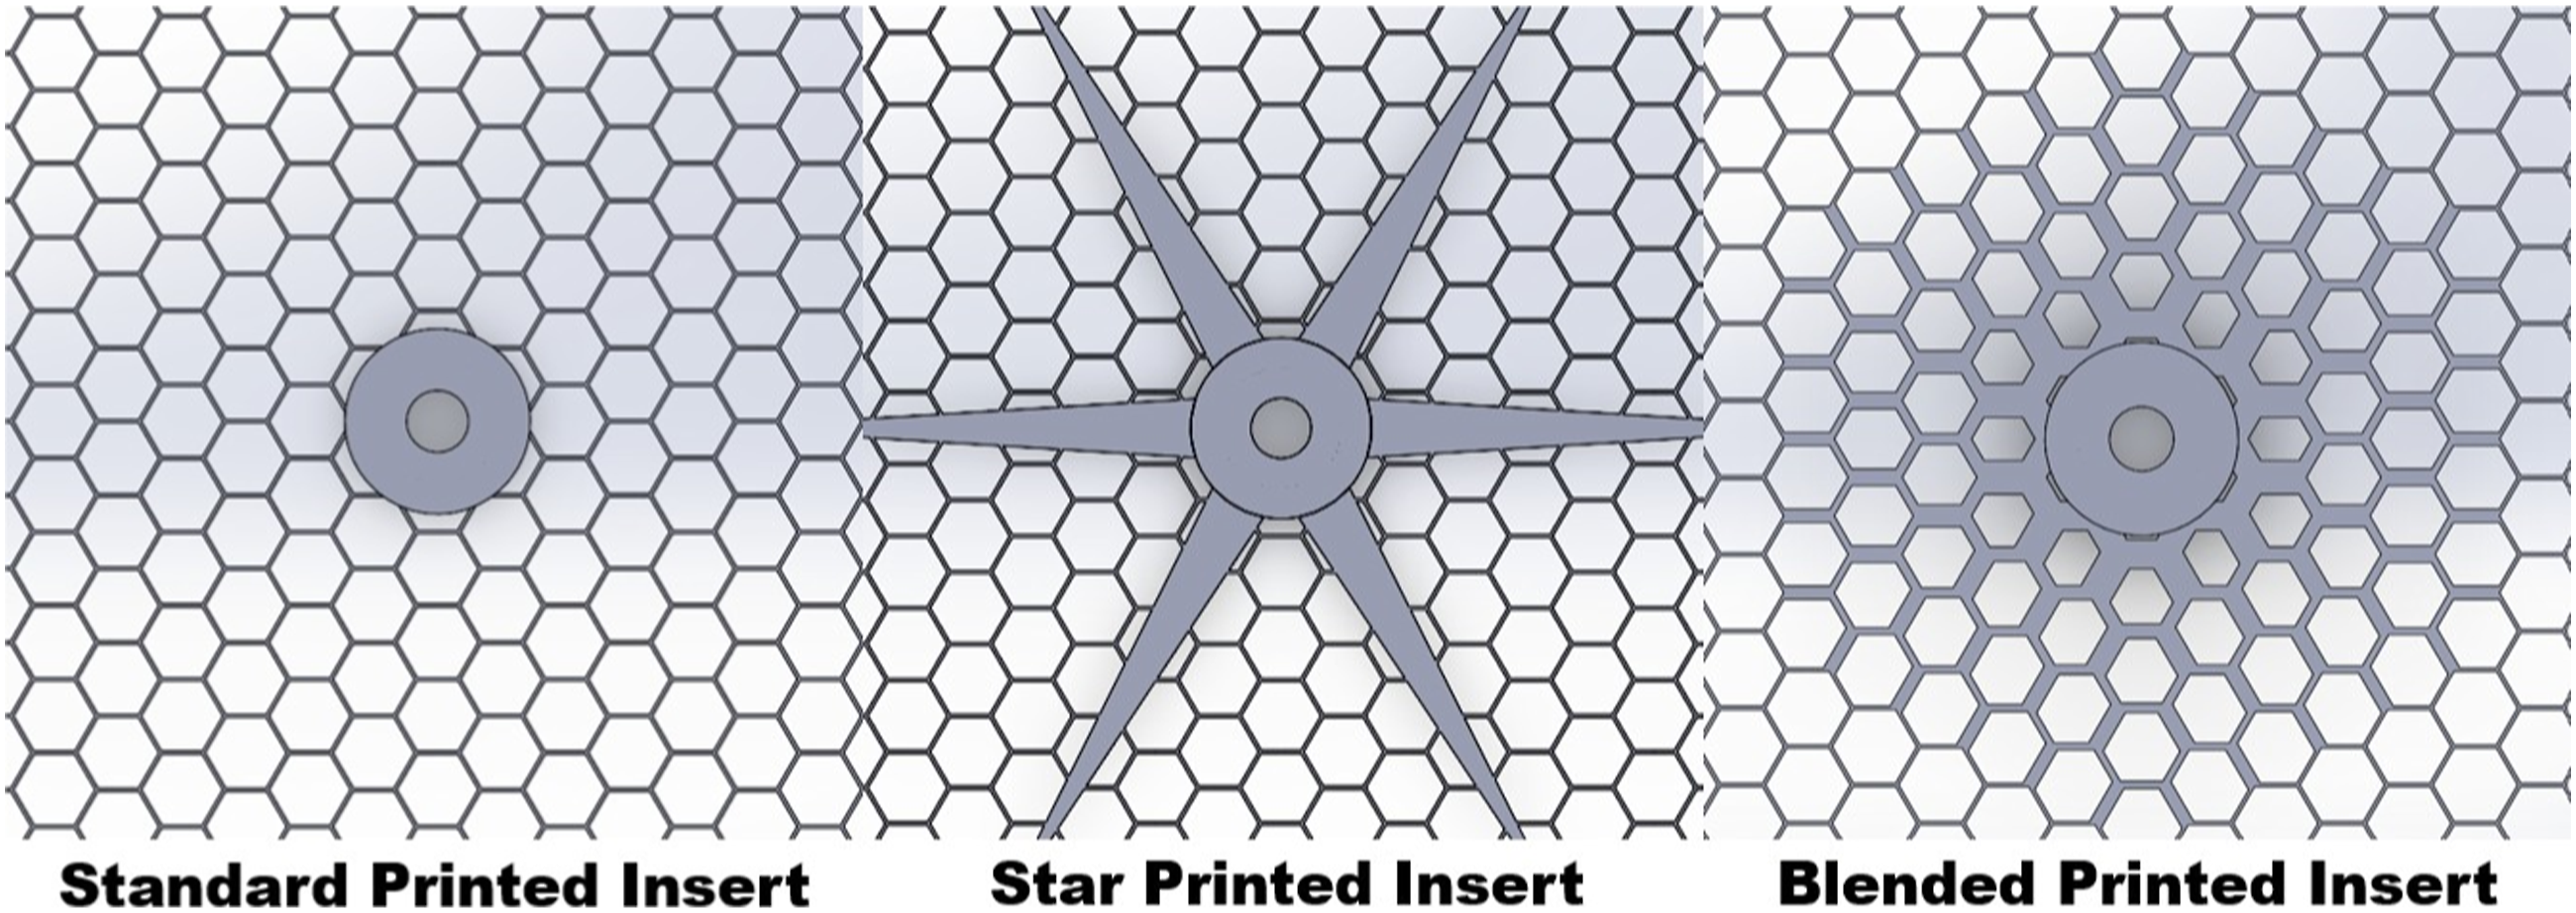
This idea was used in the six point star insert design from the ReDSHIFT project shown in Figure 2. For this sample, the weak point is the transition from the star to the rest of the core because there is potentially a jump in load bearing area at that interface. Conceptually, the ideal design is a star with an infinite number of points which distributes material area evenly around the circumference. In practice this can be implemented in its most simple form as a blended core, a honeycomb core with decreasing wall thickness from a maximum at the insert to a minimum given by the baseline core thickness. This concept is shown in Figure 4 next to the standard and the star designs. Comparison between the standard, star and blended insert concepts. Reproduced from the previous ECSSMET study by the authors.
21
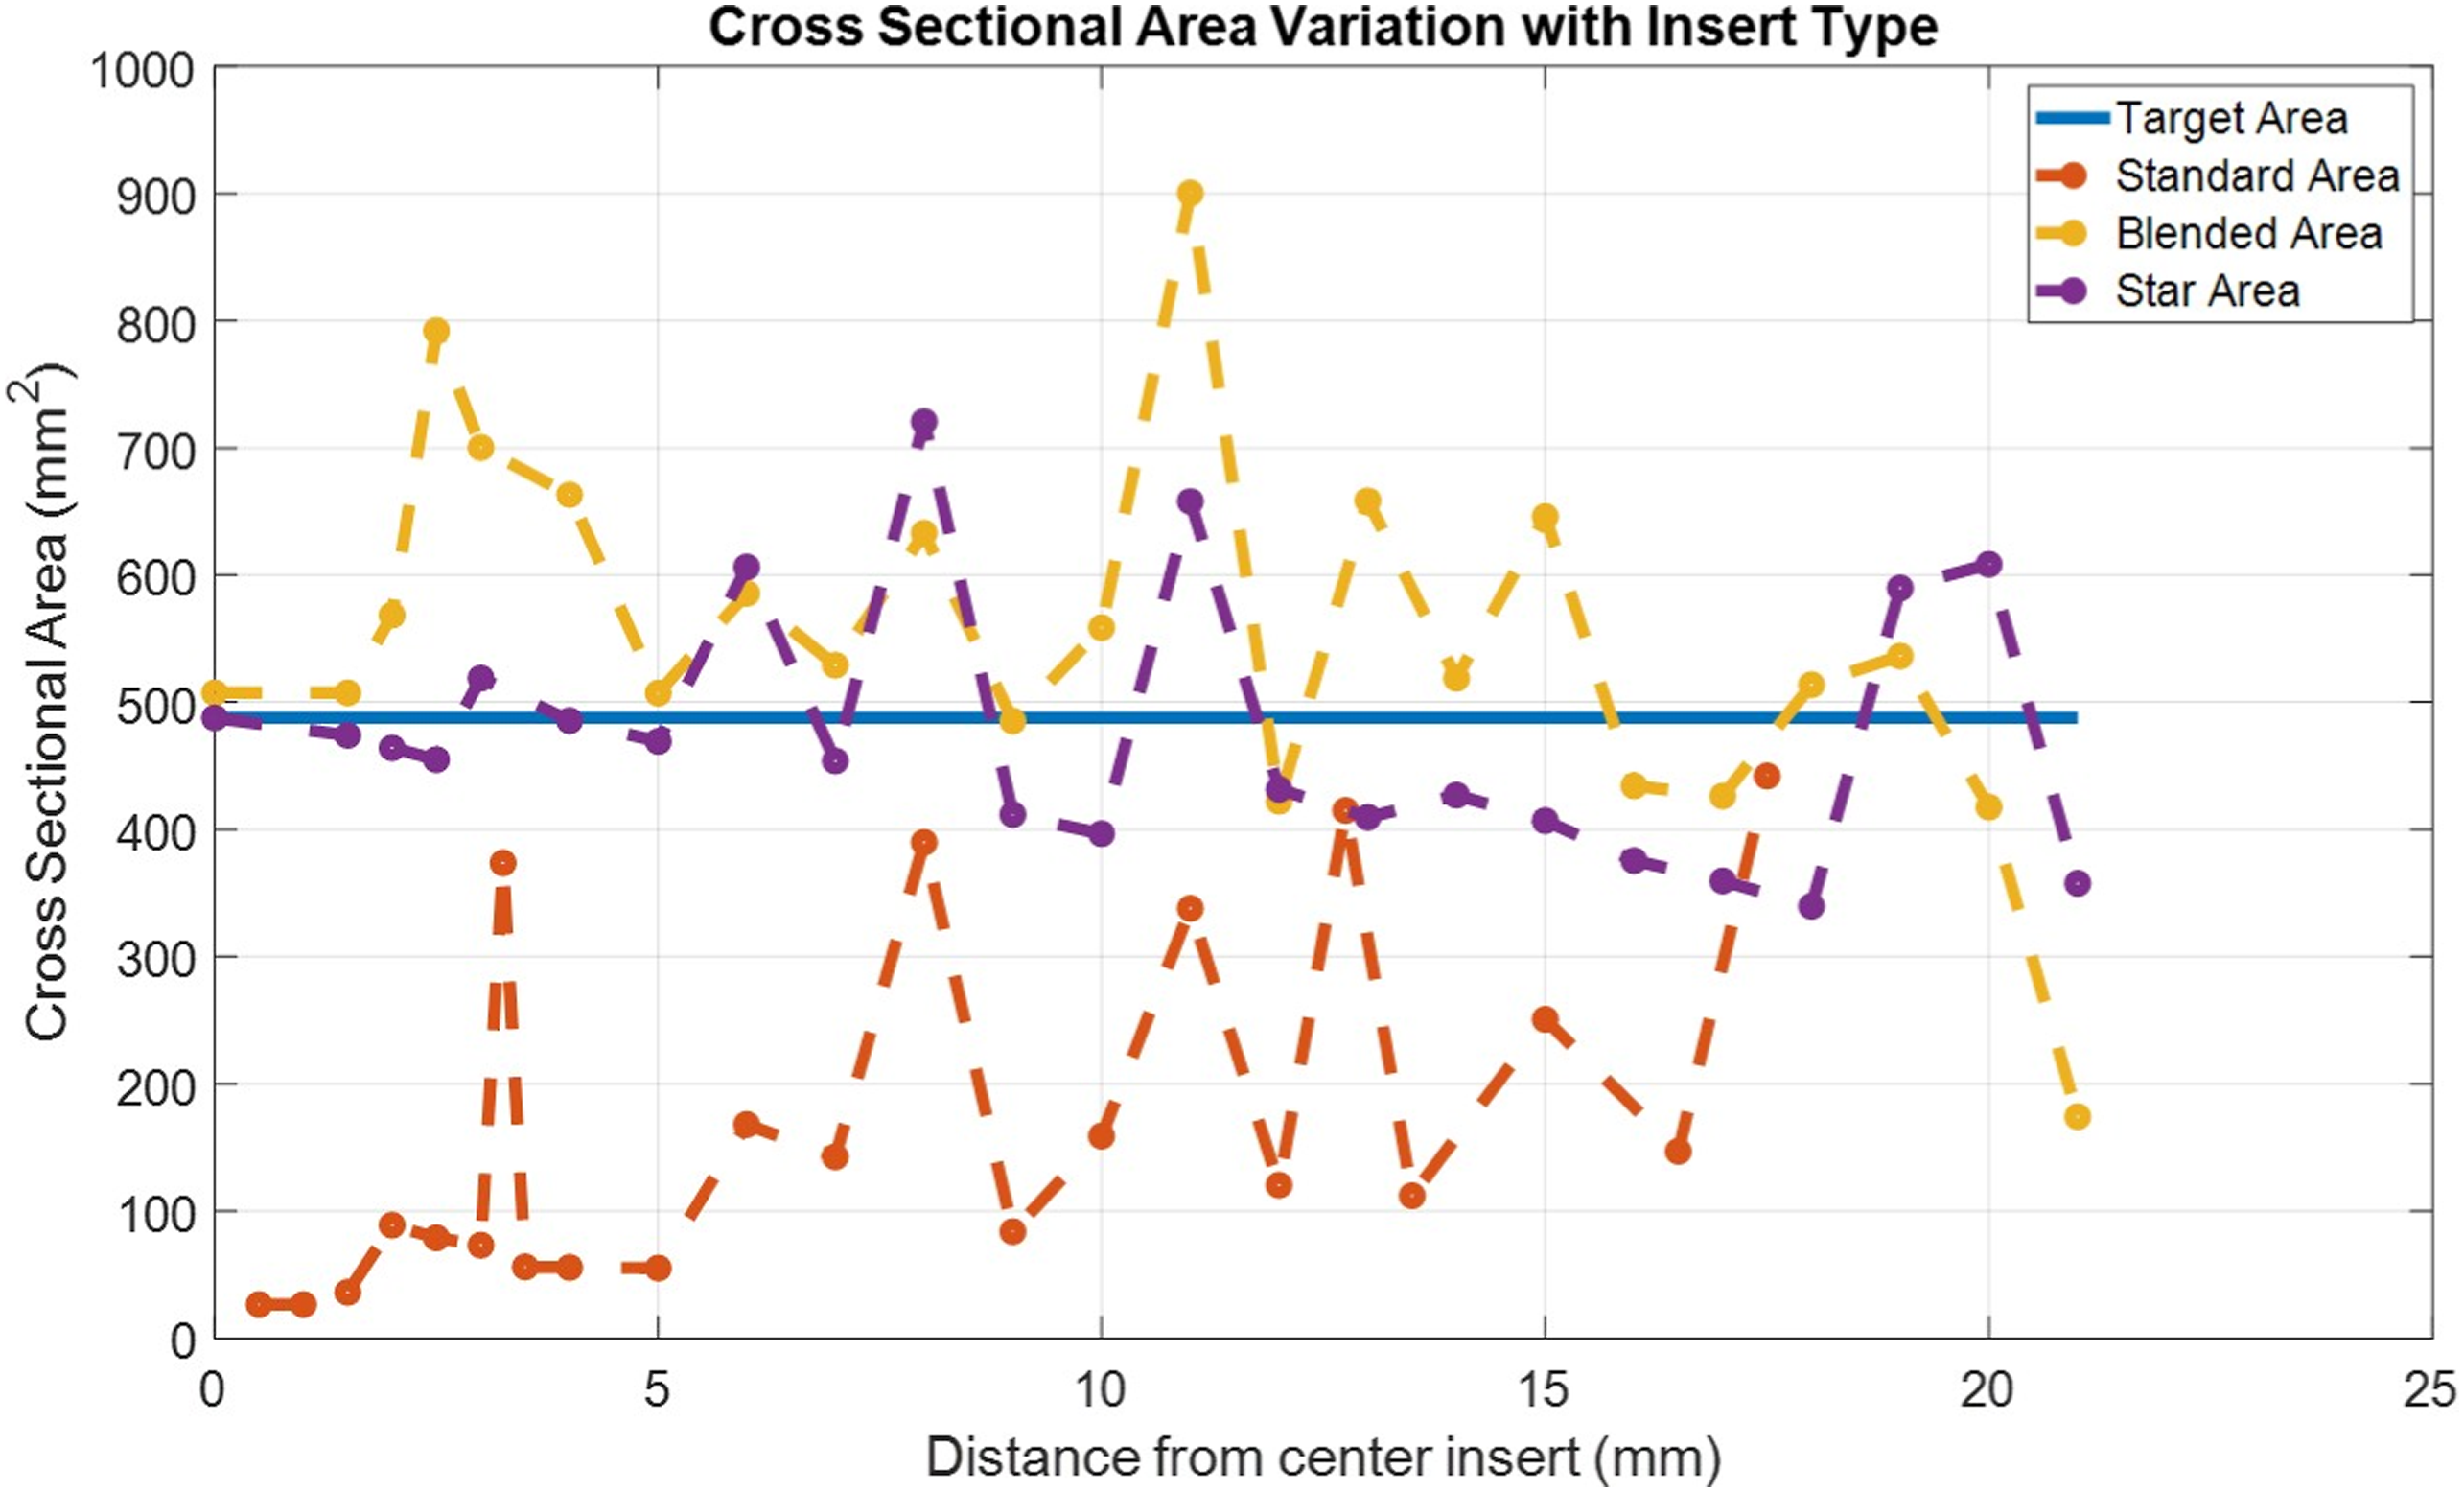
To better observe the effectiveness of the blended design compared with a six point star design and with a standard printed design, their cross sectional area variation with radial position is plotted in Figure 5. The average cross sectional area of the blended design is higher for the same mass compared with the star and more evenly distributed around the circumference. Cross sectional area variation comparison between the standard, the blended and the star designs. Reproduced from the previous ECSSMET study by the authors.
21
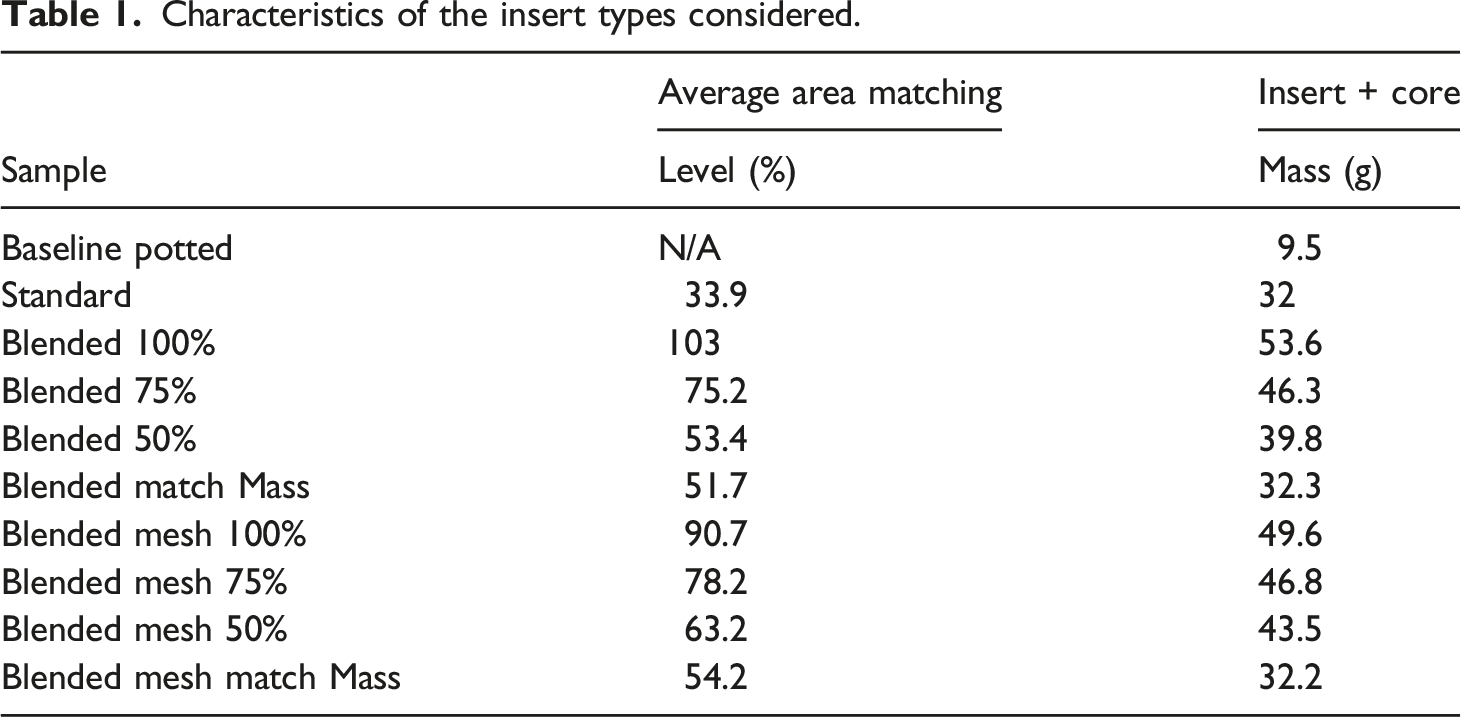
With this design philosophy in mind, two types of geometries are developed. The first is a blended core which matches a certain percentage of the cross sectional area at the outer surface of the solid insert. The second is similar, but with a mesh-like design, as shown in Figure 6. The mesh design has more core members, which means that for the same mass it has thinner walls with shorter free sections compared to the simple blended core. Both fit an M4 bolt, have an inner insert wall thickness of 2 mm and have a 12 mm diameter top flange. Four versions of each were built in Solidworks 2021 and they are listed in Table 1. The dimensions of all samples in the X, Y, and Z directions defined in Figure 6 are as follows: 80 mm × 19.4 mm × 75 mm. Design comparison between the blended insert and the blended mesh insert. Characteristics of the insert types considered.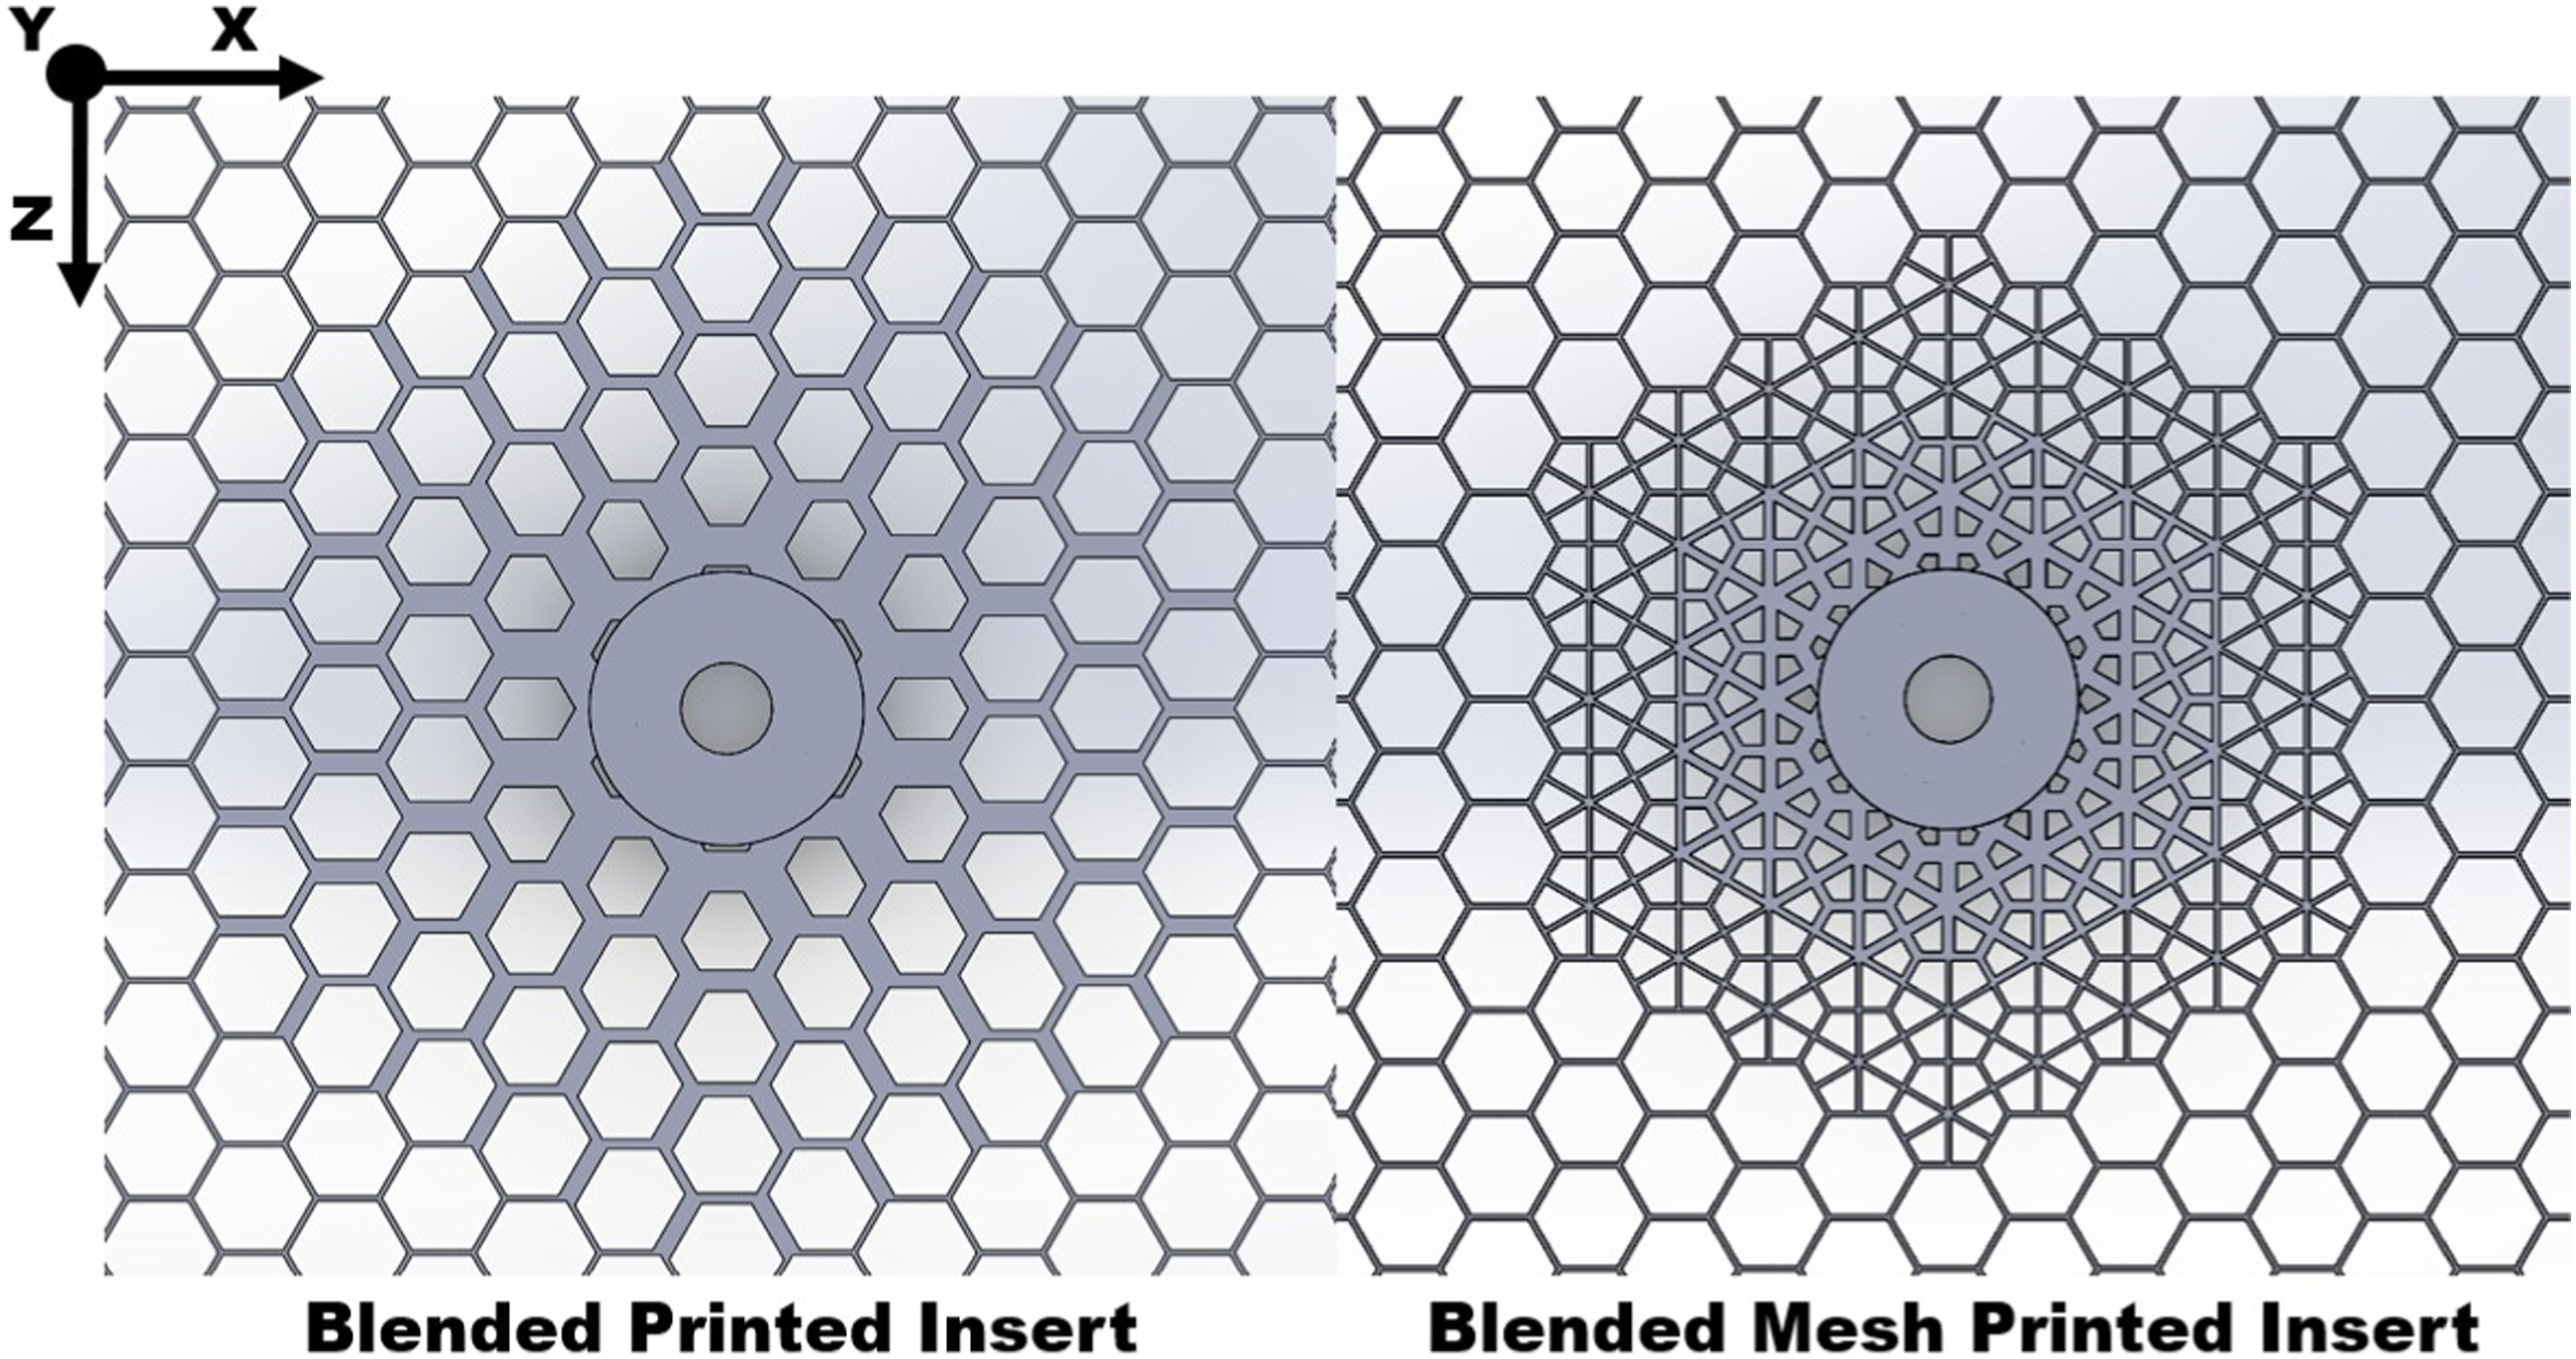
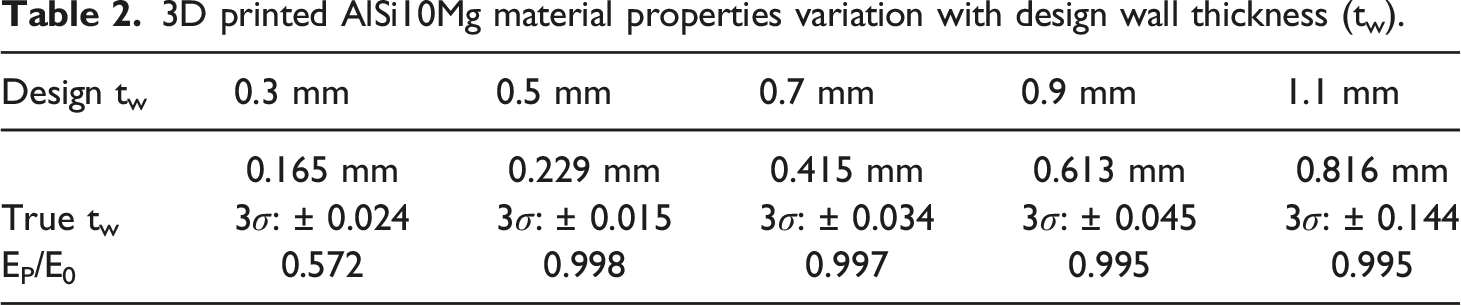
3D printed AlSi10Mg material properties variation with design wall thickness (tw).
For both the blended core and the blended mesh core, three levels of area matching are considered: 100%, 75% and 50%. Moreover, a model which matches the mass of the standard printed insert while staying within manufacturing constraints is also proposed for both the blended and the blended mesh geometries. The mass matching models have a design core wall thickness of 0.3 mm instead of 0.5 mm. These models are important to consider because the main issue with any blended design is that it adds mass to an already heavy 3D printed honeycomb core. For an 80 mm × 75 mm × 19.4 mm core, a baseline AL 5056 core weighs 9.07 g and a standard printed core with a design wall thickness of 0.5 mm weighs 32 g. The current study investigates the potential of these blended geometries in the context of current manufacturing limitations, but the concepts developed can be applied even more effectively as printing technology develops allowing for thinner walls to be produced.
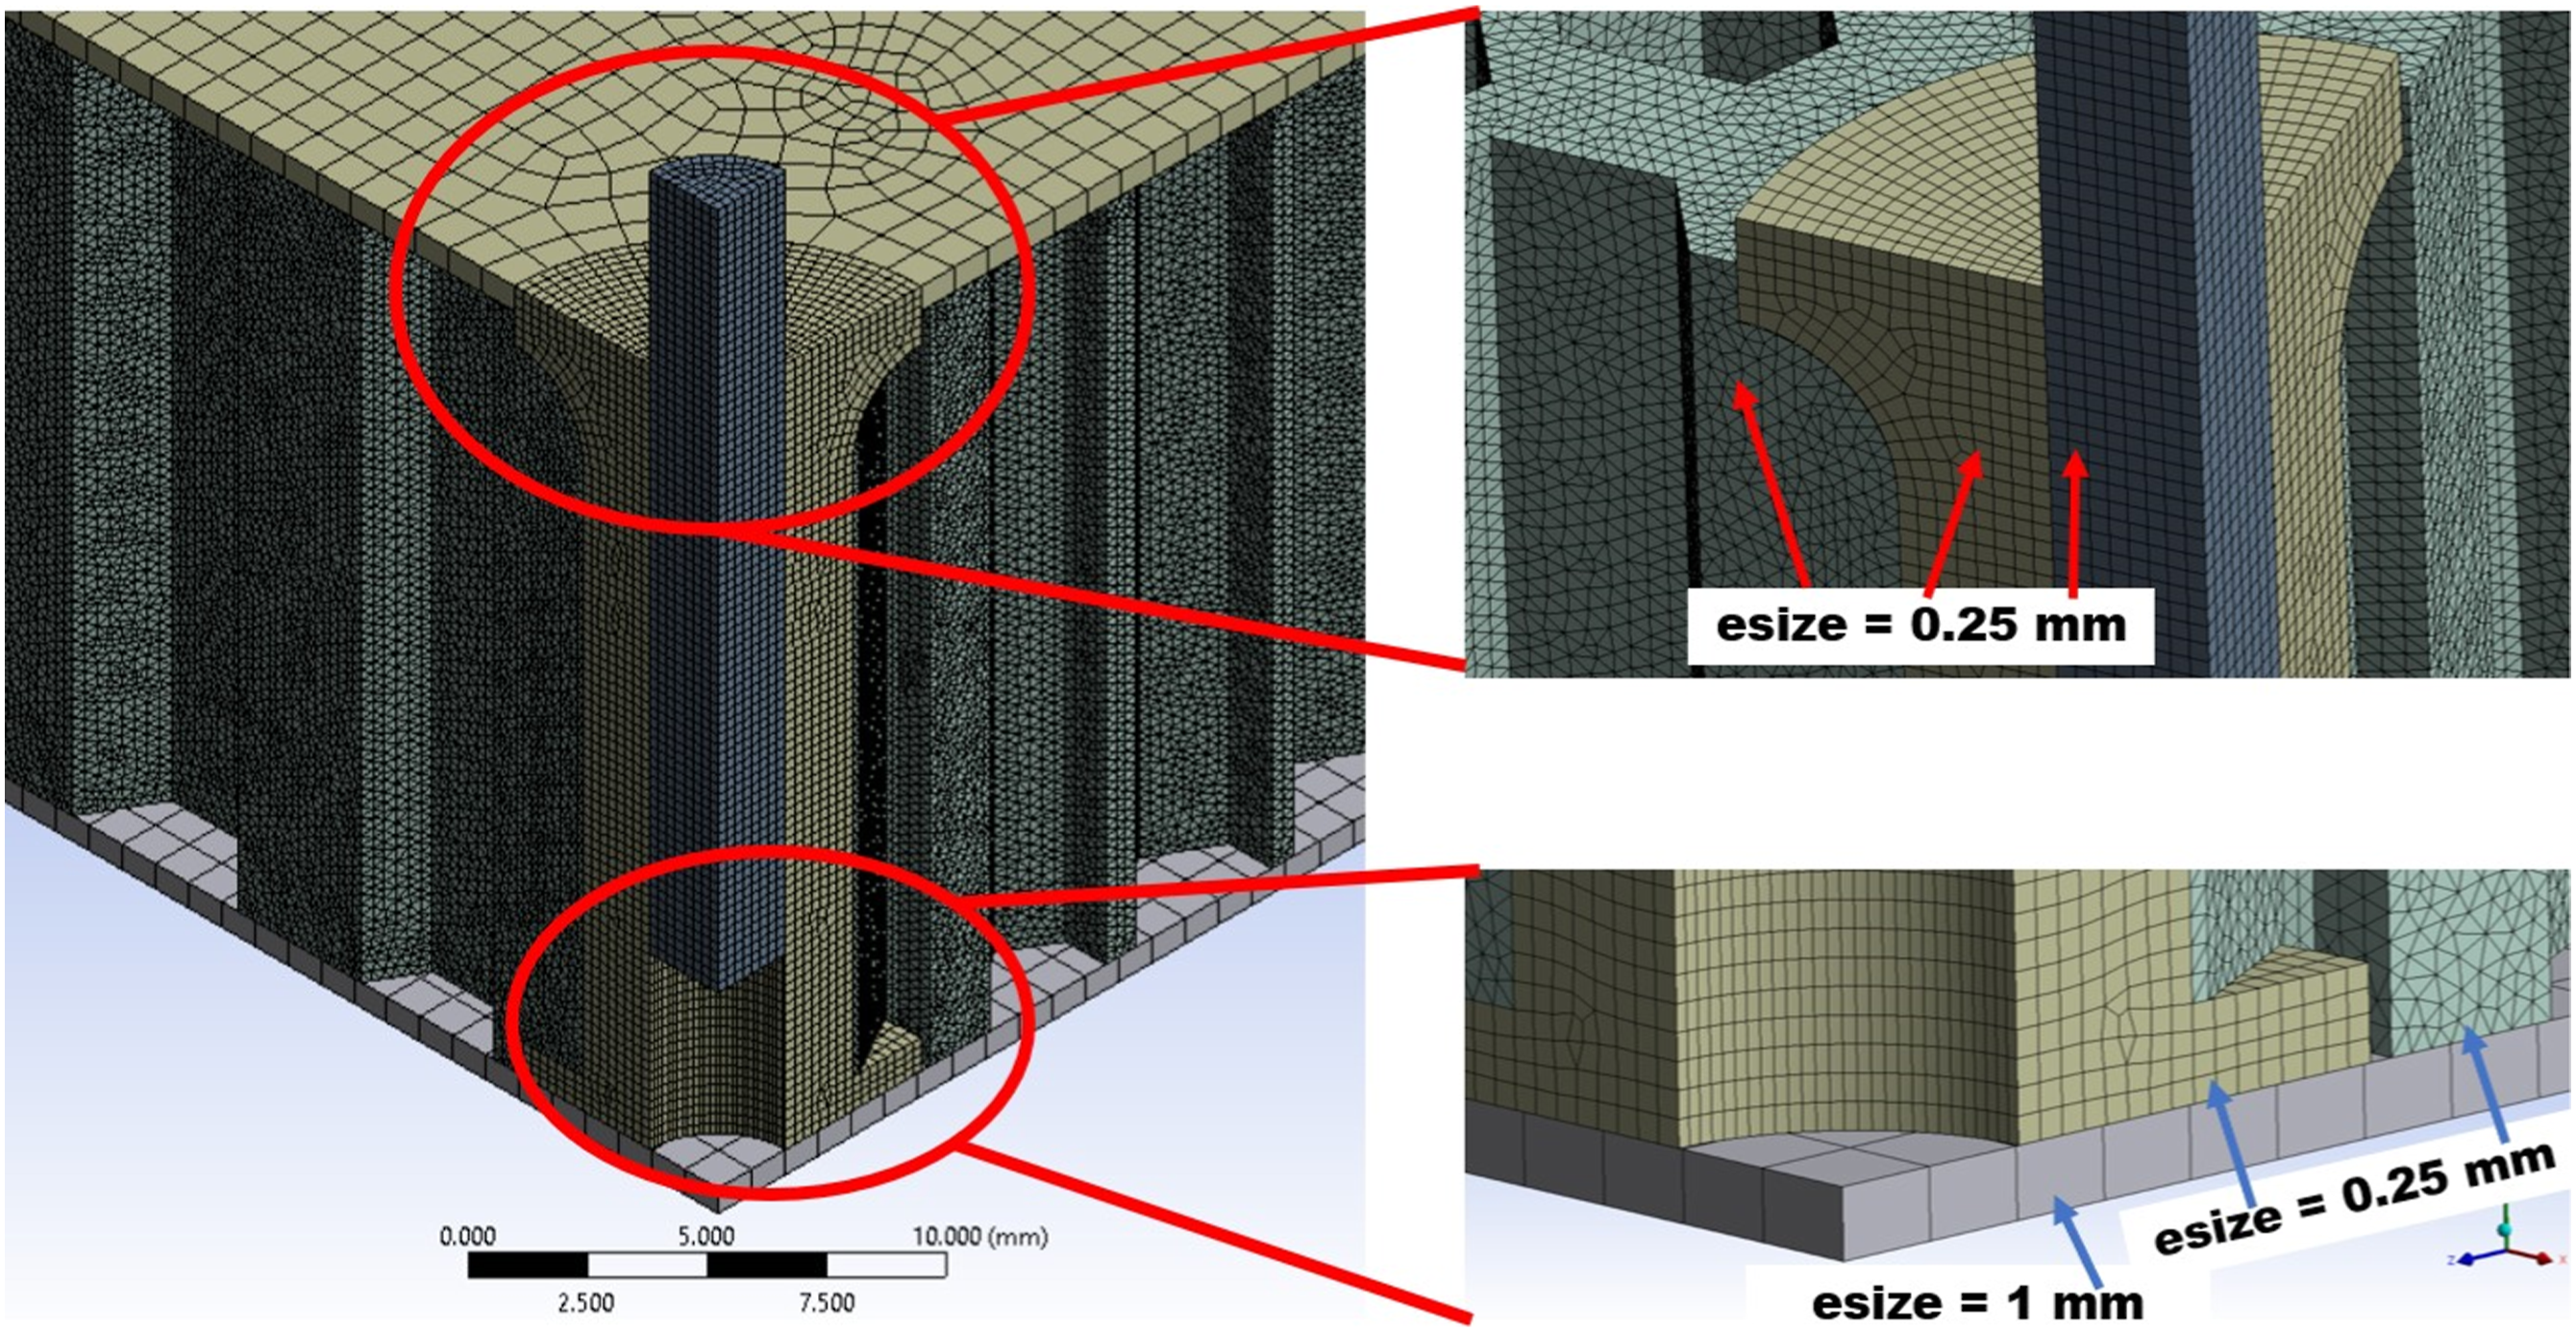
The samples listed in Table 1 were modelled in ANSYS WorkBench 2021 R2 in a similar configuration to that depicted in Figure 7. Both static and buckling simulations were performed under a vertical load of 4,000 N as this value lies within the expected failure range for potted inserts. Two cases for each sample were considered: without facesheets and with 0.64 mm thick CFRP facesheets that add 12.3 g to all samples. In the ANSYS model the faces are bonded to the core and insert where there is direct contact. Running both cases gives insight into how the relative performance of these geometries changes when adding or removing the facesheets. Given that the goal is to test some of the samples without facesheets to observe the failure modes, it is useful to understand how the experimental performance may change when adding the CFRP faces. For the static simulations, quarter models with 20-node solid elements were used because the geometry is symmetric across two planes. An element size of 0.25 mm was used for the insert, the honeycomb core and the M4 bar, while an element size of 1 mm was used for the facesheets and the constraining block. A mesh convergence study was performed and lowering the Solid 186 element sizes by a further 30% increases the displacement by 0.4% while keeping the stress distribution the same. Only the stresses around sharp corners increase by 10%–15% which is a natural consequence of a smaller element size. A detailed view of the mesh is shown in Figure 8. The difference in element sizes between the blended core and the facesheets can be observed, while the top facesheet is hidden in the top right image to better visualise the core walls. ANSYS 2021R2 simulation setup for pull-out testing, similar to that used in the ECSSMET study.
21
Details of the ANSYS WorkBench 2021 R2 mesh on a quarter model.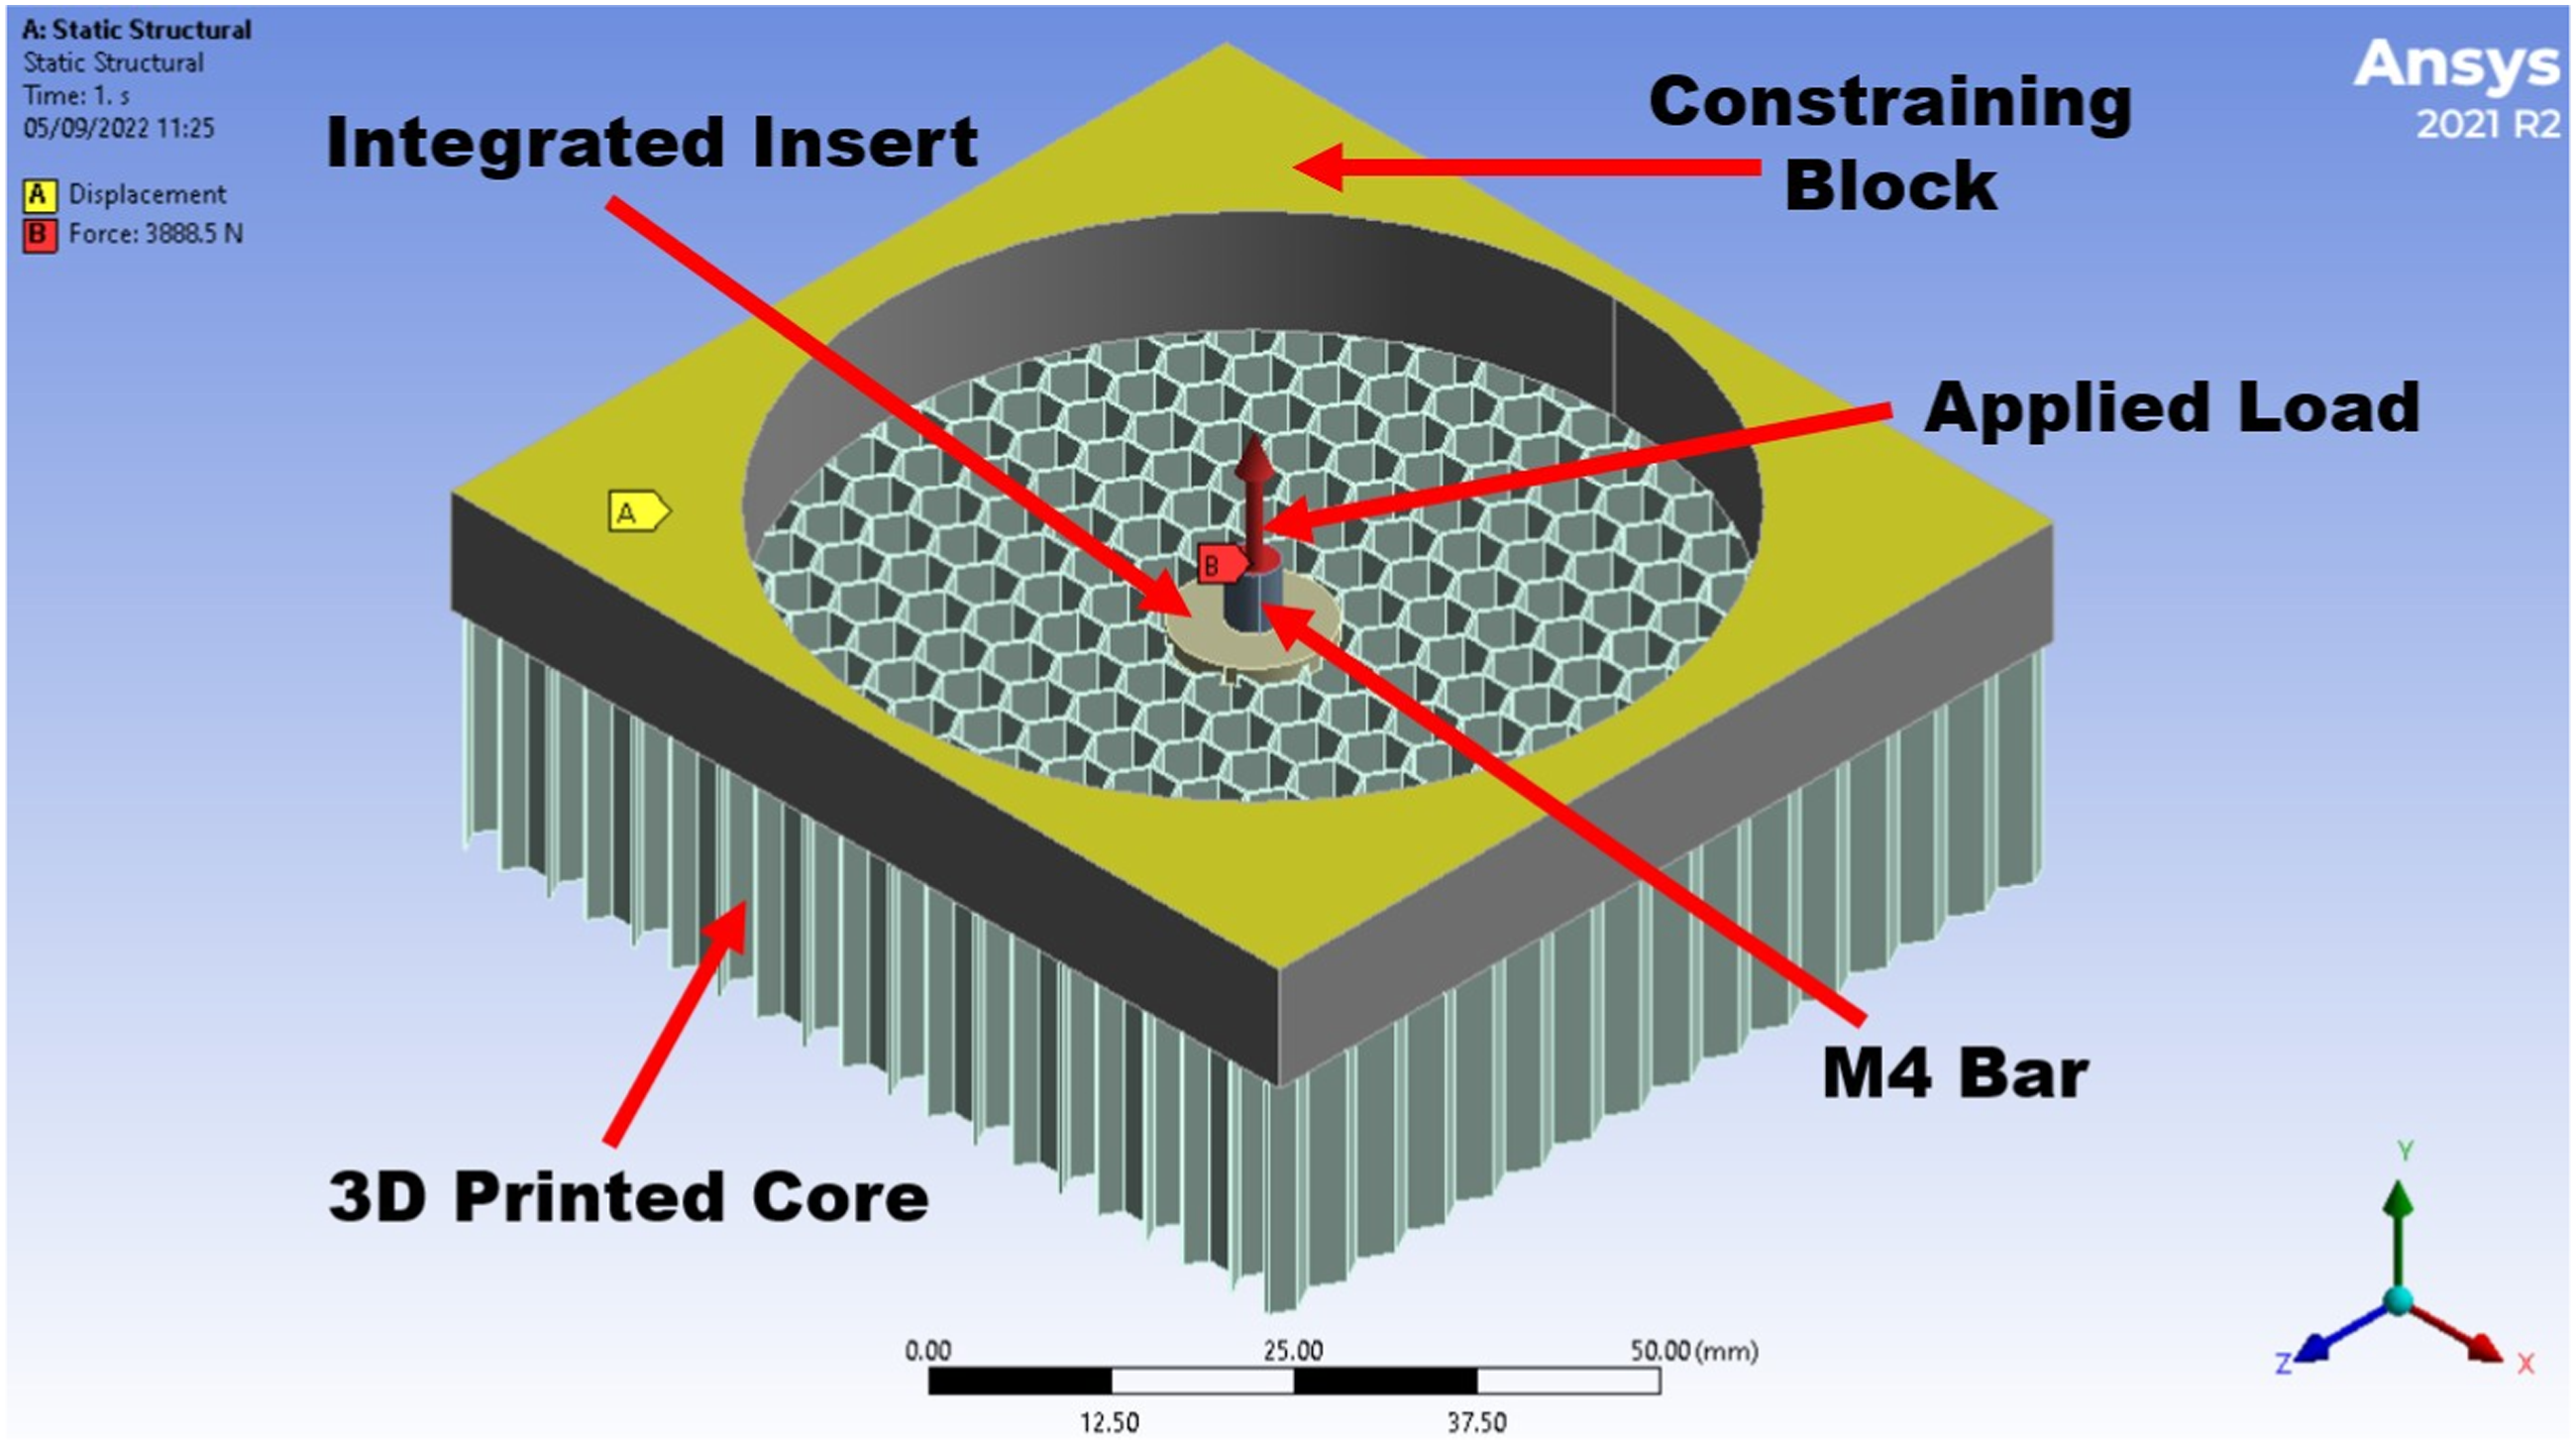
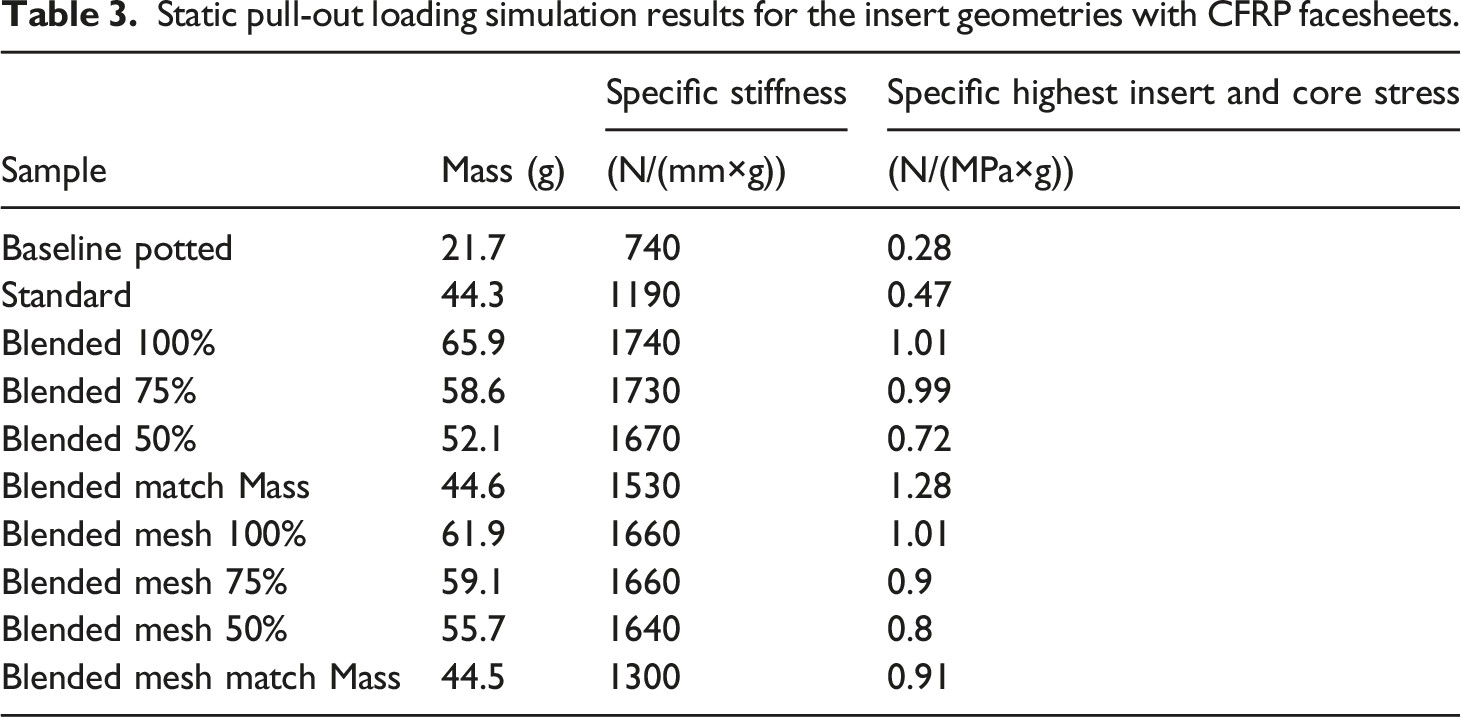
Static pull-out loading simulation results for the insert geometries with CFRP facesheets.
Static pull-out loading simulation results for insert geometries without facesheets.
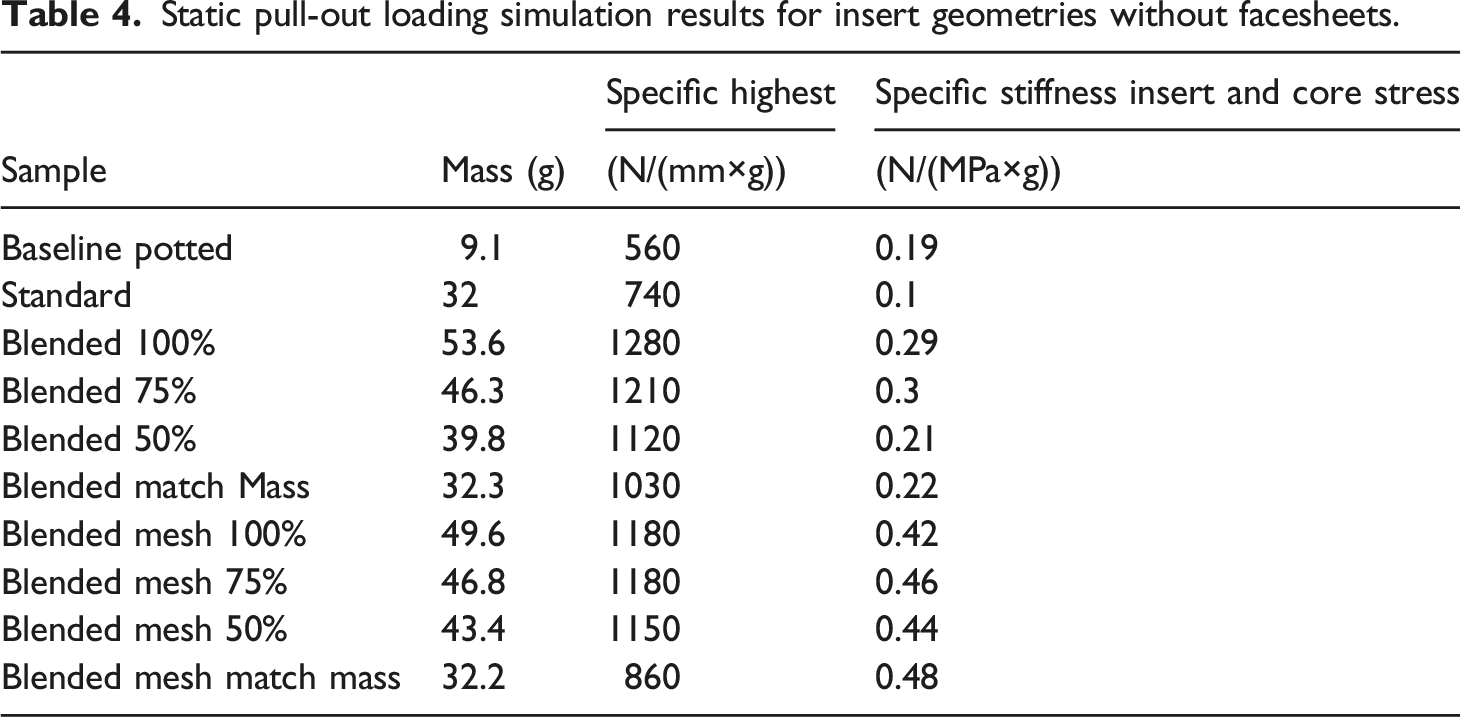
For both cases, with and without facesheets, the blended designs perform better than the standard printed design and the baseline potted insert for specific stiffness and specific stress. The relative performance for specific stiffness is the same for the two cases with the blended designs being around 5% stiffer than the blended mesh designs. In terms of specific stress, the blended and blended mesh geometries perform very similarly with facesheets, but without facesheets the blended mesh has between 50% and 110% better specific stress. This is because the blended mesh geometry shifts the highest stress location from the interface with the solid insert to the interface between the mesh and the rest of the core. This change in stress distribution makes the geometry effective in pull-out because the facesheets are more effective in carrying the load away from the insert rather than next to it.
The blended models that match the mass of the standard printed insert outperform the standard design in terms of both specific stress and specific stiffness. As a result, these optimised 3D printed geometries could be effective in replacing standard potted inserts if the printing technology allows. The challenge lies in being able to print cores that are light enough to either match the mass and improve the performance of current sandwich panel cores, or to match their performance for a lower mass.
Both with and without facesheets, all the geometries apart from the blended mesh design have their highest stress concentrations at the interface between the solid insert and the core walls. The blended mesh designs show potential in pushing the failure point further into the core.
Buckling simulations were also performed and the only insert which is prone to buckling with and without facesheets is the standard printed model. The other designs, including the baseline potted model, have the first buckling mode under the constraining plate rather than close to the solid insert showing that core buckling is not a relevant failure mode for these designs. As a result, the blended designs should have an increased failure load under pull-out testing compared with the standard printed insert. The baseline potted insert simply has other failure modes expected (discussed in the ECSSMET study 21 ) and due to its very thin walls which lead to high core stresses it should fail before the printed models.
The blended models have shown their performance potential, so the next step is to print and test a selection of these geometries.
Pull-out test results and discussion
Four of the optimised insert types listed in Table 1 were selected for pull-out testing. First, the designs which match the mass of the standard printed insert were picked because they are close to the manufacturing limit. As a result, their performance may be limited by the manufacturing quality and it is useful to understand if the performance improvement that these designs showed over the standard printed inserts will be reflected in testing. Second, the blended and the blended mesh models which match 75% of the reference area were selected because these models showed the best balance between mass and simulated pull-out performance. Before printing, the four geometries were further improved by adding fillets to relieve stresses at the core - insert interface for the blended design and at the mesh - core interface for the blended mesh design. The locations of the expected stress peaks for the final geometries are shown in Figure 9. Von Mises stress distribution for the four inserts tested. Predicted location of the highest stress labelled in red.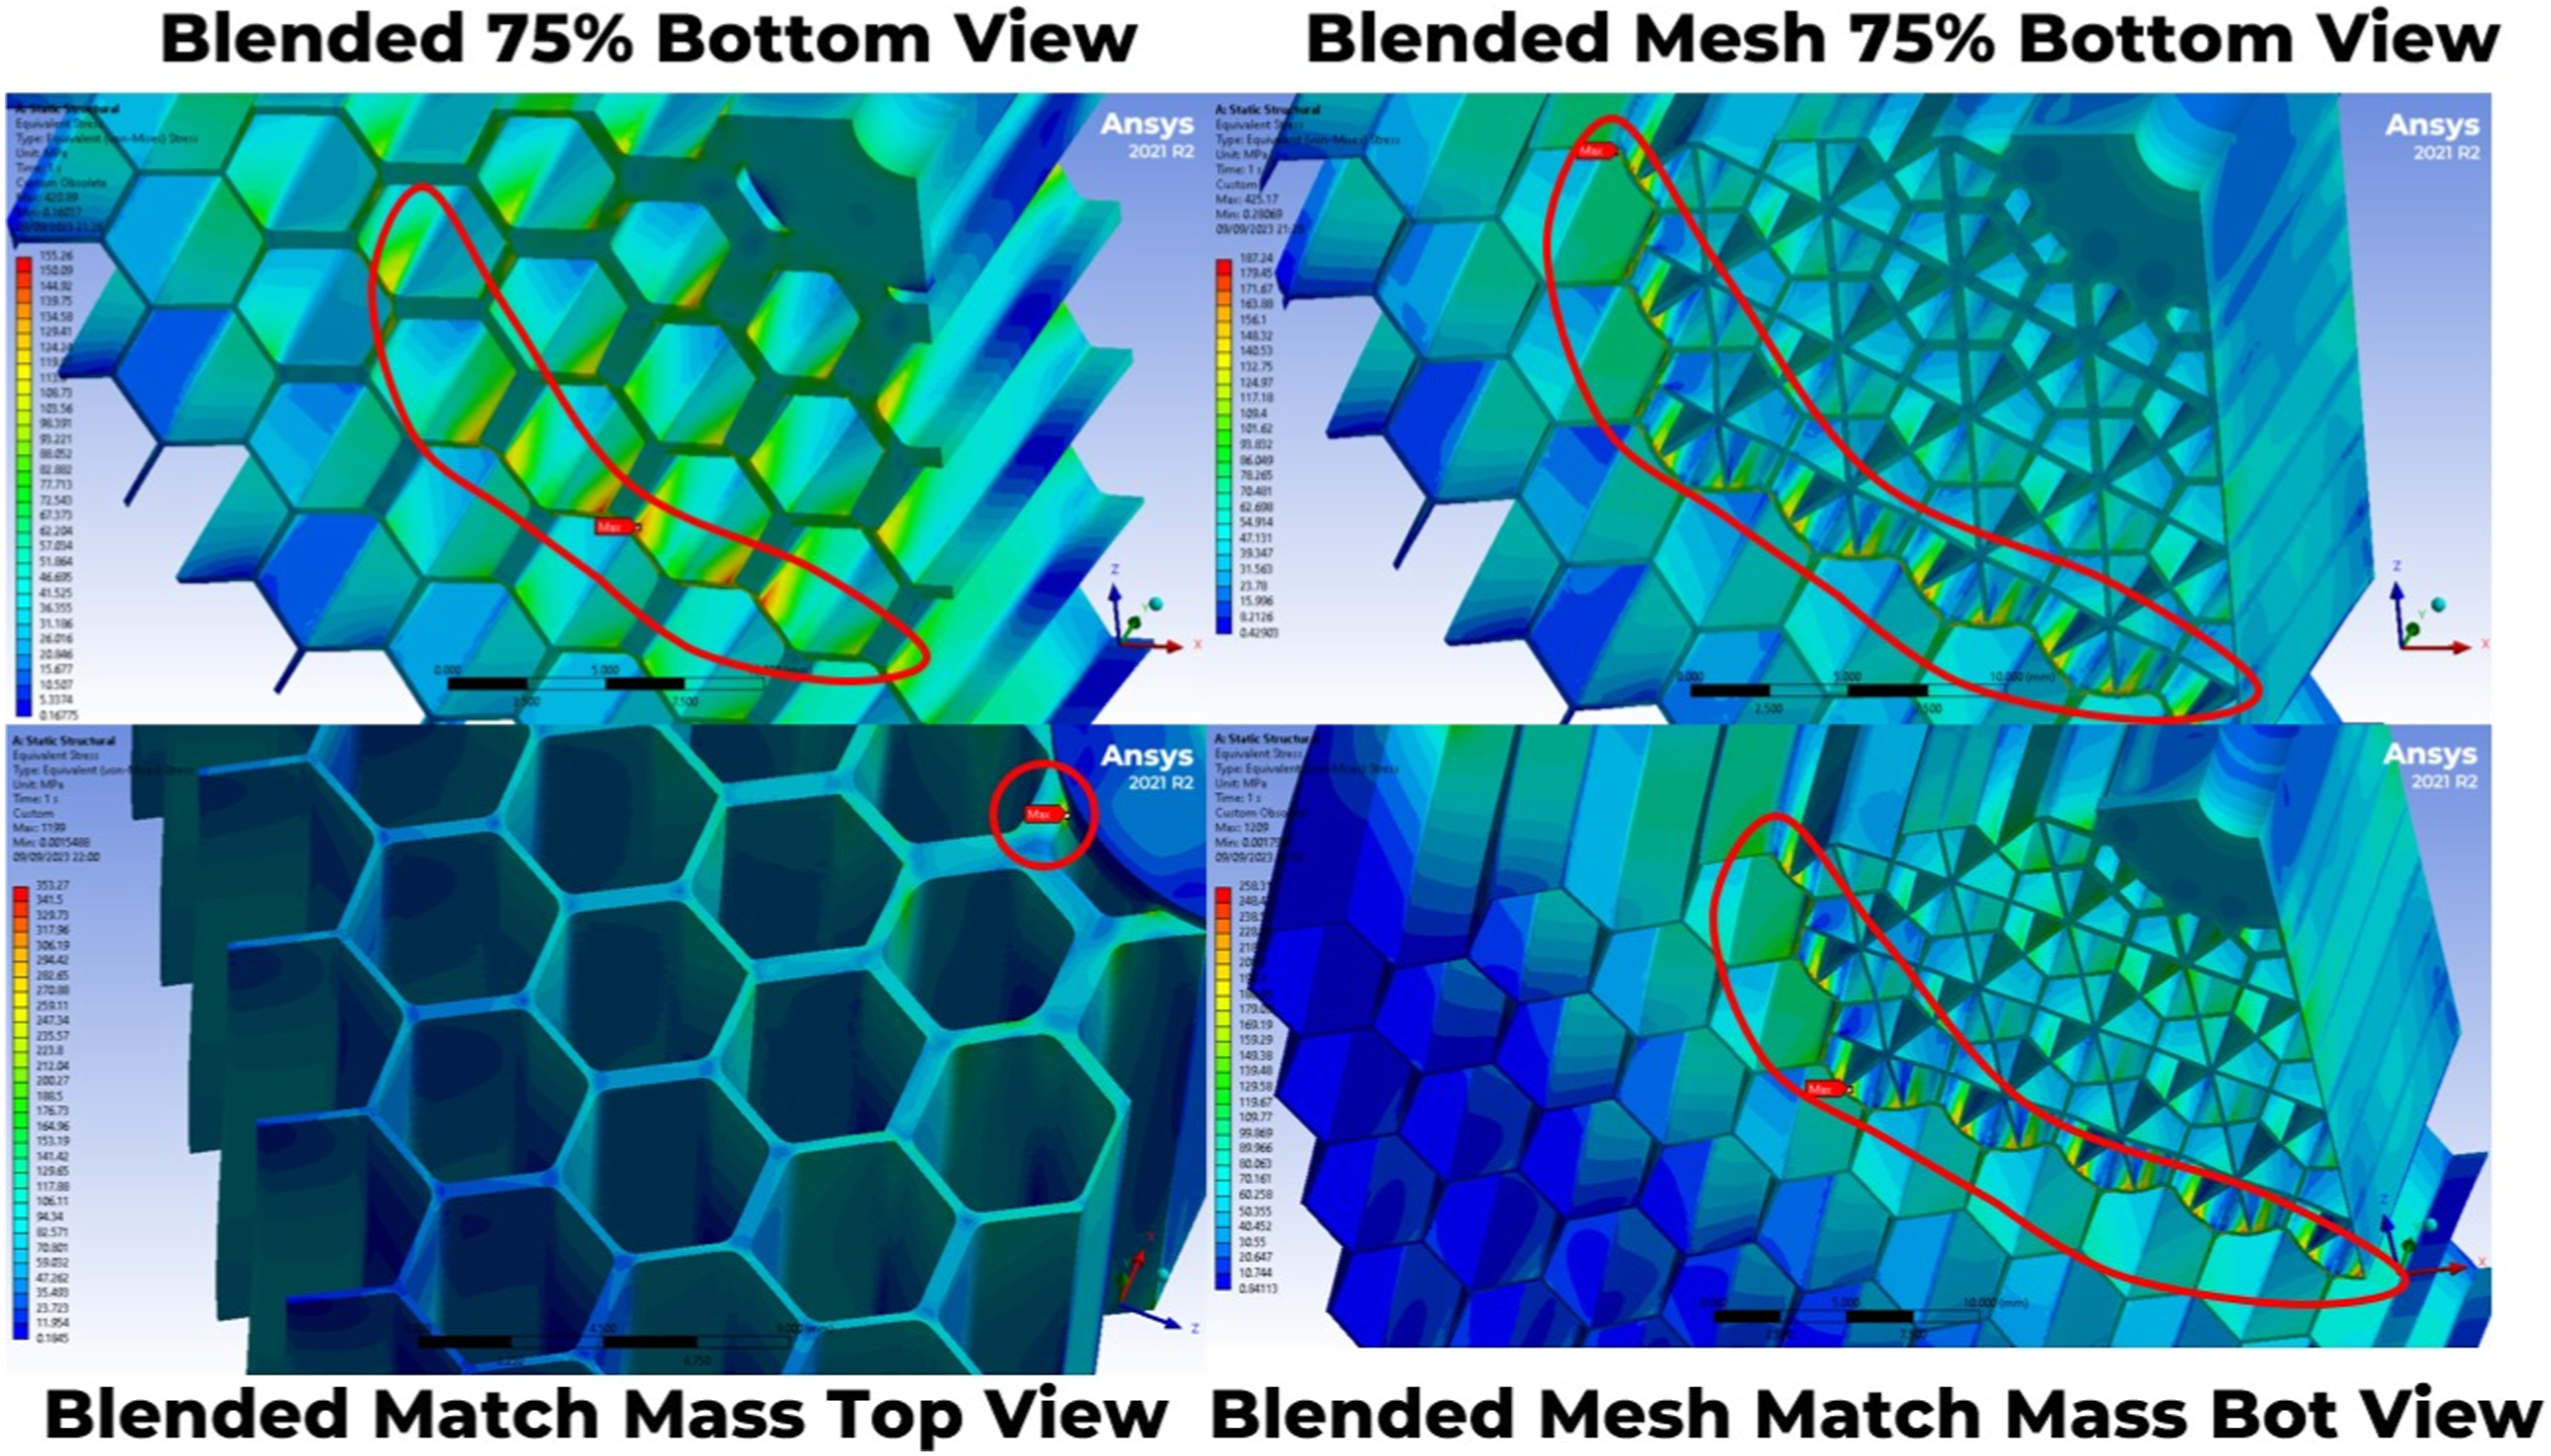
The blended mesh samples show a series of stress peaks under the load applied on the bottom face at the interface between the mesh geometry and the rest of the core, as intended by design. The blended 75% sample has a similar behaviour with stress peaks being located along a circumference where there is a drop in load bearing area. The blended match mass is the only sample with a predicted peak near the top insert flange, but it also shows a series of smaller stress concentrations away from the insert on the bottom face. At least three of the four designs are expected to fail far away from the solid insert which would enable an improved pull-out performance. As a result, two samples of each of the four types were 3D printed out of AlSi10Mg by Protolabs UK on an EOS 290 printer. The samples can be seen in Figure 10 and details about their dimensions and masses are listed in Table 5. The four optimised 3D printed honeycomb cores with integrated inserts. Characteristics of optimised 3D printed insert samples.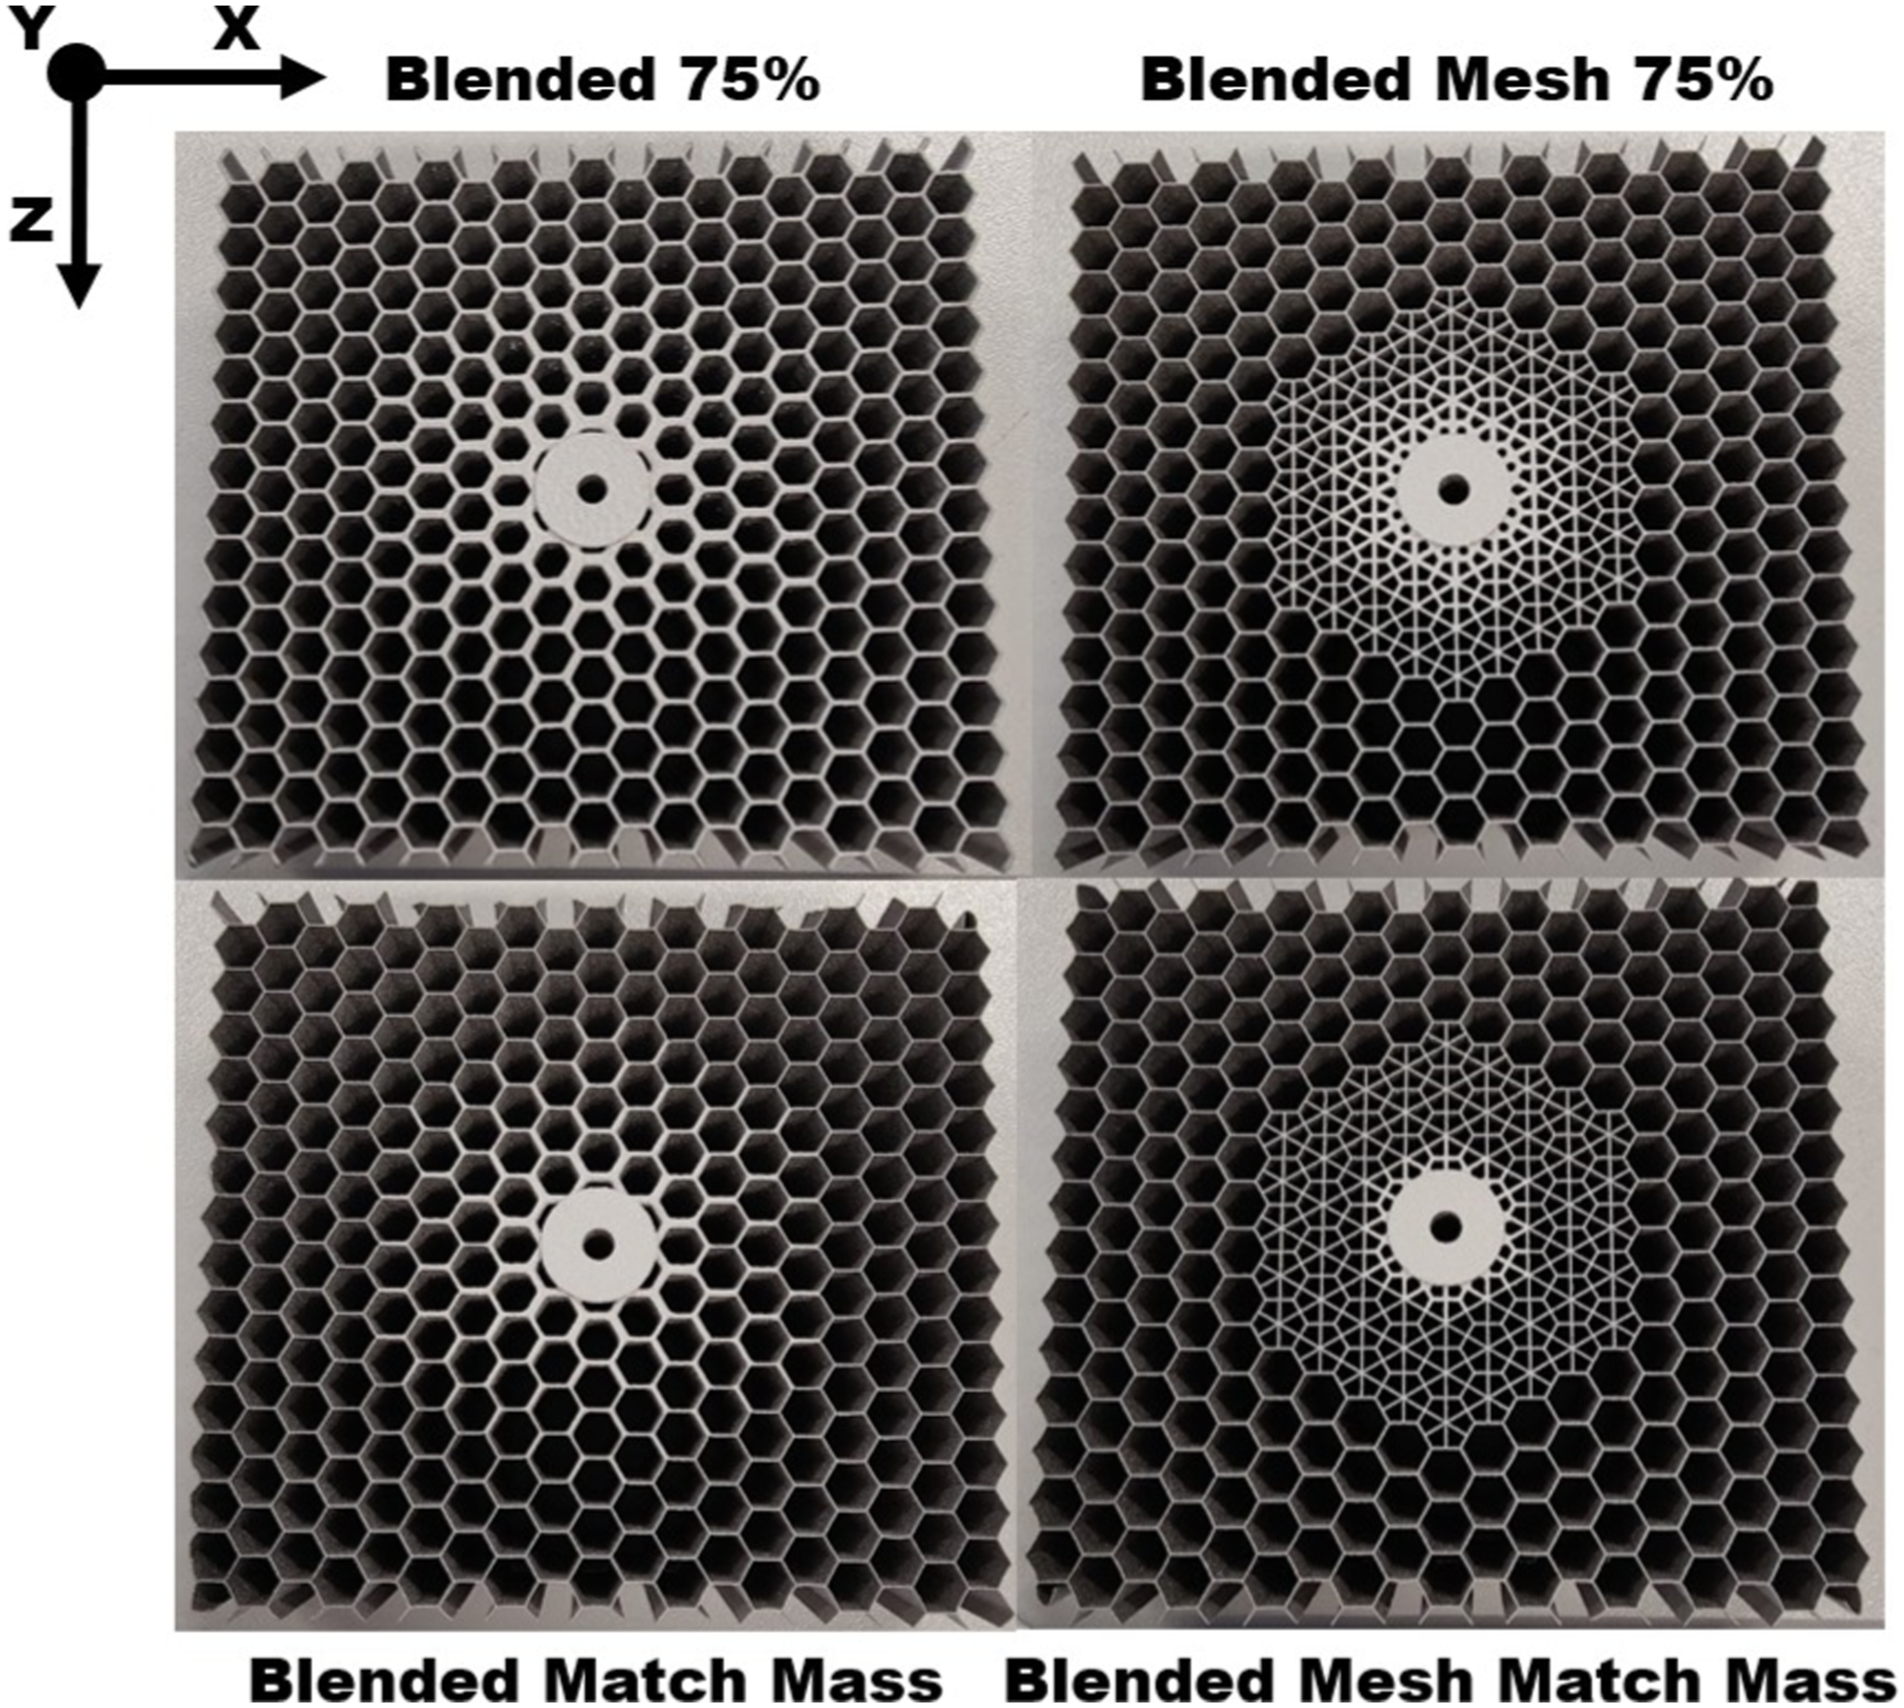
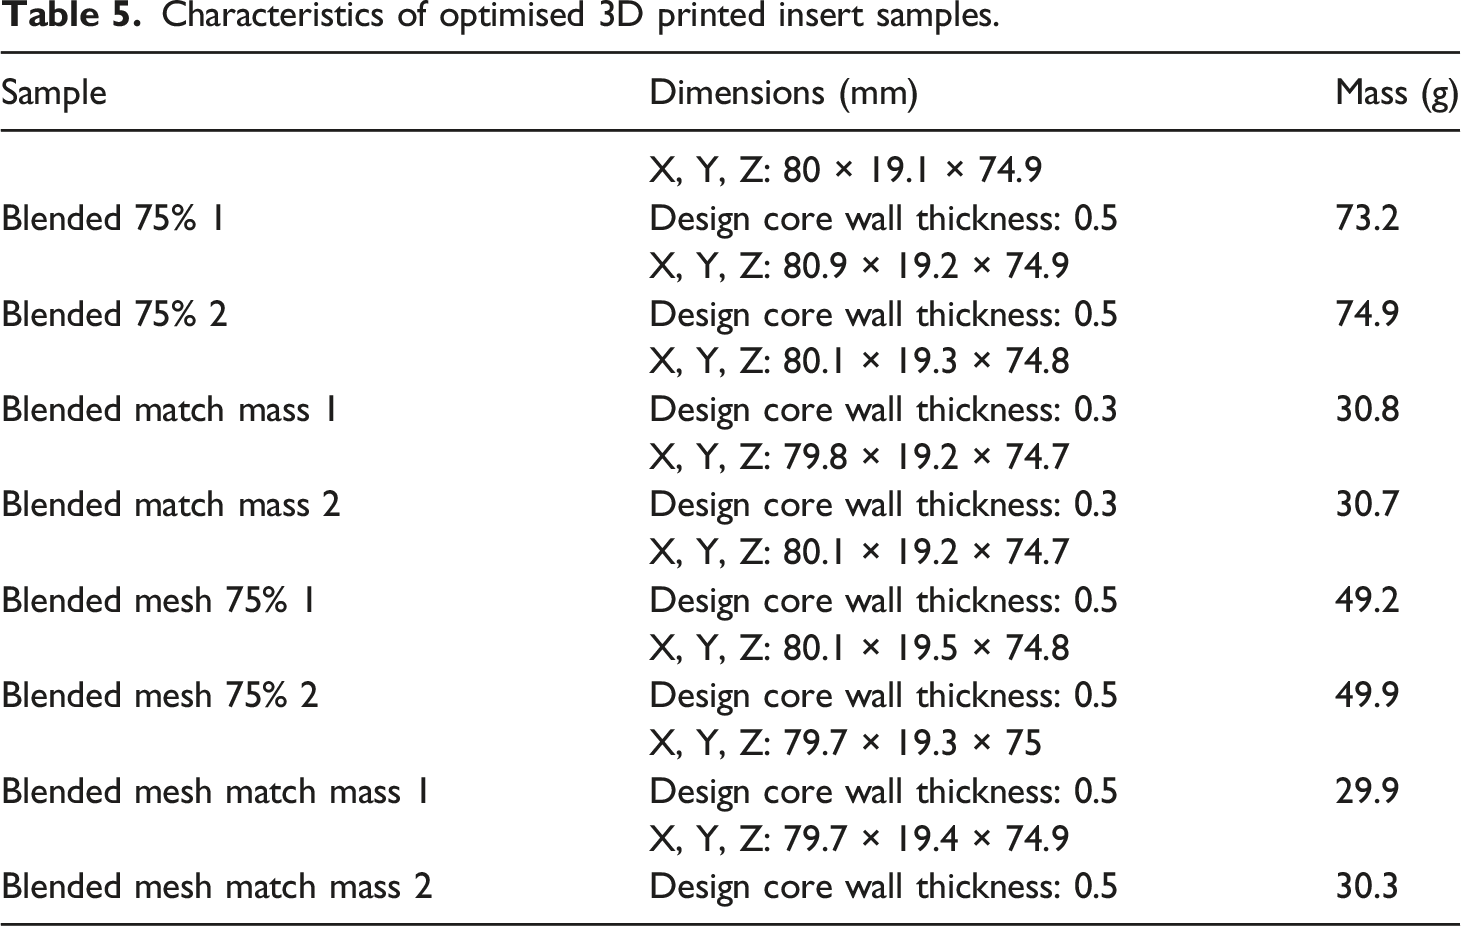
Note that due to an error, the two Blended 75% samples were printed with a higher layer thickness compared with the rest of the samples. The Protolabs EOS 290 AlSi10Mg metal printer has two layer thickness settings: 0.5 mm to 0.6 mm (normal resolution) and 0.3 mm to 0.4 mm (high resolution). The Blended 75% was printed with the former which means that the difference between the design and the print wall thickness is much smaller for the Blended 75% samples, hence their higher mass. However, the geometrical accuracy is lower due to the higher layer thickness and the honeycomb walls have indentations. Nonetheless, the specific performance comparison between this design and the other optimised geometries is still relevant.
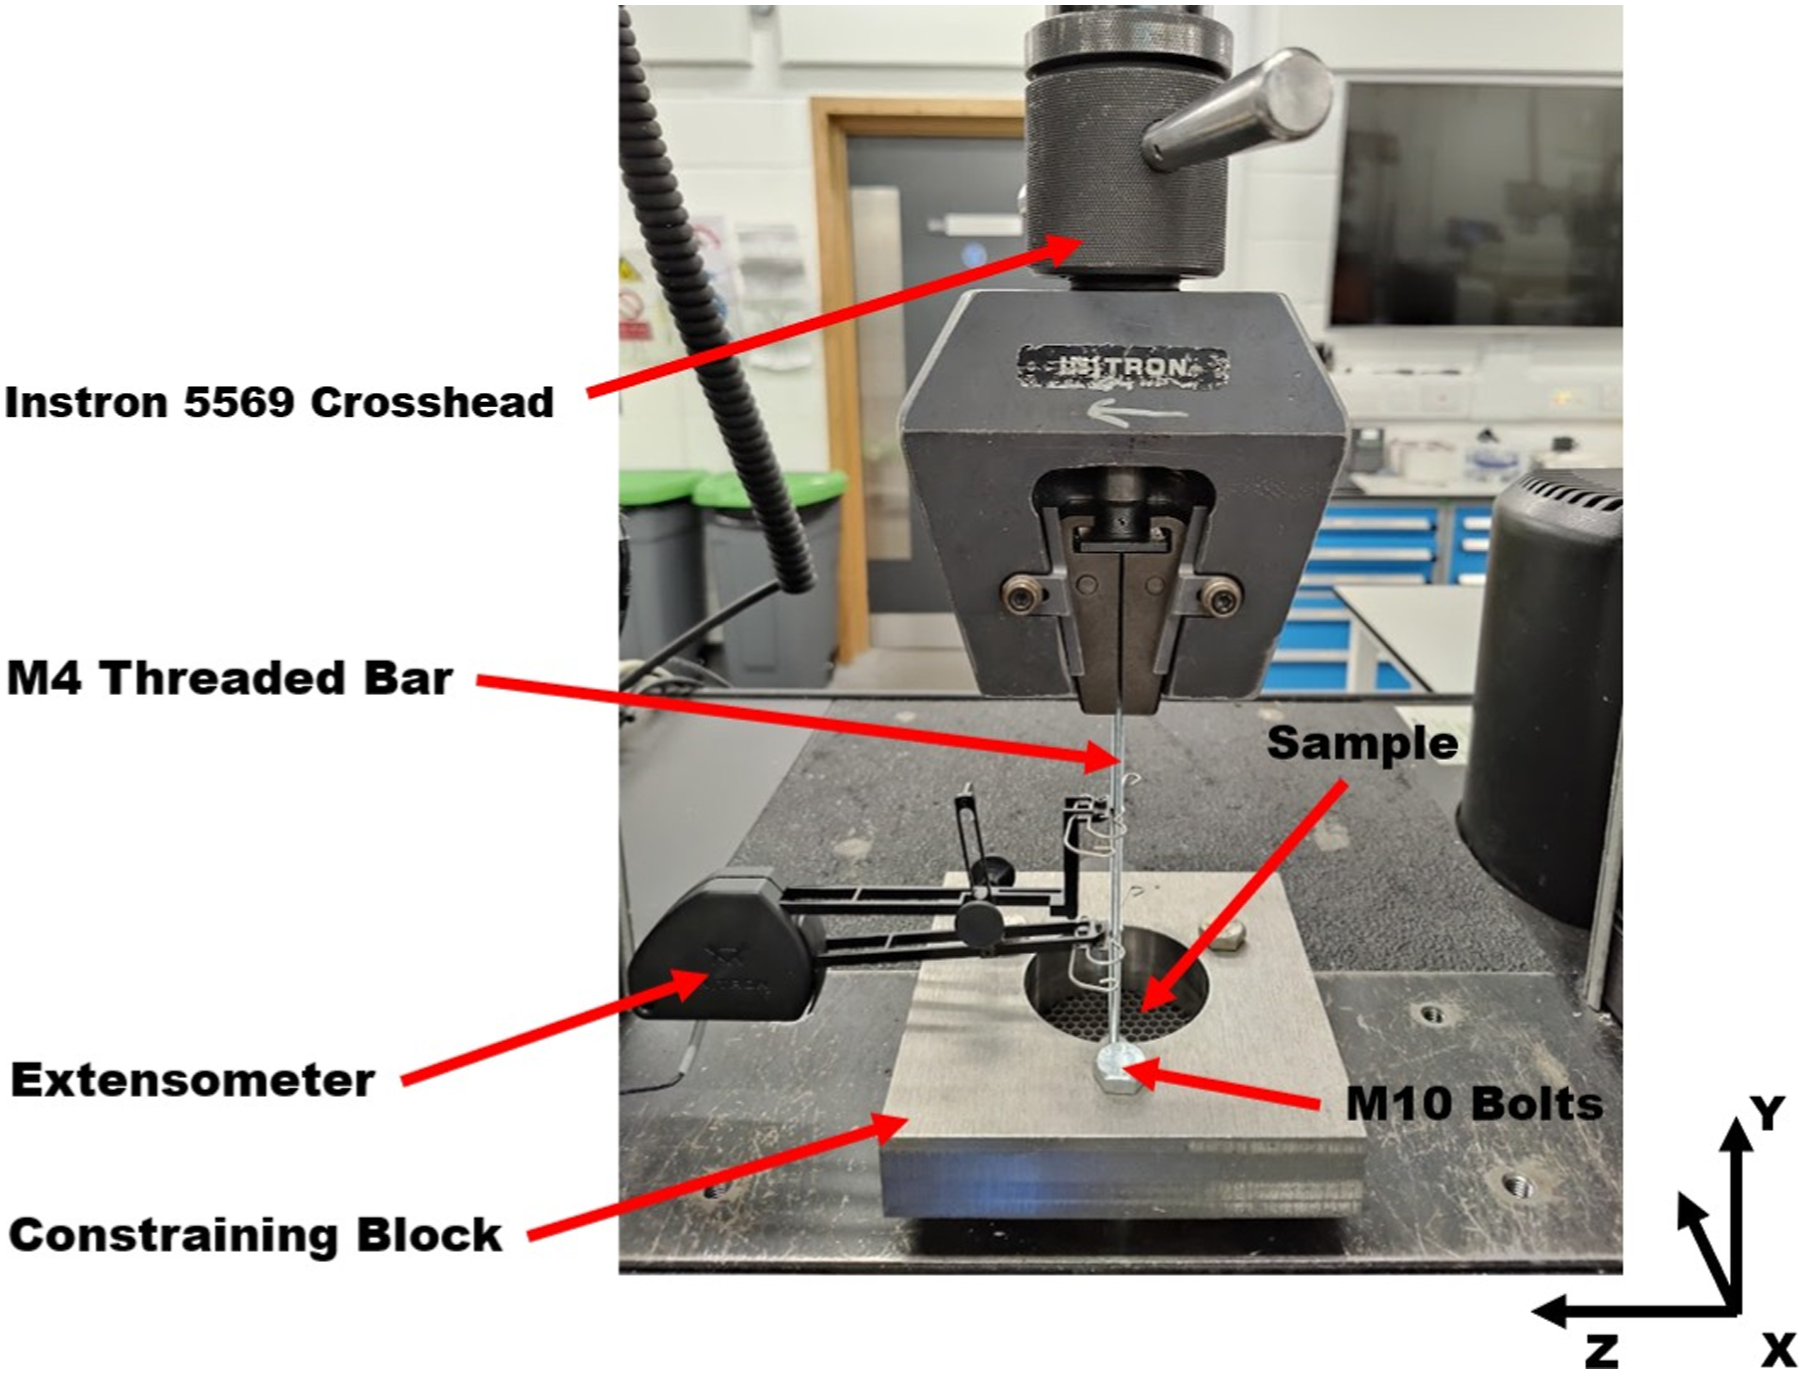
The samples were tapped and an M4 threaded bar was attached leaving a 2 mm insert wall thickness. The samples were then tested under normal pull-out loads on an Instron 5569 machine at a loading rate of 2 mm per minute, in accordance with ECSS.
20
The Instron 5569 at Southampton has a load limit of 50 kN and an uncertainty of measurement of ±0.49%. The experimental setup is shown in Figure 11. The samples were placed flat on the test bench and fixed with a stainless steel block that was connected to the test bench through three M10 bolts. Round grippers were used to fix the crosshead to the M4 threaded bar connected to the sample. The extensometer was placed on the M4 bar after all the other elements were fixed. Before starting the experiment, the strain gauge and the load cell were zeroed in order to ignore the forces and displacements that are produced by fixing the gripper to the sample. Experimental setup for pull-out testing. Similar to that presented at ECSSMET.
21
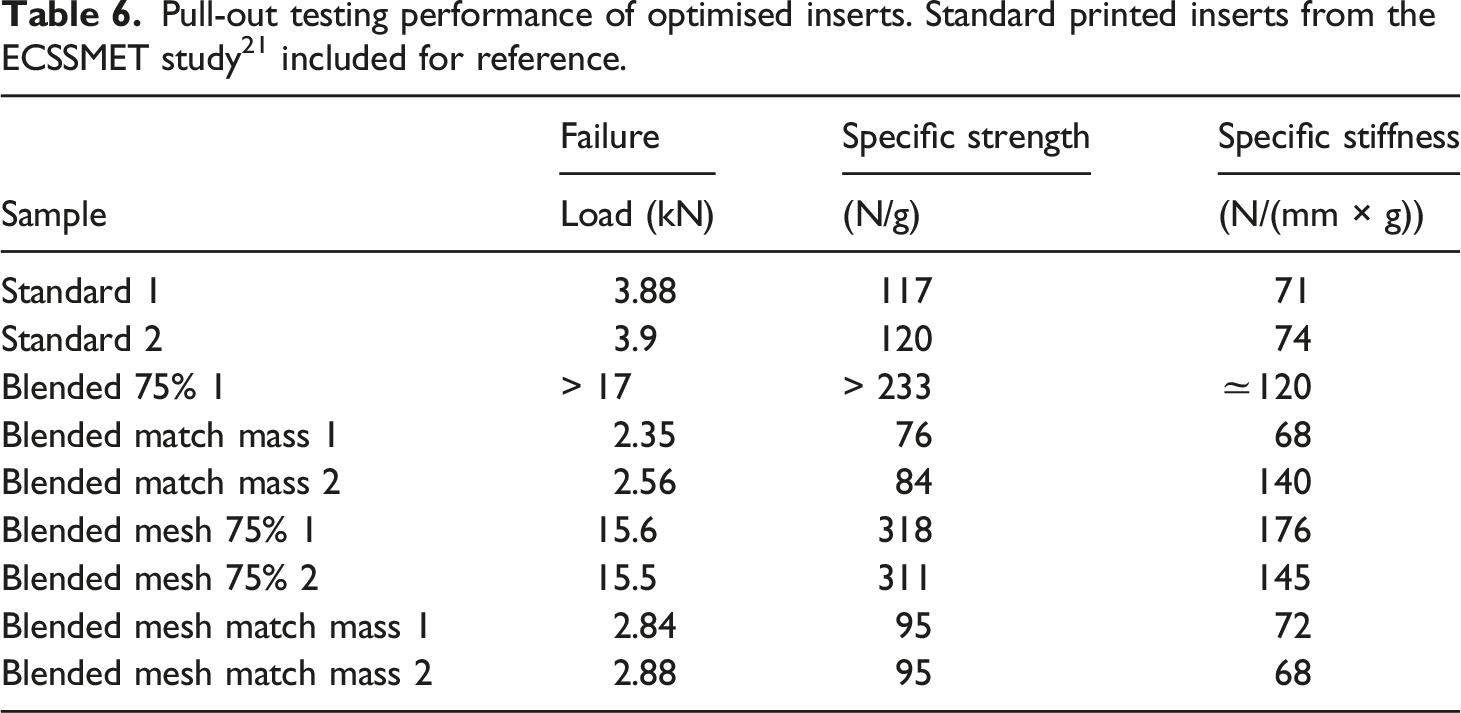
Pull-out testing performance of optimised inserts. Standard printed inserts from the ECSSMET study 21 included for reference.
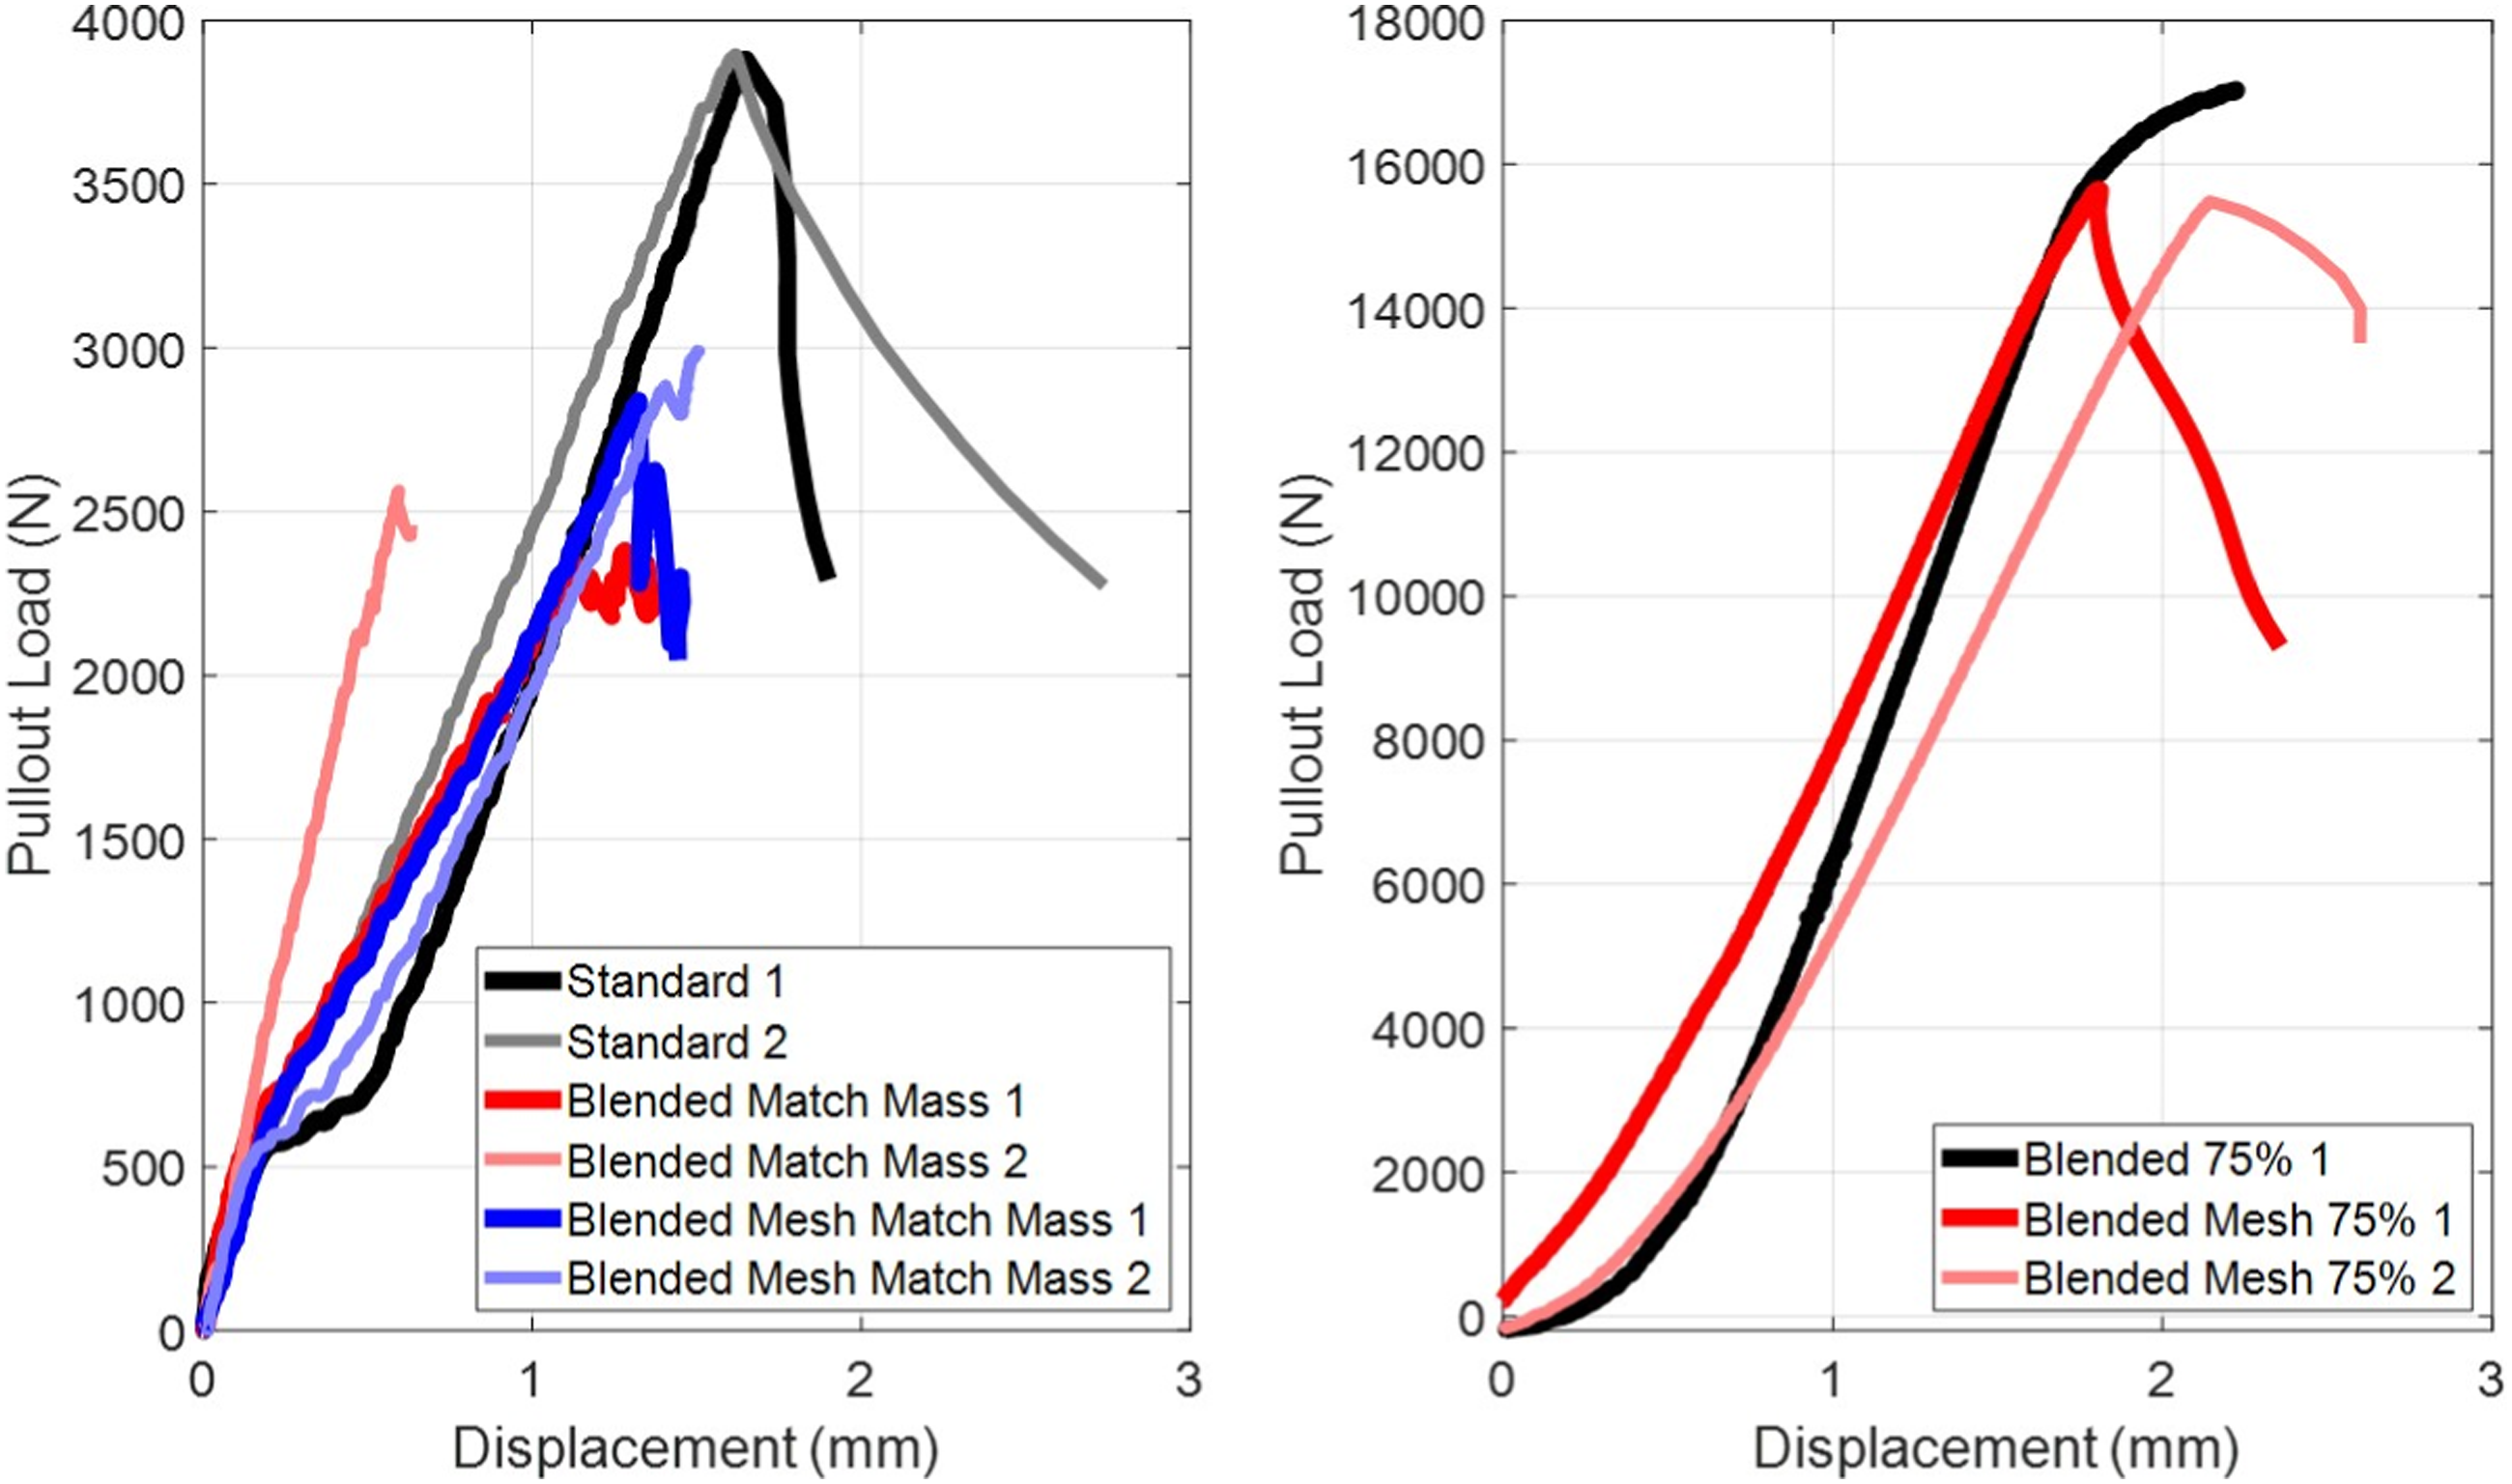
Force displacement curves for all pull-out experiments. Standard printed inserts from the ECSSMET study 21 included for reference.
It was expected that the samples that match 75% of the reference area would be stronger than the M4 stainless steel bar which should fail around 5 kN. An 8 mm diameter inner insert was used to account for the potential need to fit a larger threaded bar. Indeed, when testing the Blended Mesh 75% 1 sample the bar failed first around 5.4 kN. As a result, these four samples were tapped again to fit an M5 bar. When testing the same mesh sample, the M5 bar also reached its failure load of around 8.3 kN before any damage could be done to the sample. The blended designs had shown their potential by being stronger than the M5 bar, but their failure load had not been determined. A final re-tapping was done to fit an M6 bar. This left the inner insert with a wall thickness of 1 mm which was enough for an effective thread. The stronger blended and blended mesh samples were tested under these conditions and the results from Table 6 were obtained. A failure load for the Blended Mesh 75% samples was finally established, while the Blended 75% geometry proved to be stronger than the M6 bar which was close to failing around 17 kN. An M7 bar could not be fitted on these samples because the remaining insert wall thickness did not allow. Note that only one of the two Blended 75% samples was tested given that this geometry would not reach failure under the experimental conditions.
The experiments were stopped very shortly after the pull-out load started dropping and the samples were confirmed to have failed through visual and audio inputs because information on the failure location and failure modes had to be preserved for post test analysis. Looking at the plots in Figure 12, for all sample types apart from the blended match mass the two specimens that were tested have very similar force displacement curves. In the case of the blended match mass samples the second specimen started failing after 17 s, while the first specimen started cracking 11 s later, leading to a difference in stiffness at failure. The blended 75% sample plot was reported up to the point where the pull-out load stops increasing and the threaded bar continues to extend up to failure.
The Blended Mesh inserts have a specific strength almost three times higher than that of the standard printed inserts, while their specific stiffness is more than twice as high. The true failure load of the Blended 75% design has not been identified, but even if its performance was limited by the M6 bar, this design still has a superior specific strength and stiffness compared with the standard design. This improvement is in line with the performance difference predicted by the pull-out simulations from Section 2, where the blended mesh 75% samples were two times stronger per unit mass than the standard printed design.
The lighter samples which match the mass of the standard printed insert fail sooner than the standard design. The specific performance superiority of the heavier samples is not translated to the lighter samples due to the very low wall thicknesses in these designs. The baseline core has a print wall thickness of only 0.165 mm which means that the interface between the core and the insert is very weak. From previous work analyzing the quality of thin walled honeycomb cores
22
it was concluded that at a design wall thickness of below 0.5 mm, the honeycomb walls have significant flaws and pores. These print flaws are shown in Figure 13 which depicts a CT scan of a honeycomb core with a design thickness of 0.3 mm. The scan has a 3 µm resolution and was performed on the 160 kVp (10W) Zeiss Xradia Versa 510 X-ray microscope CT scanner in the µv is laboratory at the University of Southampton. CT scan top view of a 3D printed honeycomb wall with 0.3 mm design wall thickness. Notice the difference between the design and the printed dimensions.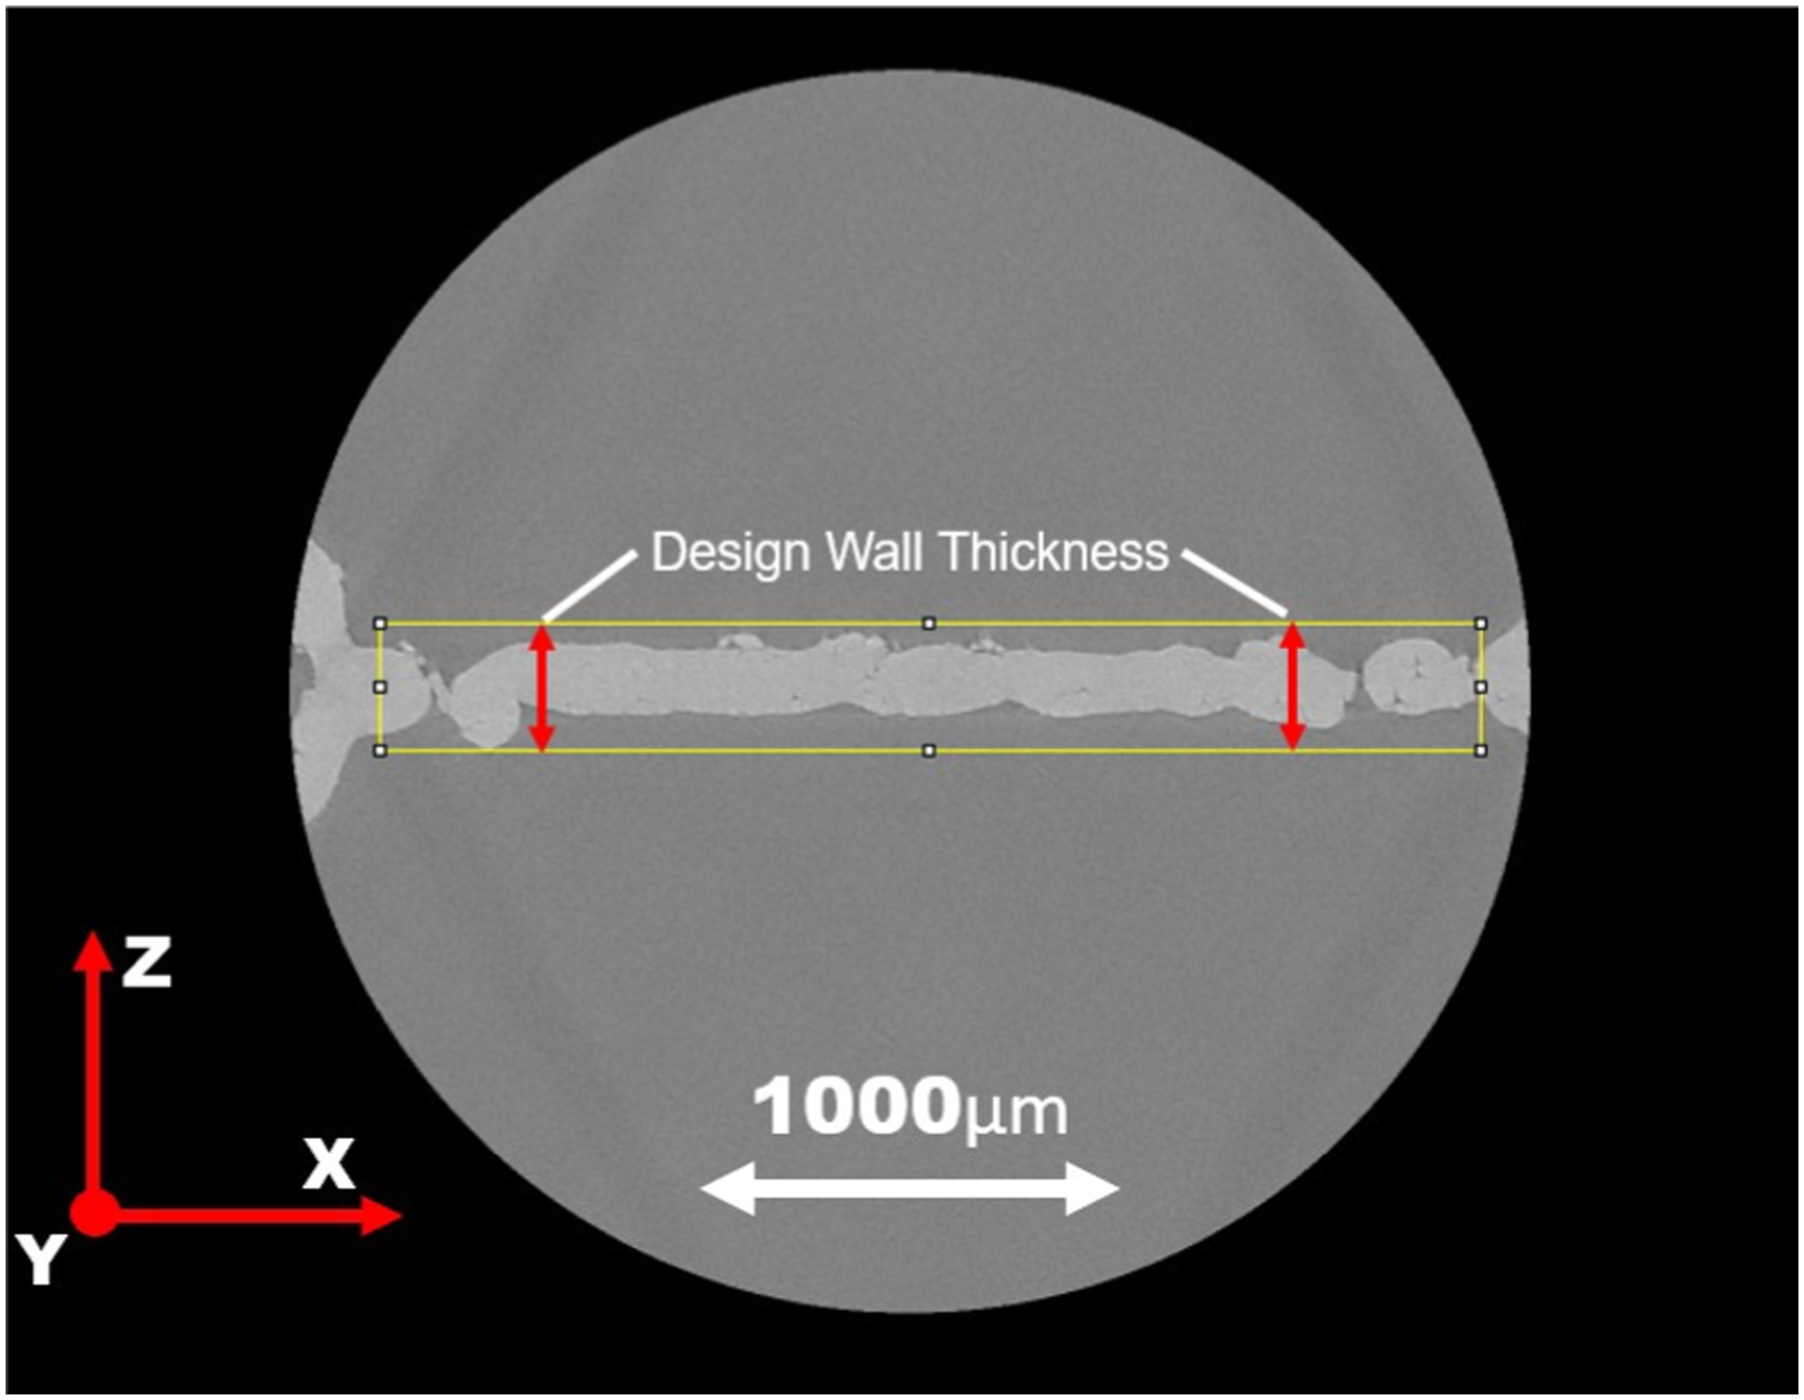
The Blended Mesh 75% samples fail at the interface between the blended mesh section and the baseline core, as they were designed to do and as can be seen in Figure 14. Top to bottom shear failure of the honeycomb walls at the insert-core interface occurs, while buckling no longer plays a role, as predicted in the FEM analysis. The lighter samples also fail at the interface between the blended section and the baseline core through a top to bottom shear failure of the walls also observed in Figure 14. Moving the failure point away from the bolt is proof of the effectiveness of the design. Three out of the four optimised printed inserts after pull-out testing. The arrows indicate failure locations.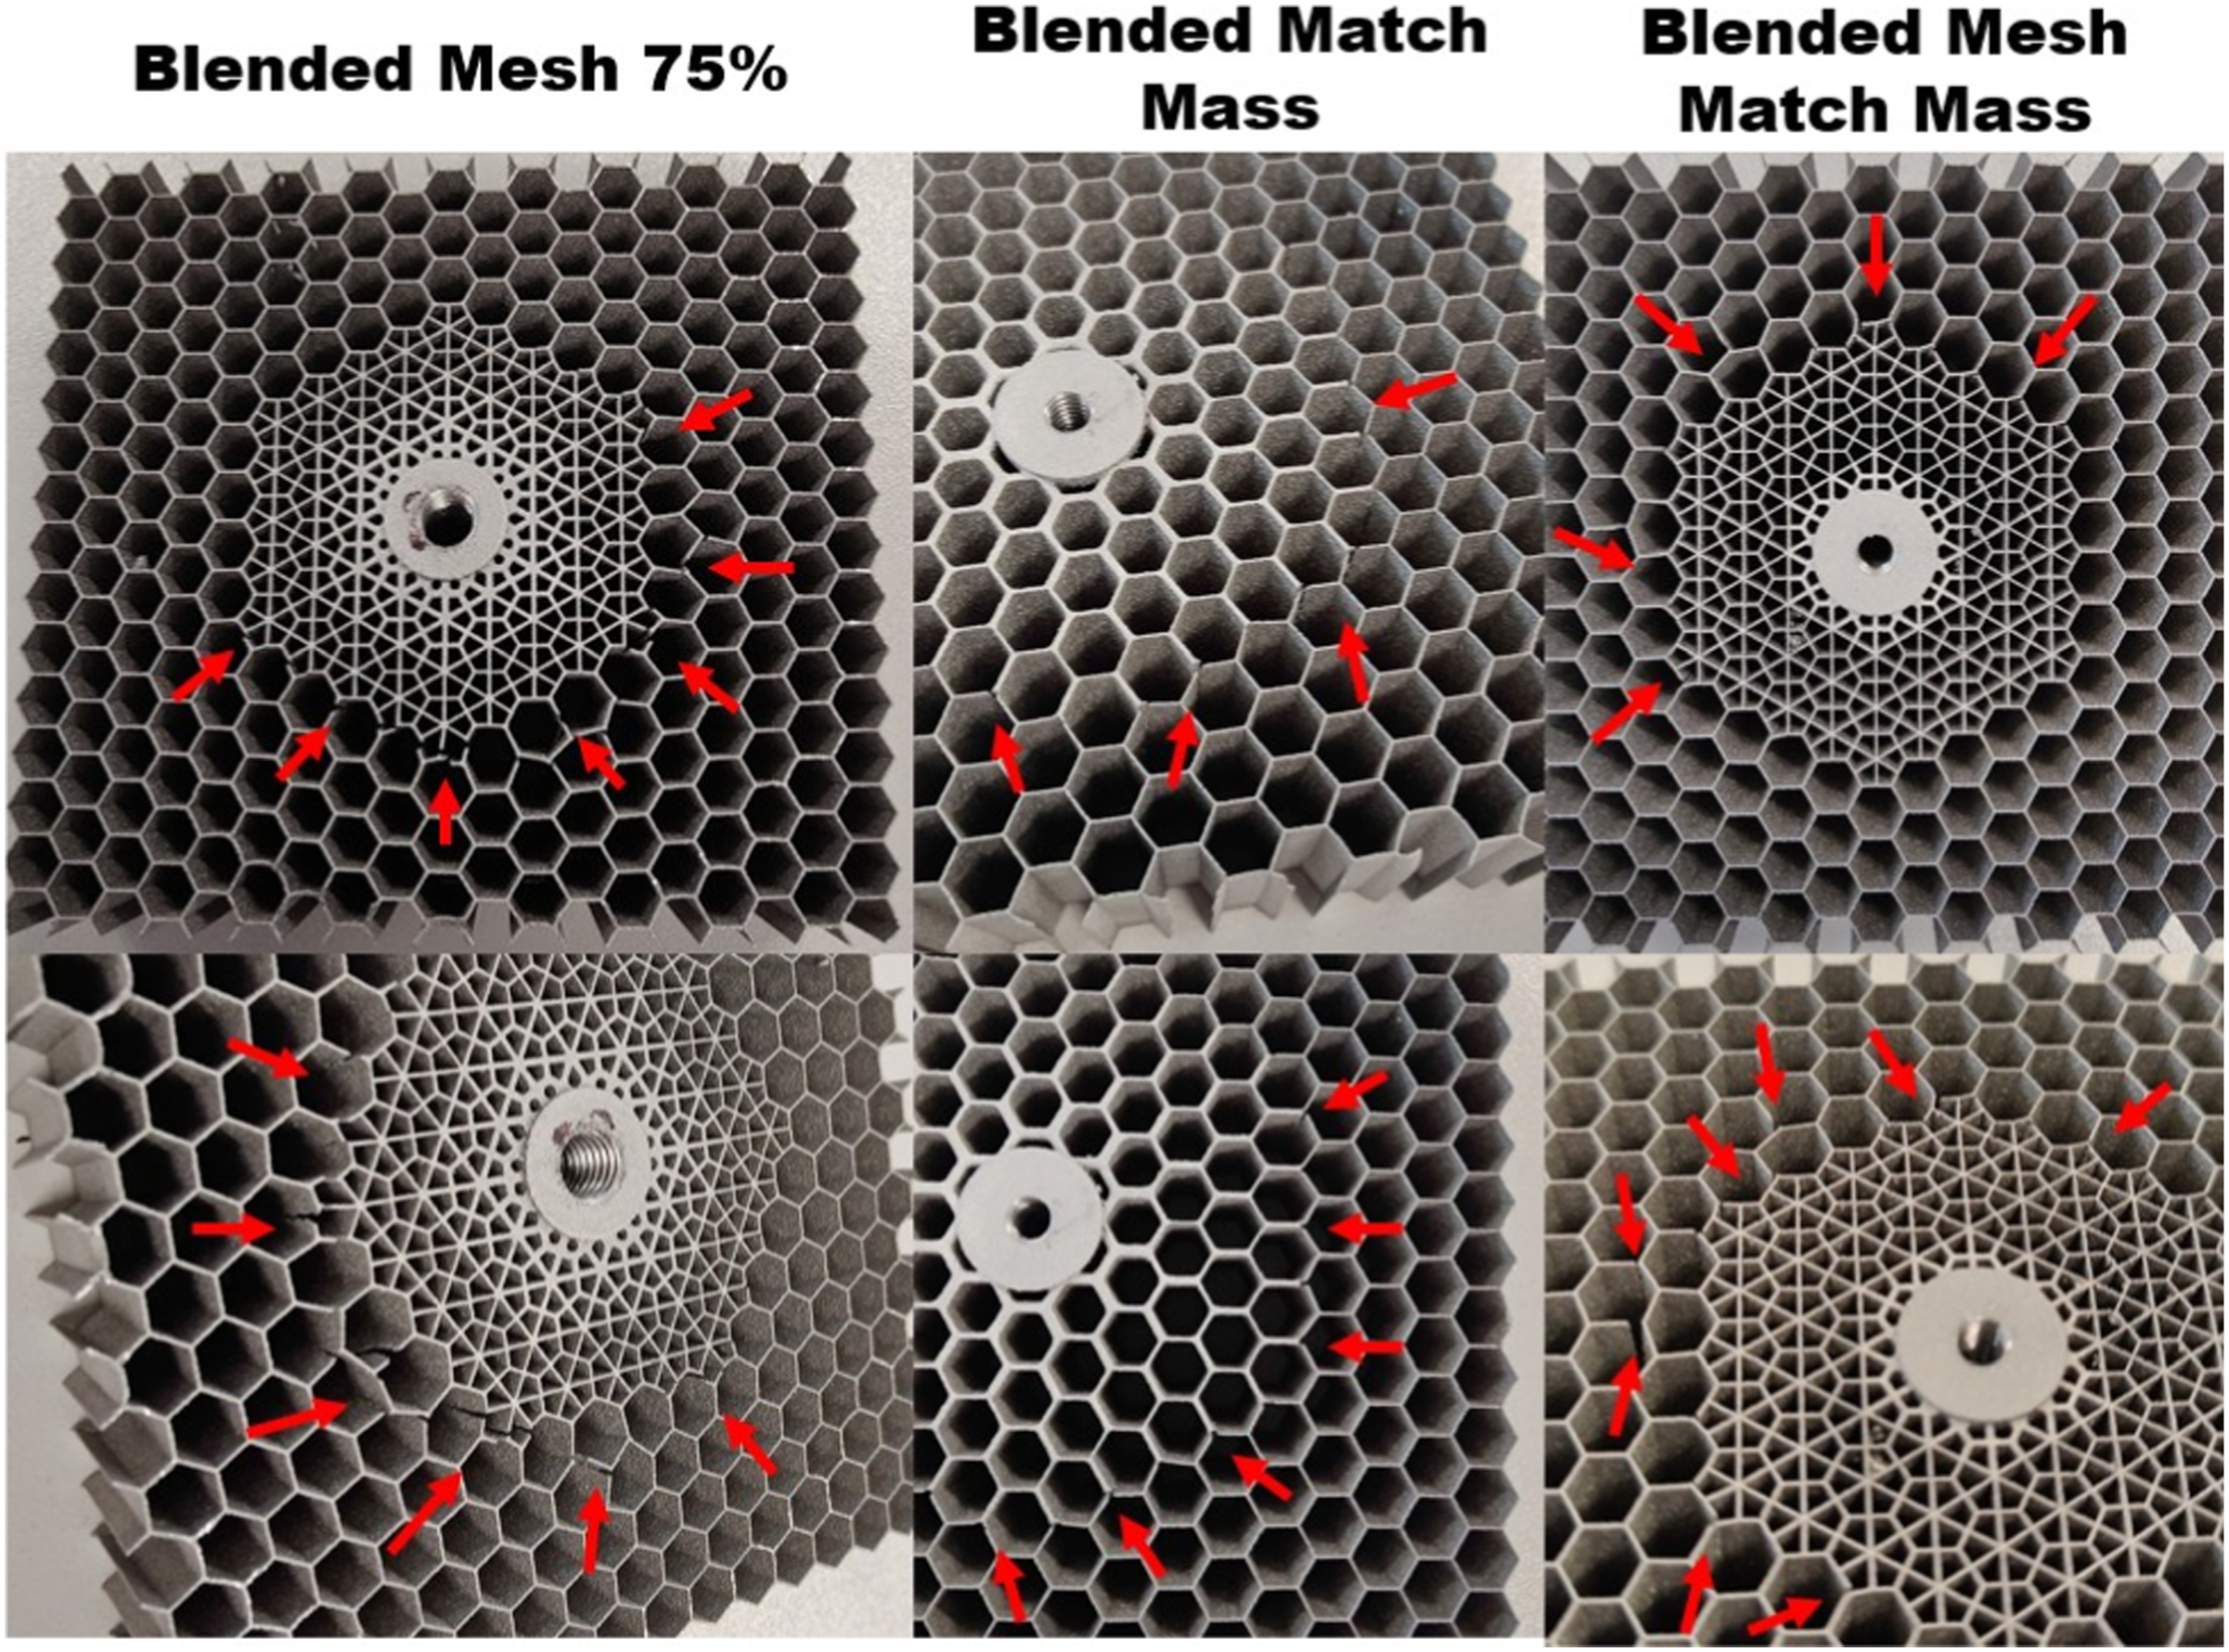
The fact that the experimental failure modes and locations on the sample are consistent to those predicted through the FEM analysis from Sections 2 and 3 gives confidence in the material model and in the fact that this design process can be extended to new core geometries and further studies with facesheets attached. The design philosophy of maintaining the cross sectional load bearing area constant with the radial position away from the bolt while also distributing this area evenly around the circumference is a solid base for designing printed inserts integrated into printed cores.
Based on the performance of the heavier blended samples and on the fact that all the optimised designs failed at the desired location away from the bolt, it can be concluded that the factor limiting the performance of the light optimised inserts is the 3D printing capability rather than the design itself. The paper introduces a set of very effective 3D printed insert designs which can lead to better performing and lighter sandwich panels especially in the context of future developments of printing technology.
Conclusions
Summary of pull-out performance for the blended inserts.
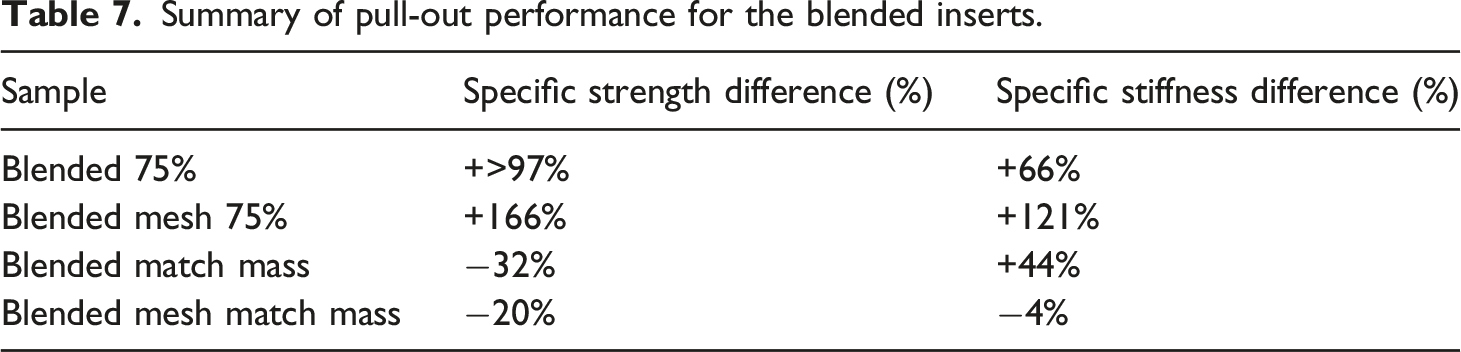
The heavier samples proved to be up to more than 2.5 times stronger and two times stiffer per unit mass compared to the standard printed insert, while the lighter samples performed worse than the standard design due to manufacturing limitations. All the blended designs moved the failure point away from the bolt to the insert-core interface, as predicted through FE analysis, and they avoided buckling failure.
Based on the FE analysis, the conclusions from the experiments without facesheets could be extended to the full sandwich panel because the geometries show similar locations for highest stress and similar failure modes with and without facesheets. Having understood the failure modes, the next step is to produce the full panel with CFRP facesheets and test it.
While the current cost of producing fully 3D printed AlSi10Mg sandwich panel cores with integrated inserts may be prohibitive in the present, as the average sample cost for this research was £425, additive manufacturing could reduce labour costs and production time compared with standard panel manufacturing. This research is a step in the direction of mass producing panel cores which will further reduce the unit cost.
The paper introduces a set of very effective 3D printed insert designs which could lead to better performing and lighter sandwich panels that can save mass, cost and time. The designs have potential especially in the context of developments in printing technology which could further decrease the minimum print wall thickness. This design improvement can be implemented beyond the context of satellite panels, in any structural application that uses sandwich panels as the primary load bearing element.
Footnotes
Declaration of conflicting interests
The author(s) declared no potential conflicts of interest with respect to the research, authorship, and/or publication of this article.
Funding
The author(s) received no financial support for the research, authorship, and/or publication of this article.