
Abstract
This paper aims to characterize the intrinsic mechanical behavior of an eco-friendly foam core used in sandwich materials dedicated to the maritime sector. A thorough understanding of intrinsic properties is essential for accurate dimensional structure characterization. The model setup is based on the choice of materials that meet the criteria of sustainable development, mechanical performance, and durability to promote ecological practices in the nautical industry. Experimental tests, instrumented by a digital image correlation technique, were carried out on two types of foams: polyvinyl chloride (PVC), which is the reference foam traditionally used in marine applications, and recycled polyethylene terephthalate (rPET), the substitute foam. The sample sizes recommended by compression test standards often lead to complex stress states that do not allow direct determination of the foam's intrinsic mechanical properties. Therefore, a finite element model updating method was required to identify the anisotropic elastic behavior of these two types of foams.
Introduction
Like most materials used for structures, sandwich materials are no exception to the current trend to replace traditional components with more eco-friendly counterparts. The difficulty in this substitution often comes from the inferior mechanical properties of the substitute materials, which calls into question the dimensioning of structures. The research project herein aims to define simple rules for designing sandwich materials based on eco-friendly materials for applications in the nautical field. The design is therefore based on the choice of environmentally friendly materials that can offer similar mechanical properties compared with traditional sandwich materials. In this paper, the core material is the one that will be studied. As such, polymer foams are often used as the core material of the sandwich structure. Commercially available polymeric foams for structural applications are polyvinyl chloride (PVC) foams, polyurethane (PU) foams, and polyethylene terephthalate (PET) foams. Polymer foams belong to the class known as solid foams, which are versatile materials. 1 They are also called cellular materials, where their porous solid structure comprises pores or cells filled with a gaseous phase. 2 Polymeric foams, being thermoplastic materials, can be manufactured by different manufacturing processes: injection foaming, extrusion foaming, and gelation. 3 All these foam manufacturing processes are carried out using the same steps to create their cellular structure. Generally, the compressive strength of polymeric foams is higher than their tensile strength4–7 because their cellular structure is better suited to withstand compressive rather than tensile forces. Accordingly, in most cases, polymeric foams are mainly loaded in compression. In the case of this loading mode, the homogeneous equivalent macroscopic mechanical behavior can be described by three main stages: 8 an initial linear elastic domain characterized by an equivalent elastic stiffness modulus and an equivalent transverse contraction coefficient, a plateau domain that can be described phenomenologically by yield stress and strain hardening slope, and finally, a densification domain, where the material exhibits volume type behavior. Francisco et al. 9 studied the mechanical behavior of closed-cell PVC foam under compressive loading. They observed that heterogeneity and anisotropy greatly influence the mechanical response of this material studied under different directions of compressive loading. For example, the yield stress and the compressive modulus are higher in the thickness or longitudinal direction of the foam (out-of-plane) than that in the transverse direction (in-plane). Luong et al. 10 studied the compressive properties of closed-cell PVC foam for different densities. As a result of their work, the density of the foam influences the force values at the peak and the plateau after the elastic part: foams with higher density offer better mechanical properties. Viana and Carlsson 11 concluded that cross-linked PVC foams with different densities have an almost isotropic behavior. This result was based on a study conducted by the authors to determine the mechanical properties (stress-strain response) and the fracture behavior of these materials. The study mainly consisted of tensile tests and a comparison of the stiffness modulus obtained along the two longitudinal and transverse directions. Volnei Tita et al. 12 studied the anisotropic mechanical behavior of polyvinyl chloride (PVC) foams with a density of 60 kg/m3 (Divinycell H60). This study discussed the challenges of assessing the mechanical properties of foams due to their anisotropy and heterogeneity.13,14 It was shown through experimental analysis how the foam's microstructure affects its mechanical behavior using both compression and tensile in two material directions, longitudinal and transverse. It was shown that the studied foam was transversely isotropic. However, the mechanical properties can vary significantly depending on the loading direction and the testing method, whereas the material's microstructure also affects the phenomenological response, failure mechanisms, and hardening curves. Many research articles have discussed collecting or estimating material properties for cellular materials, particularly for compression loading, using standardized methods.11,15 Much work has been done to study the mechanical behavior of polymeric foams, either on their experimental or numerical mechanical characteristics, such as the work of.5,7,16–19 However, none of these studies have led to the determination of the intrinsic parameters of the foams. Standardized tests concerning foams, mainly sandwiches, do not make it possible to directly identify intrinsic properties due to the geometry of the samples. These tests are most often conducted under multiaxial stress conditions due to the thin thickness of the foams, and the boundary conditions used in these tests are often not designed to ensure being in a homogeneous stress state. As a result, the data used by ship designers is approximative and, therefore, leads to oversized structures. As a viable solution, interpreting these tests requires numerical finite element modeling. This paper aims to determine, by a finite element model updating (FEMU) method,20–22 the intrinsic elastic parameters of two types of foams: a regular PVC and a rPET, both having a density of 80 kg/m3, in order to study the potential substitution of the former with the latter, thus providing a more environmentally friendly and sustainable alternative.
Materials and methods
PVC and recycled PET foams
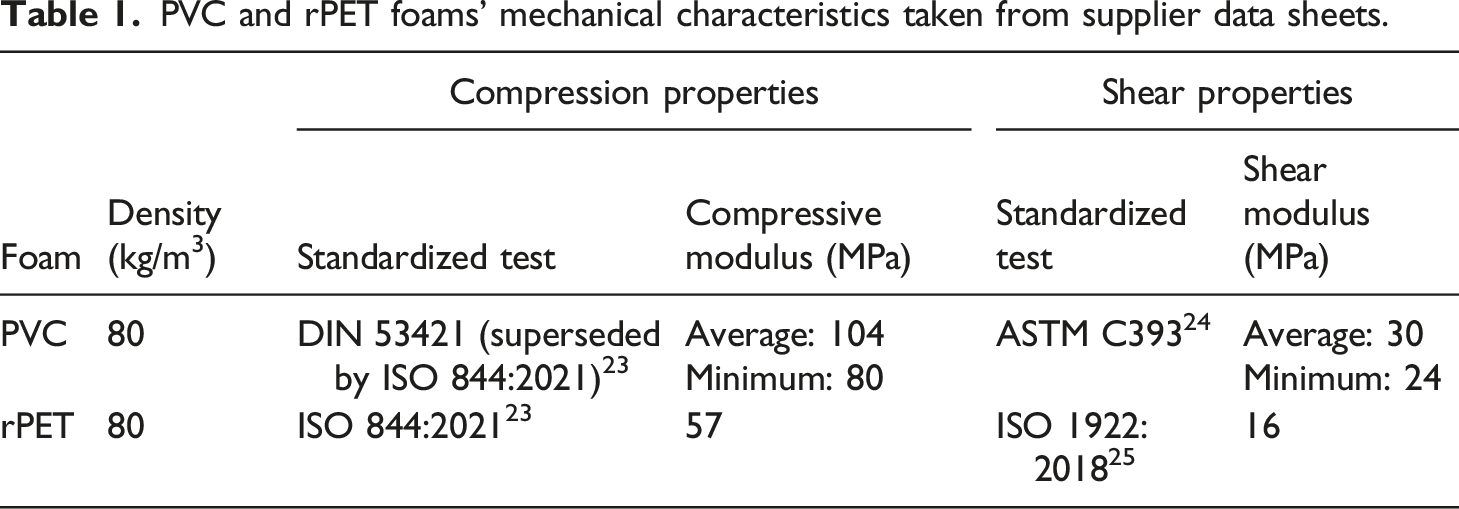
PVC and rPET foams’ mechanical characteristics taken from supplier data sheets.
Compression tests on foams
Based on ISO 844:2021 standard, the compression tests were performed using a MTS Criterion C45.105 machine equipped with a 1 kN load cell and instrumented by two CCD cameras to get the 2D full-field deformation measurements of the front and lateral faces of each specimen by digital image correlation technique. The cameras (SVS-Vistek svs2150XTLGEC model) equipped with 55 mm/F2.8 telecentric lens (Computar REC-M55 model) were positioned in front of these faces to record images of resolution 1920 × 1080 (pixel size 75 µm) at a sampling rate of 5 fps. The compression was carried out by applying a displacement on the top face of the specimen. The crosshead speed was set for each specimen to obtain a strain rate of 1.1 × 10⁻² s−1. The evaluation of the in-plane strain tensors on each observed face of the sample by DIC technique was performed with a home-developed software called ‘CinEMA’
22
which enabled the calculation of the different apparent elastic modulus and transverse contraction coefficients. The evaluation of the strain tensor at the sample surface is based on local least-squares adjustment, using a linear fit of the displacement field around the considered point contained in the suitable gauge length. Two gauge lengths have been defined depending on whether an average deformation (global approach) or a deformation profile (local approach) is measured over the entire surface of the sample. While the deformation profiles, analyzed by DIC, are associated with a 2 mm (30 pixels) gauge length, the stress-strain curves are associated with a 14 mm (187 pixels) gauge length. The nominal stress is defined as the ratio between the uniaxial force recorded by the test equipment and the initial cross-sectional area of the sample. Sample dimensions are essential in such a study. The foam sheets used in this paper have a thickness of 15 mm, so to conduct a uniaxial compression test, specimen dimensions should have had a width less than or equal to half of its thickness, i.e., 7.5 mm. These tests are not feasible given the complexity of conducting compression tests on such small specimens and the size of the representative elementary volume (REV) of the morphology of these foams. Consequently, compression tests were conducted on larger samples, as ultimately recommended in the standards. However, these do not correspond to simple uniaxial compression tests but to triaxial compressions tests that do not directly lead to determining the intrinsic properties of the foams studied herein. In addition, it is essential to consider the representativity of the volume occupied relative to the pore size. If the specimen is too small compared to the pore size in the foam, it may result in a large dispersion in the compression measurements. Therefore, scanning electron microscopy (SEM) was used to verify the pore size in both foams. It helped to ensure that the specimen dimensions were appropriate for the pore size, and accordingly, the compression tests conducted would represent the foam’s properties. SEM visualizations at the same magnification along the thickness direction SEM results - (i) PVC foam, (ii) rPET foam.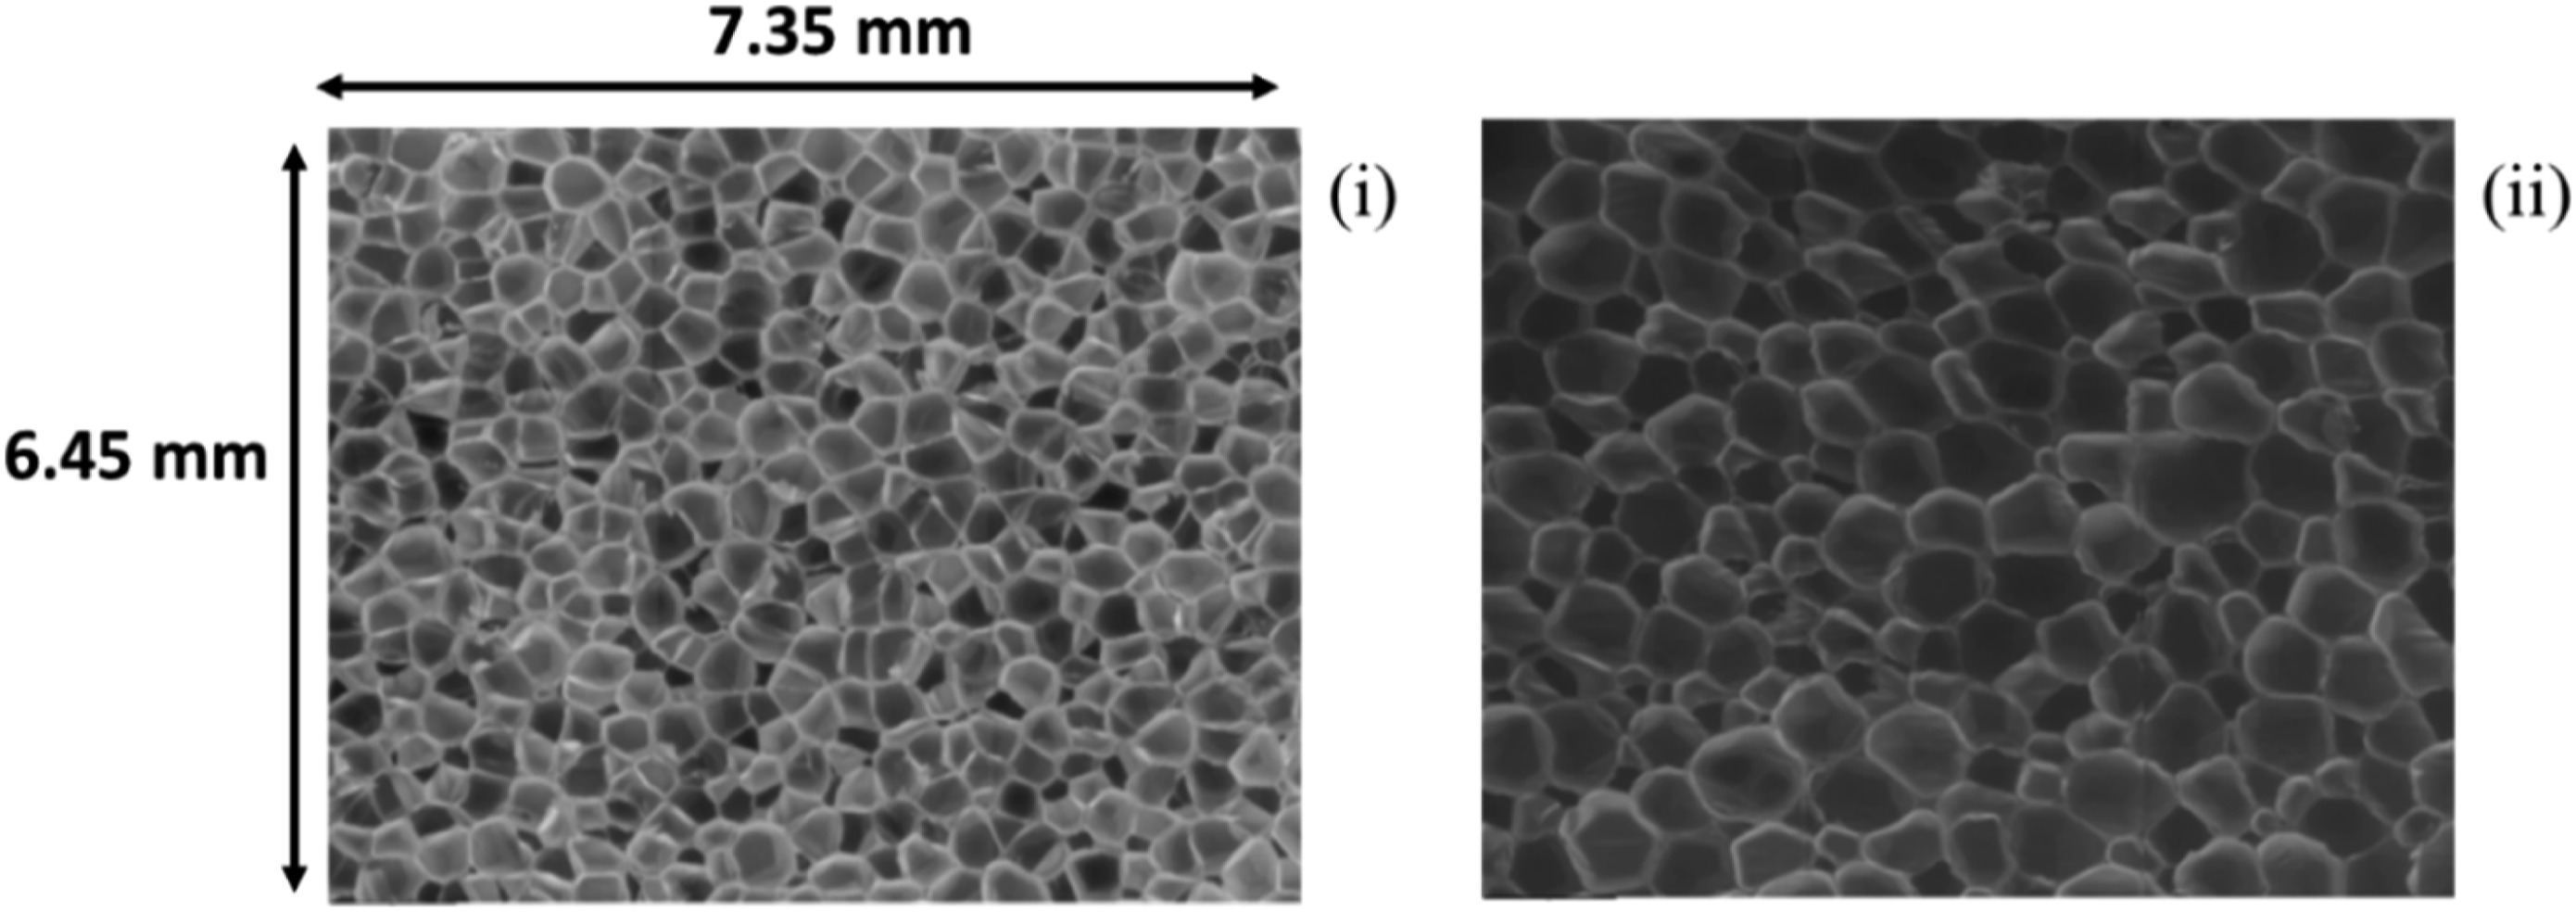
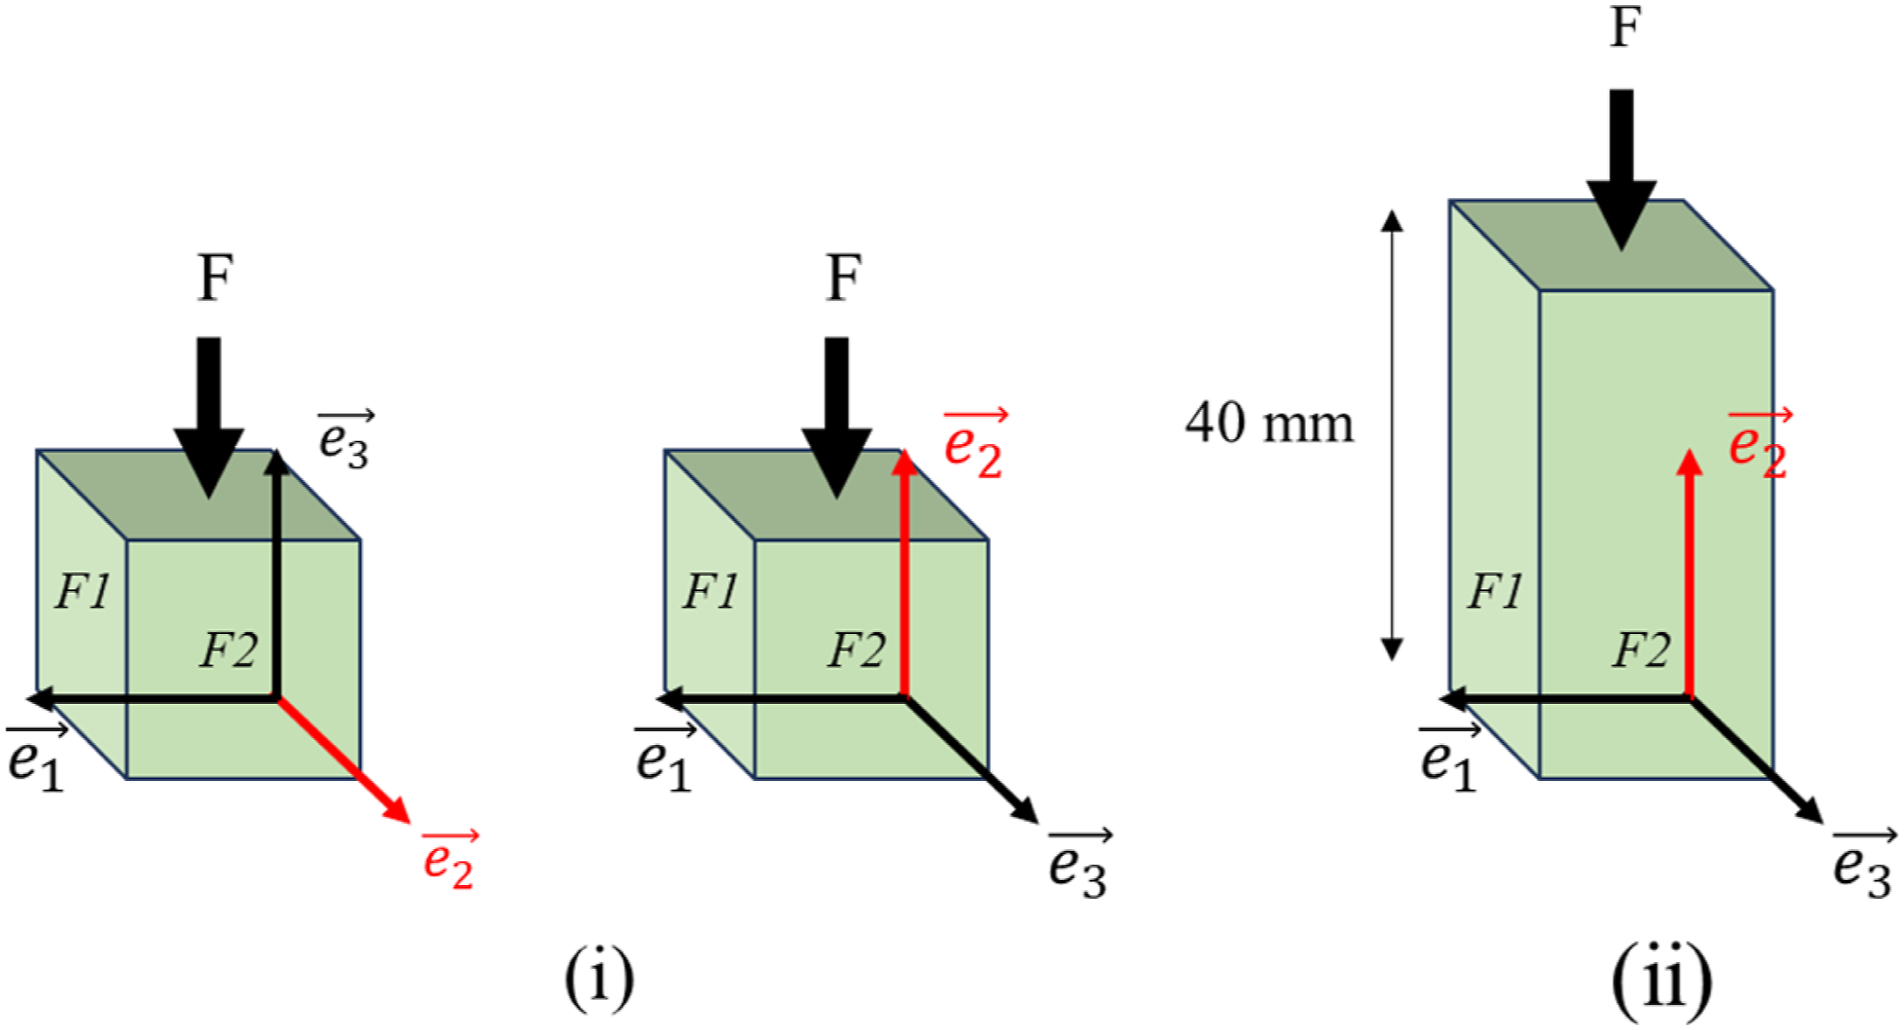
The pore size of the rPET foam was observed to be larger than that of PVC. Indeed, for both foams, the average area of the pores was calculated using ImageJ software, and the results are displayed in Figure 2 along the three normal directions, SEM results - Average pore area for PVC and rPET foams. (i) Triaxial compression test along the 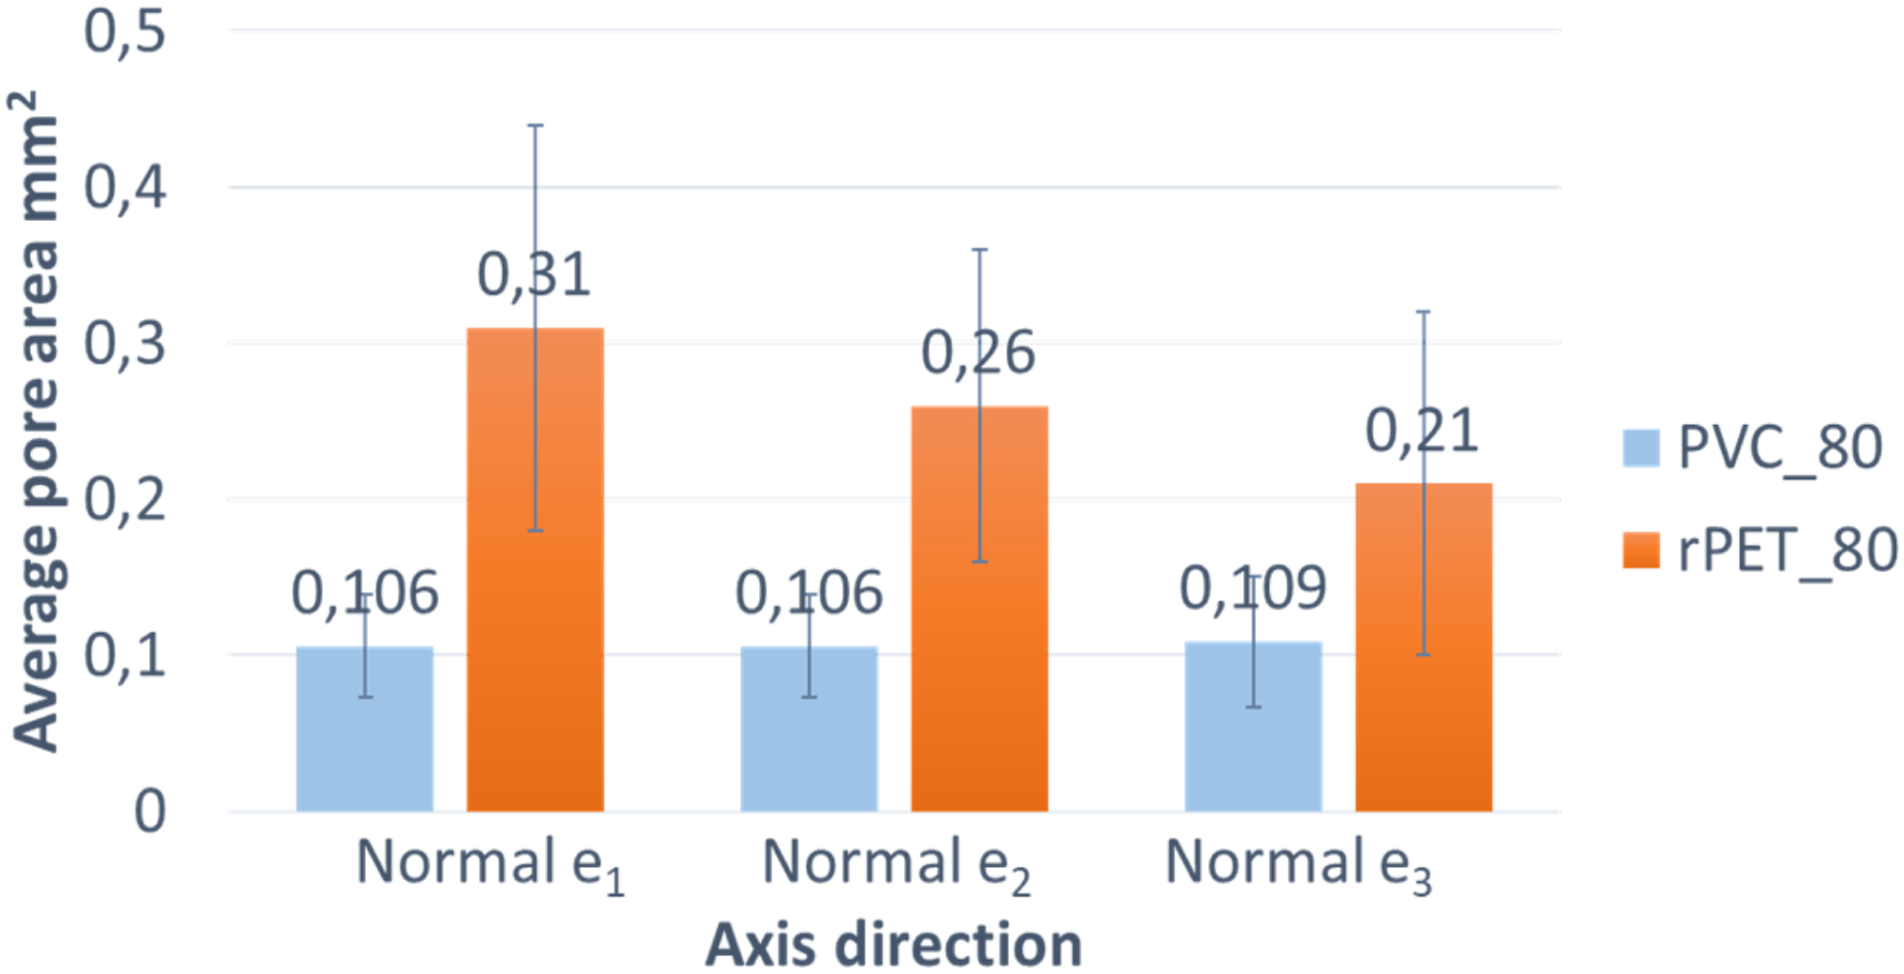
These tests confirm the transverse isotropy assumption discussed in the literature,
12
as they cannot determine the foam's intrinsic elastic properties. In addition, to complete the triaxial stress conditions, the transverse dimension of 15 mm was extended to 30 mm and then 60 mm. However, a uniaxial compression test can still be performed on the foam along the
Shear tests on foams
Shear tests were carried out on the two types of foams based on ISO 1922:2018 standards. To be able to perform these shear tests using the MTS Criterion C45.105 machine, the samples were prepared by bonding four steel sheets, each having dimensions of 100×40×5 mm3, with foam parts on both sides, as shown in Figure 4. A bio epoxy resin (SR InfuGreen 810 from the company Sicomin®) was used as a bonding agent. The test was conducted by applying a displacement on one side of the specimen and fixing the other. The crosshead speed was set to 10 mm/min. Images of the sample were taken during the test using the same setup as the one described in the Compression tests on foam section. The DIC technique was used to obtain the strain field and to calculate the corresponding shear modulus. Shear tests in two different planes, ( (i) Shear test in (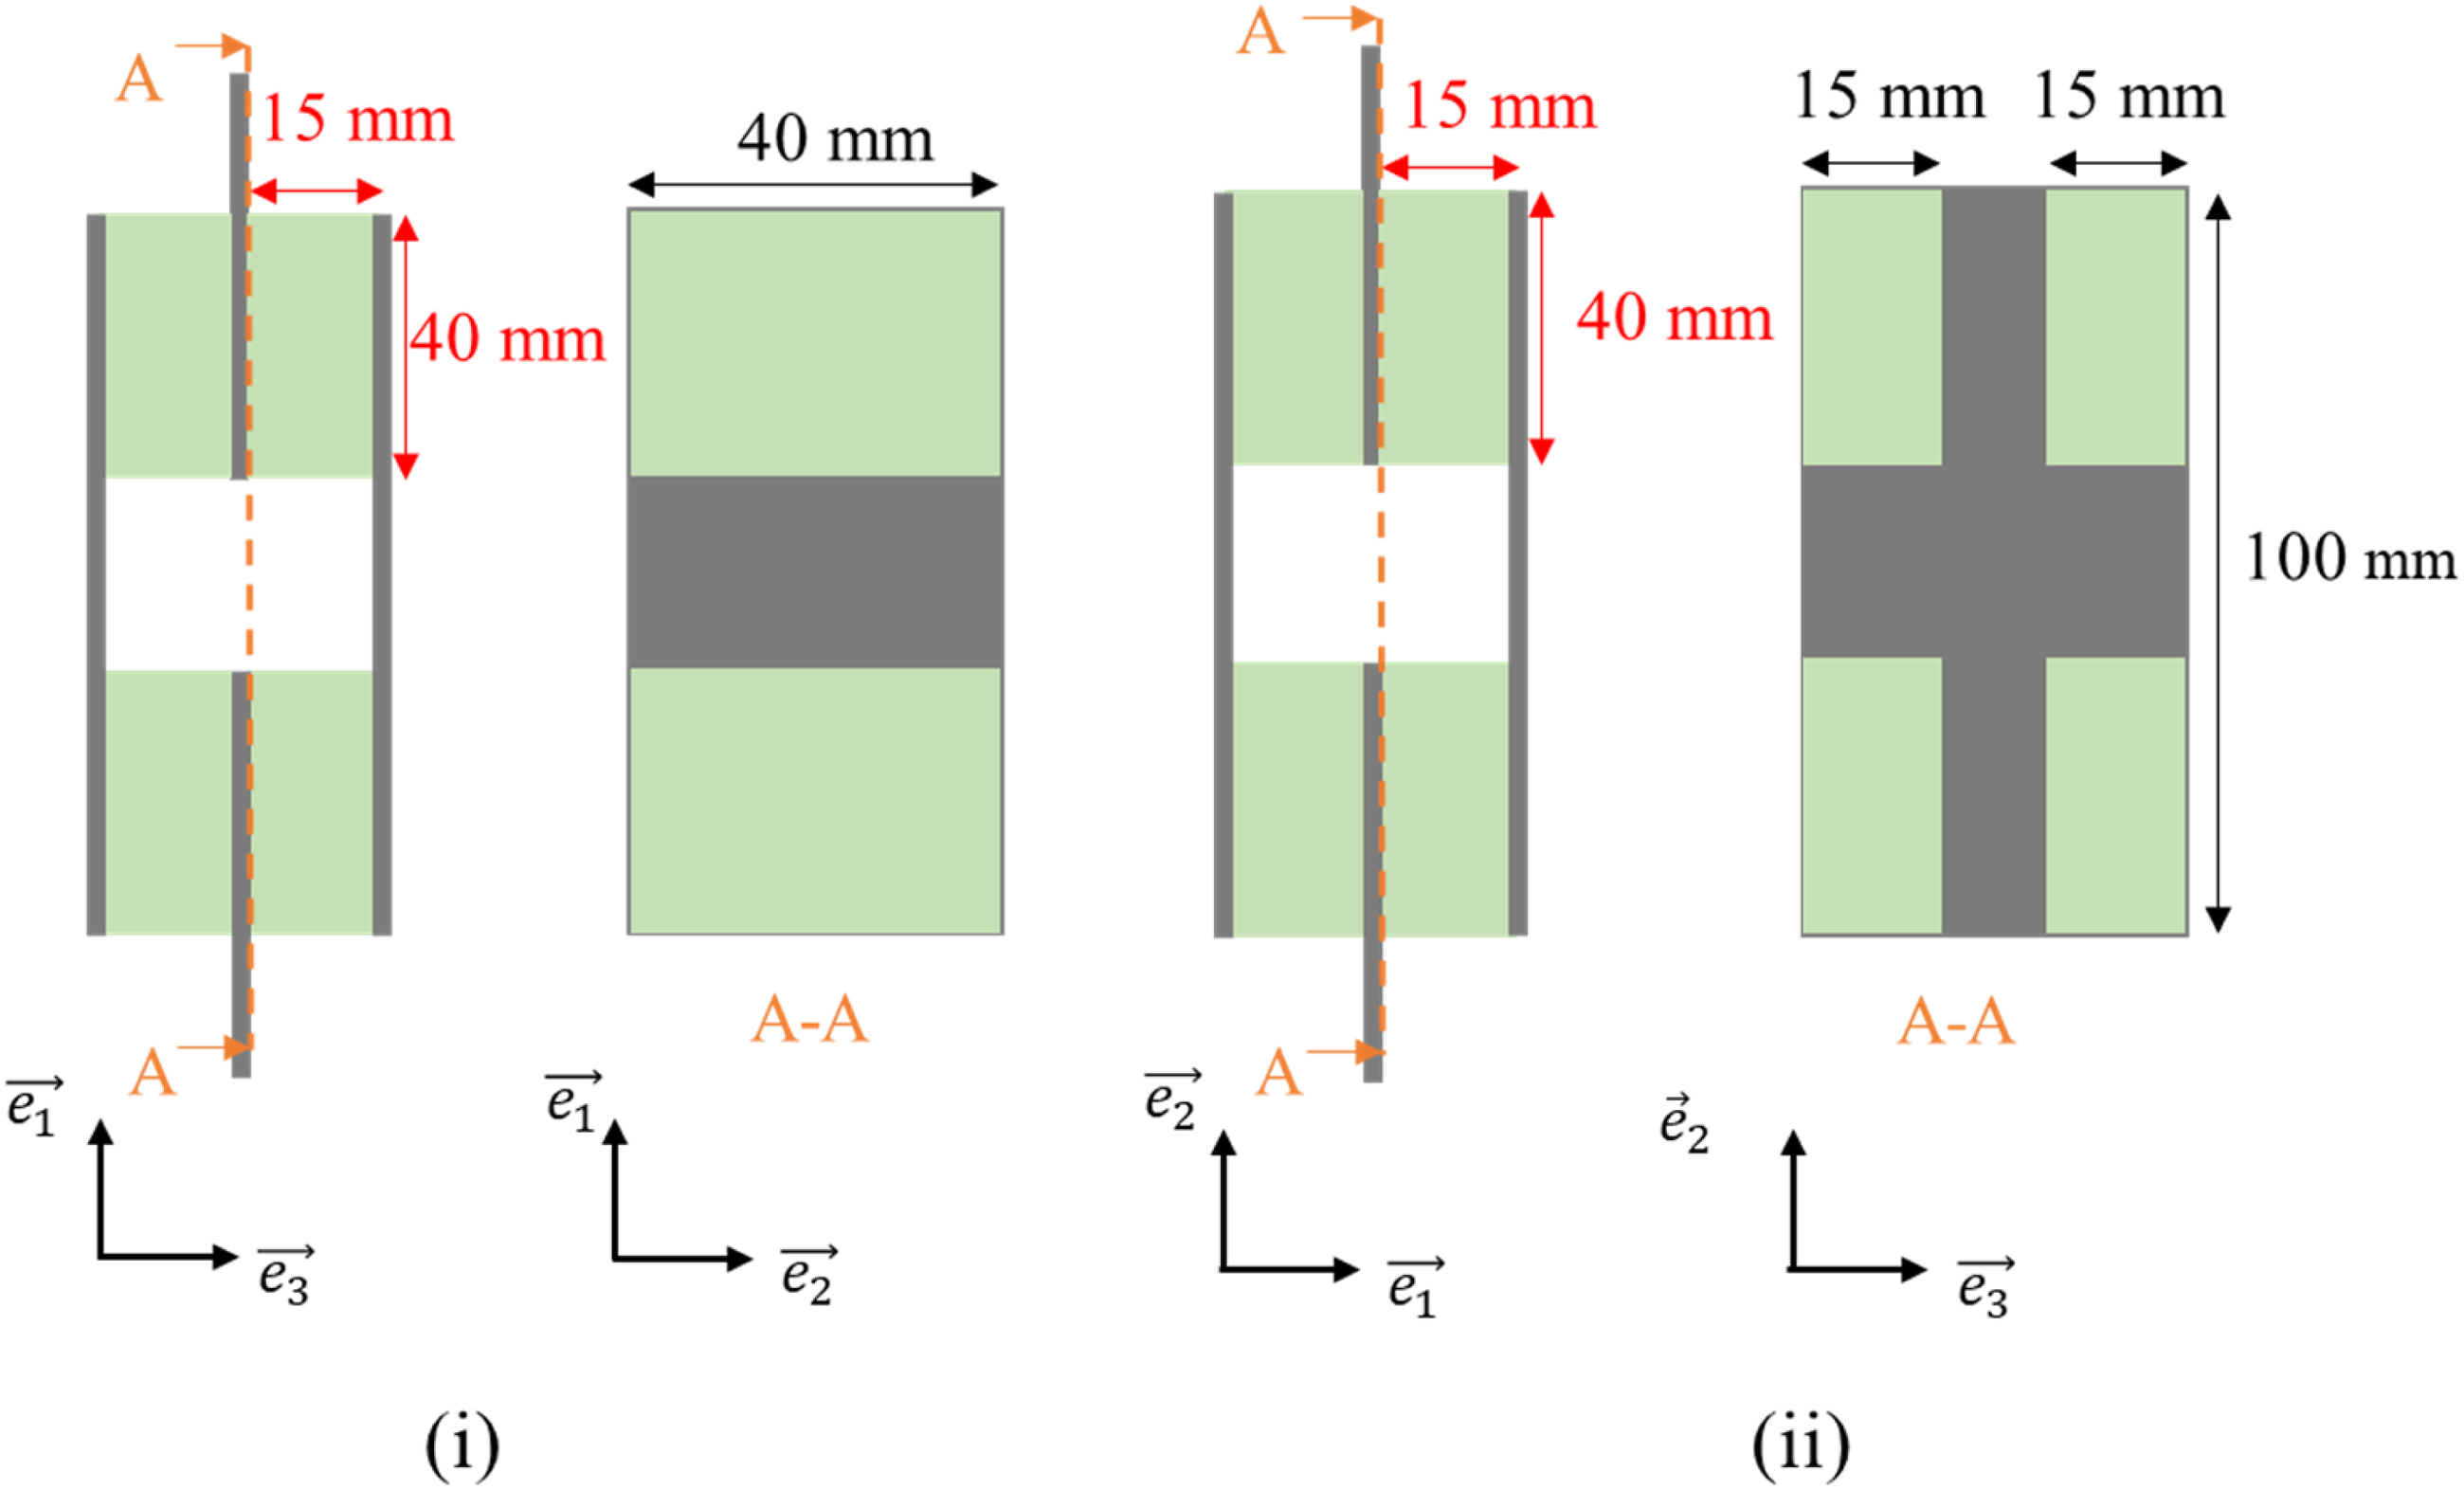
FEMU method
In the case of a sample with a width greater than its height undergoing a compression test, the stress state cannot be considered uniaxial compression. Instead, it is a multiaxial stress state, also known as a large compression test, which requires a numerical model to determine the intrinsic mechanical characteristics of the sample material. So, in this study, the FEMU method is used to identify the intrinsic elastic parameters of PVC and rPET foams based on the experimental data. This method updates the finite element model by adjusting its parameters until its resulting force response matches the experimental values. As such, the force response was used to achieve the minimization process, and the displacement values were used to define the boundary conditions. The model was created on Abaqus from a Python code with imposed different boundary conditions. A minimizing algorithm existing in Matlab called “fmincon” was used to recalibrate the model on Abaqus by comparing the calculated numerical values with the experimental measurements. Additionally, input parameters needed for this adjusting method are the specimen's dimensions, material properties (density and elastic parameters), and mesh size, while output parameters are only the adjusted elastic parameters. Further details on this method, including boundary conditions, are presented later in the Numerical elastic model section of the article. The element type used in Abaqus® is 3 degrees of freedom (DOF) hexahedral linear element.
Experimental results
Reproducibility of tests
Multiple tests were carried out to obtain reproducible results precisely by following standardized protocols and using calibrated equipment to conduct the different experimental tests to ensure the findings were valid and reliable. The findings' reproducibility was confirmed by replicating the experiments 10 times. The graphs displayed in Figure 5(i) and (ii) below show an example of the reproducibility of the force-displacement curves for 10 specimens (15×15×15 mm3) for each foam (PVC and rPET) under compression loading. This result also confirms the choice of a test geometry representative of the material's morphology (REV). Force-displacement curves for 10 specimens (15×15×15 mm3) - (i) PVC, (ii) rPET.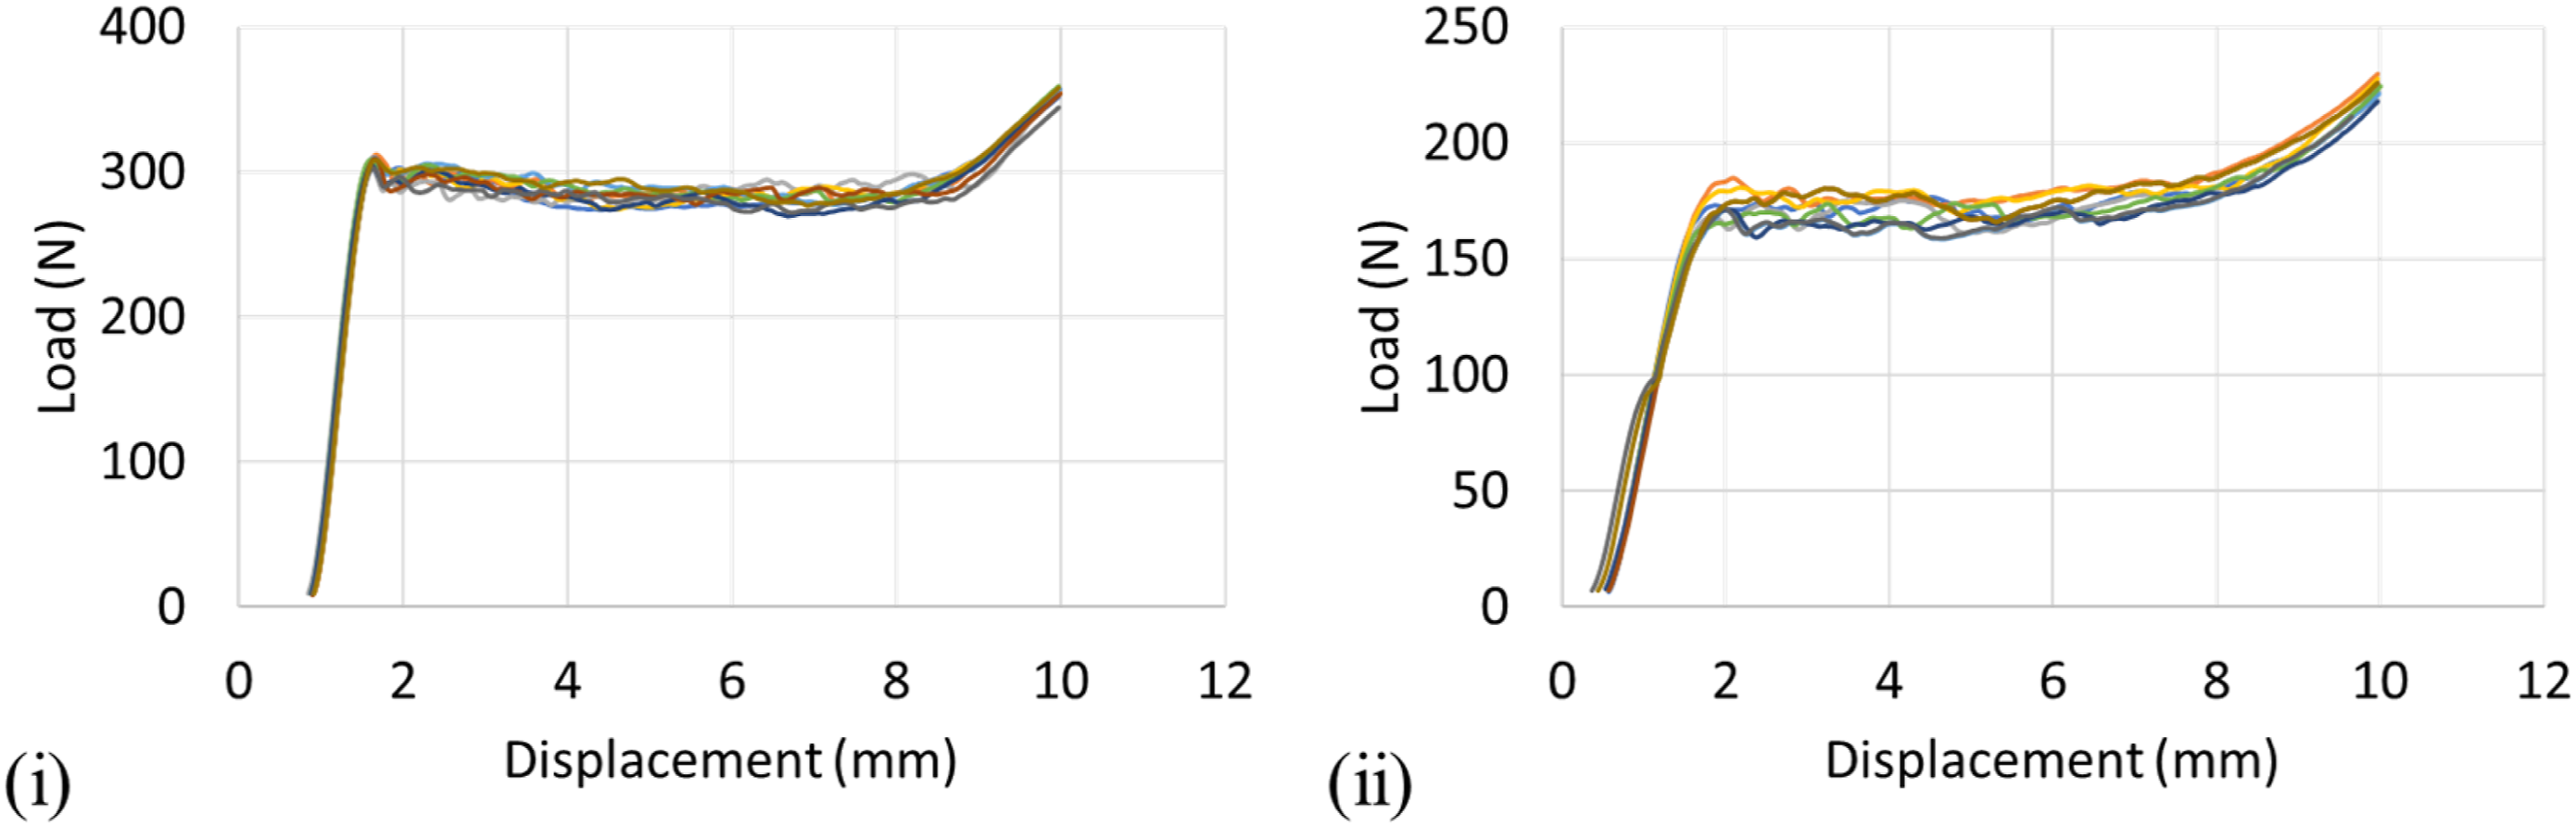
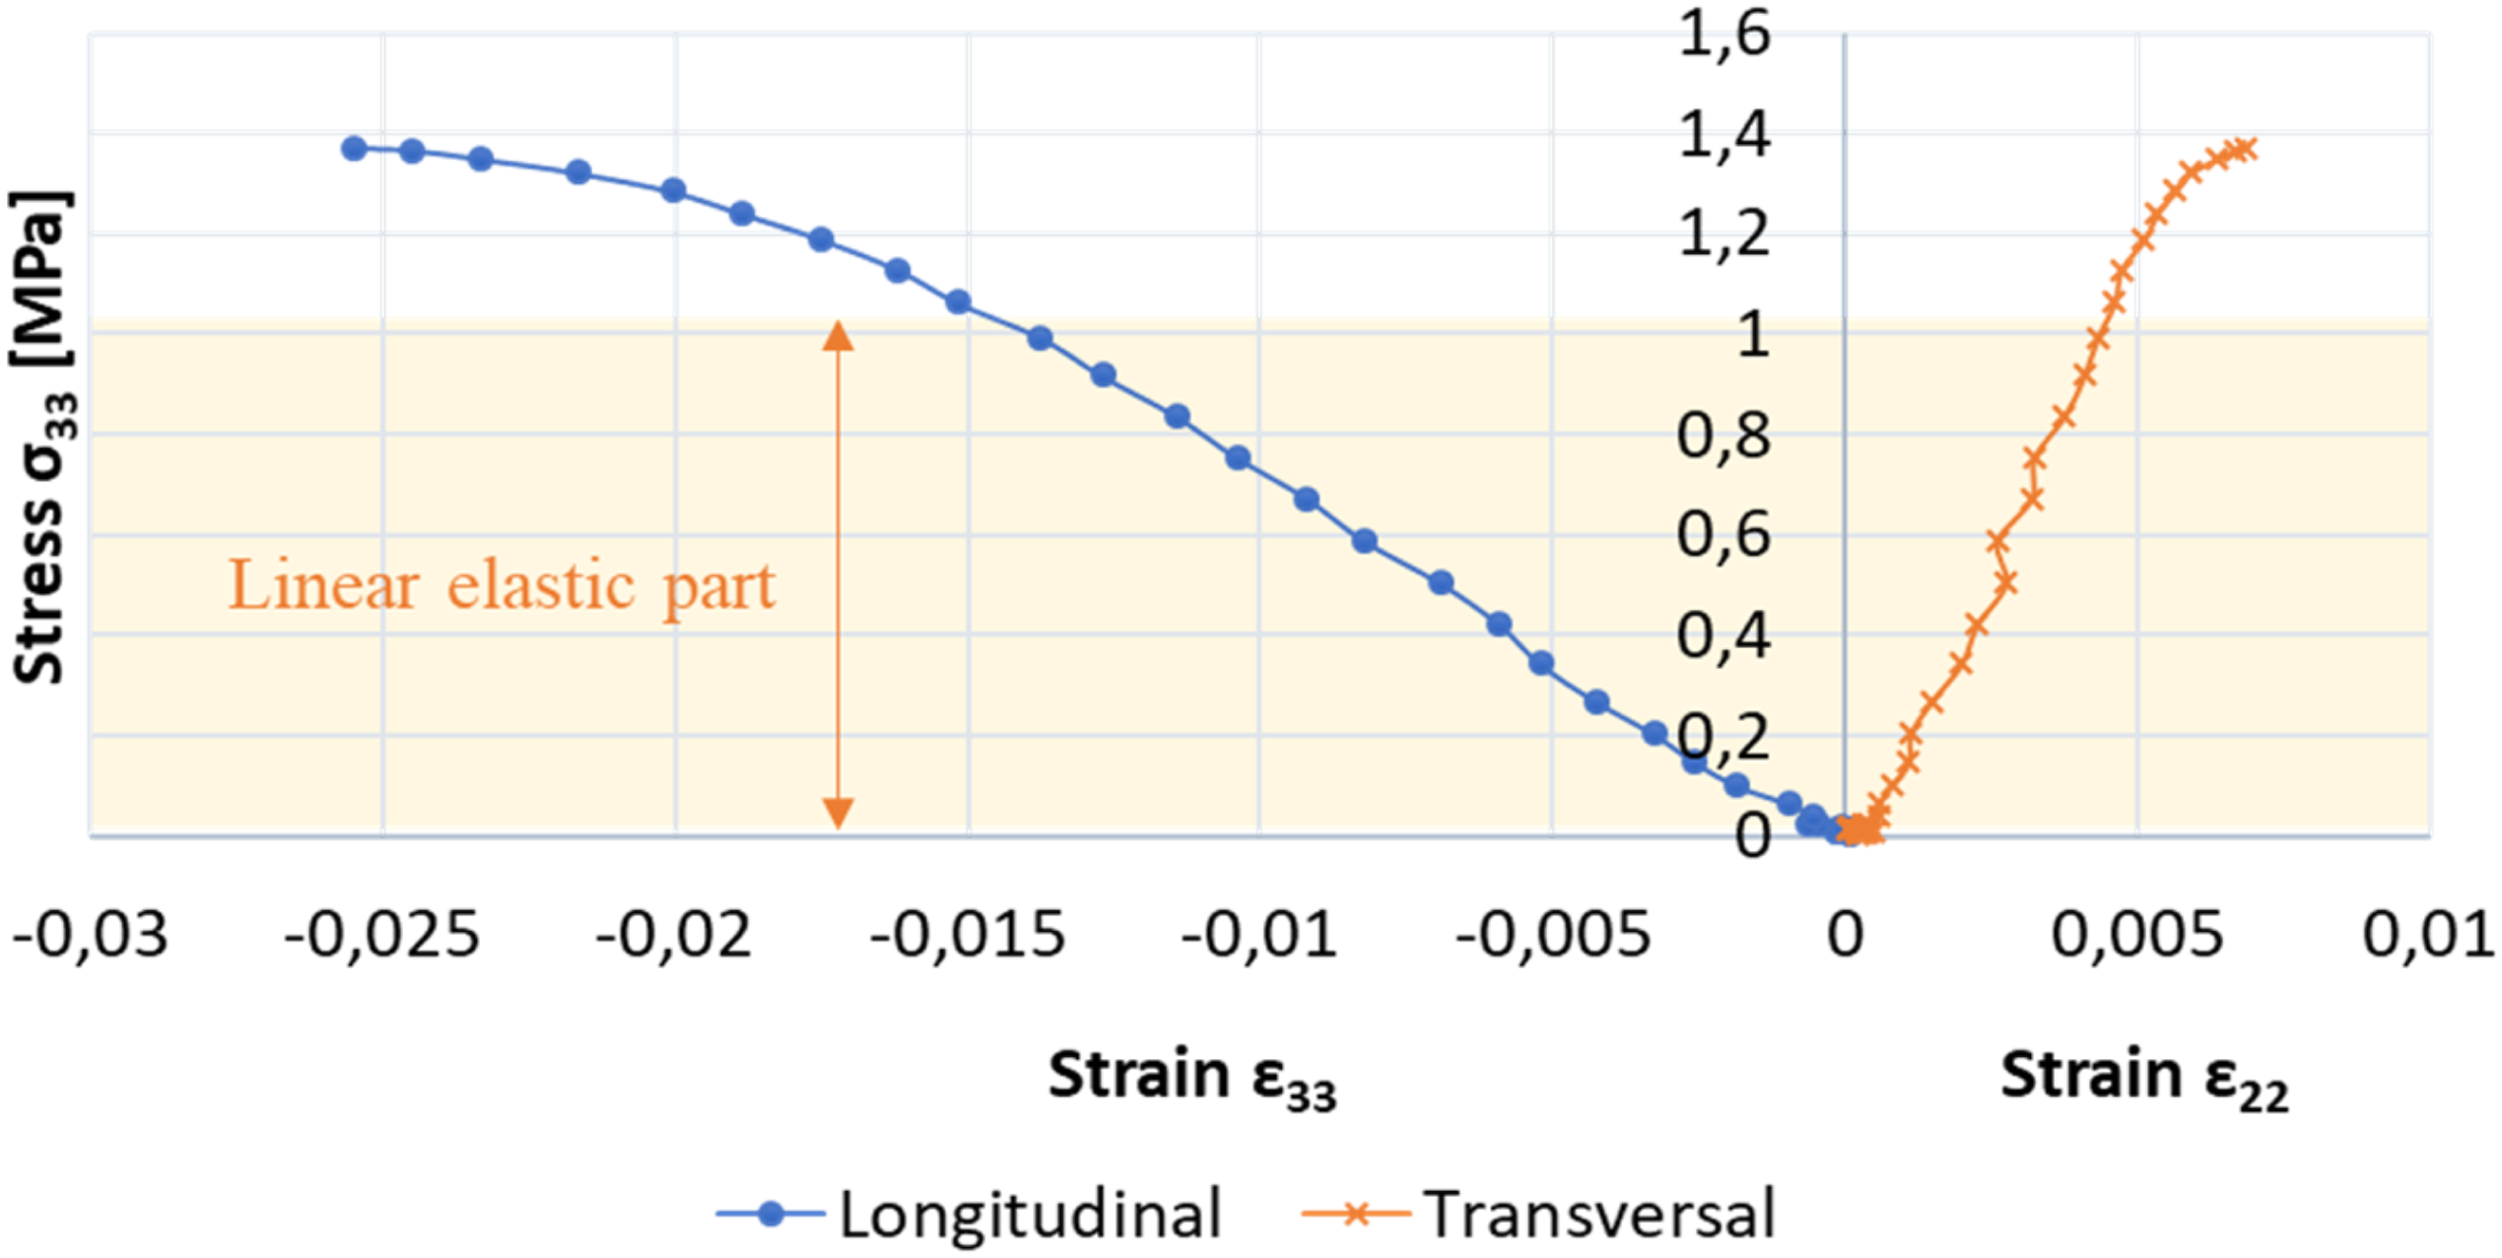
Although this paper primarily focuses on the elastic behavior of the foam, the yield stress is also an intrinsic quantity widely used in the design basis of components and structures. The experimental measurements of the apparent yield stress obtained are about 1.37 MPa and 0.78 MPa for PVC and rPET foams, respectively, meaning that substituting PVC with rPET would lead to an oversizing of the structure. Although the study of the collapsed part of the foam is not yet made, this observation could shed light on the differences in mechanical behavior between the two foams. Therefore, further research is needed to fully understand the mechanical behavior properties of both foams.
Triaxial compression tests
Considering that the foams studied in this paper have a thickness of 15 mm, compression tests were conducted on different sets of specimen dimensions. Three sets were tested in the thickness direction ( Strain profiles obtained by the “local approach” - (i) set a, (ii), set b, (iii) set (c). Experimental results - Stiffness apparent modulus Stress-strain curves (calculation by the “global approach”) of compression test in 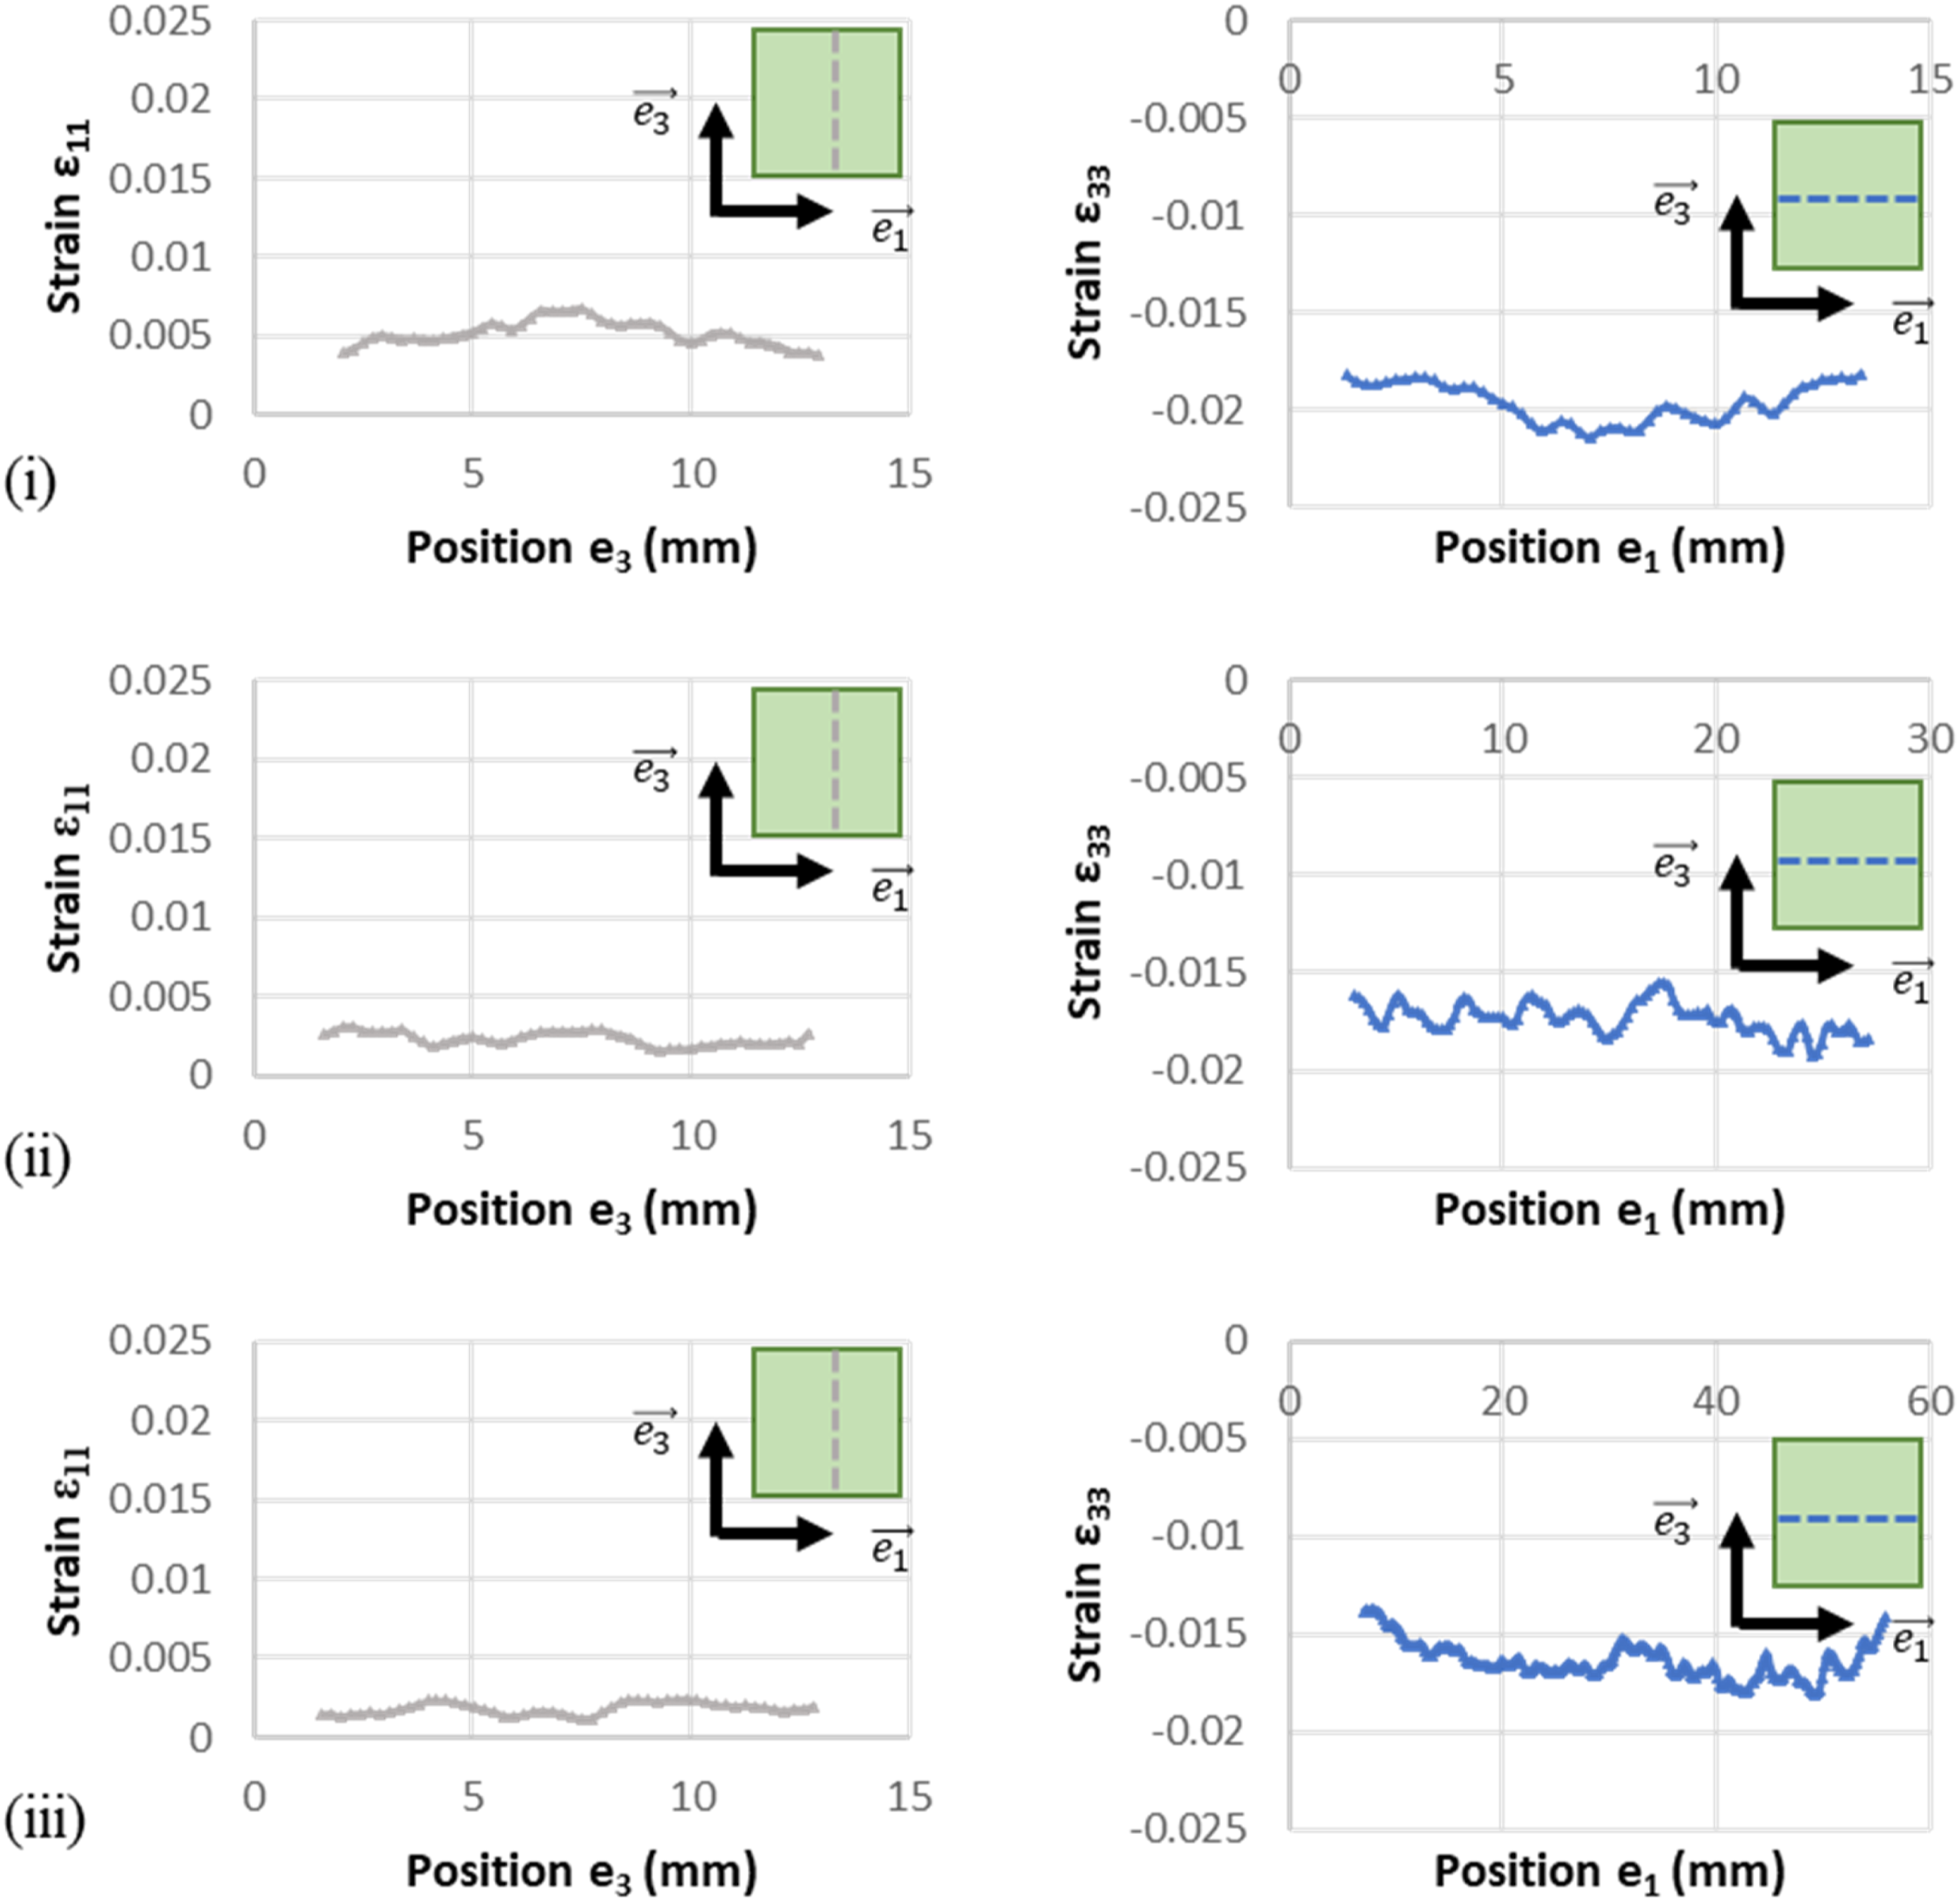
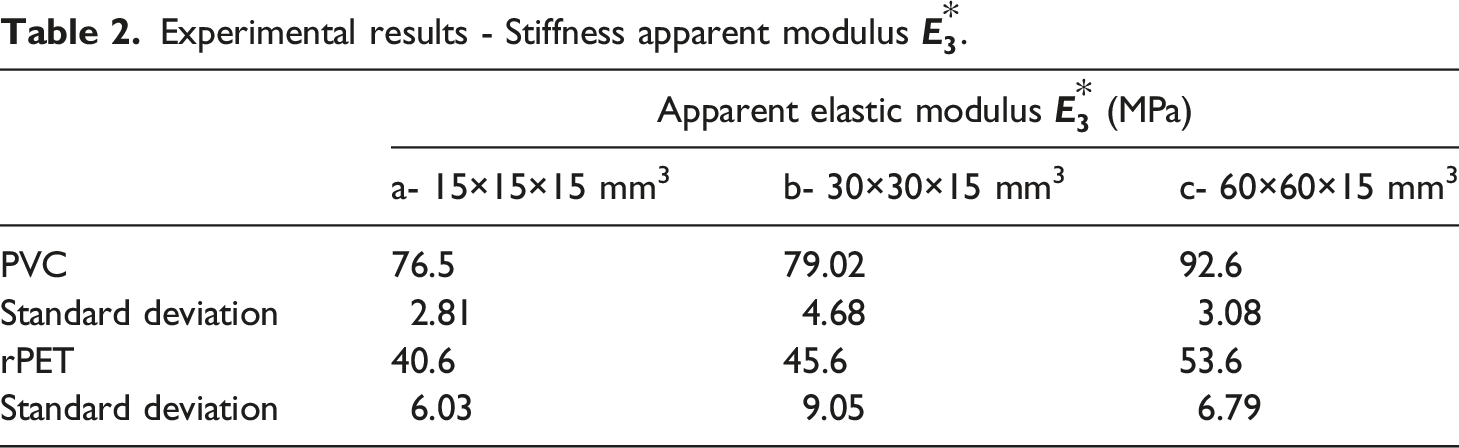
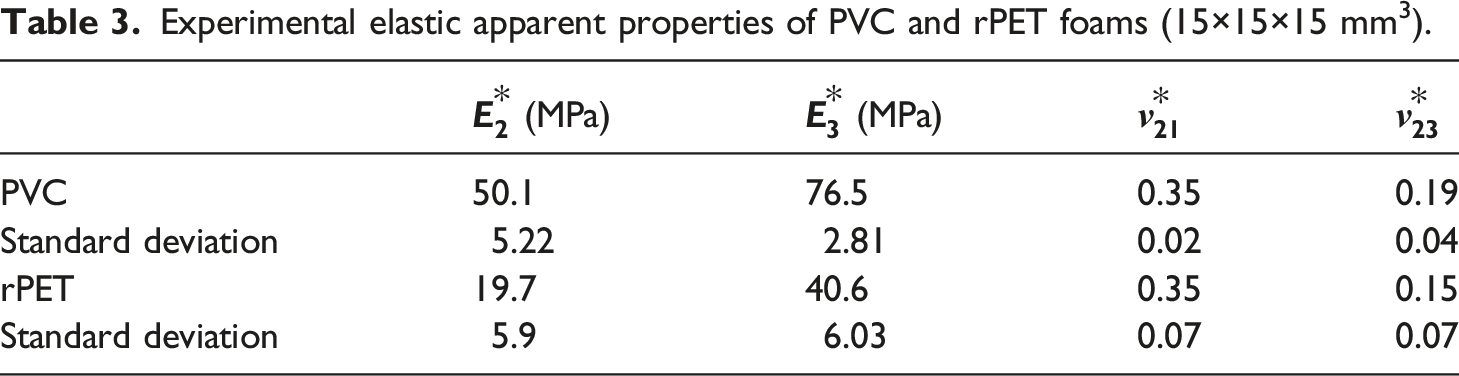
These apparent parameters will be used to initialize the identification procedure of the parameters by the FEMU method. Accordingly, compression tests were conducted along the
Experimental elastic apparent properties of PVC and rPET foams (15×15×15 mm3).
Following the compression tests conducted by subjecting the sample to longitudinal and transversal loading, the stress-strain curves obtained from the two adjacent faces (F1 and F2, as in Figure 3) of the specimen were plotted and compared, as shown in Figure 8. It was found that the transversal strain curves Stress-strain curves for triaxial compression test along 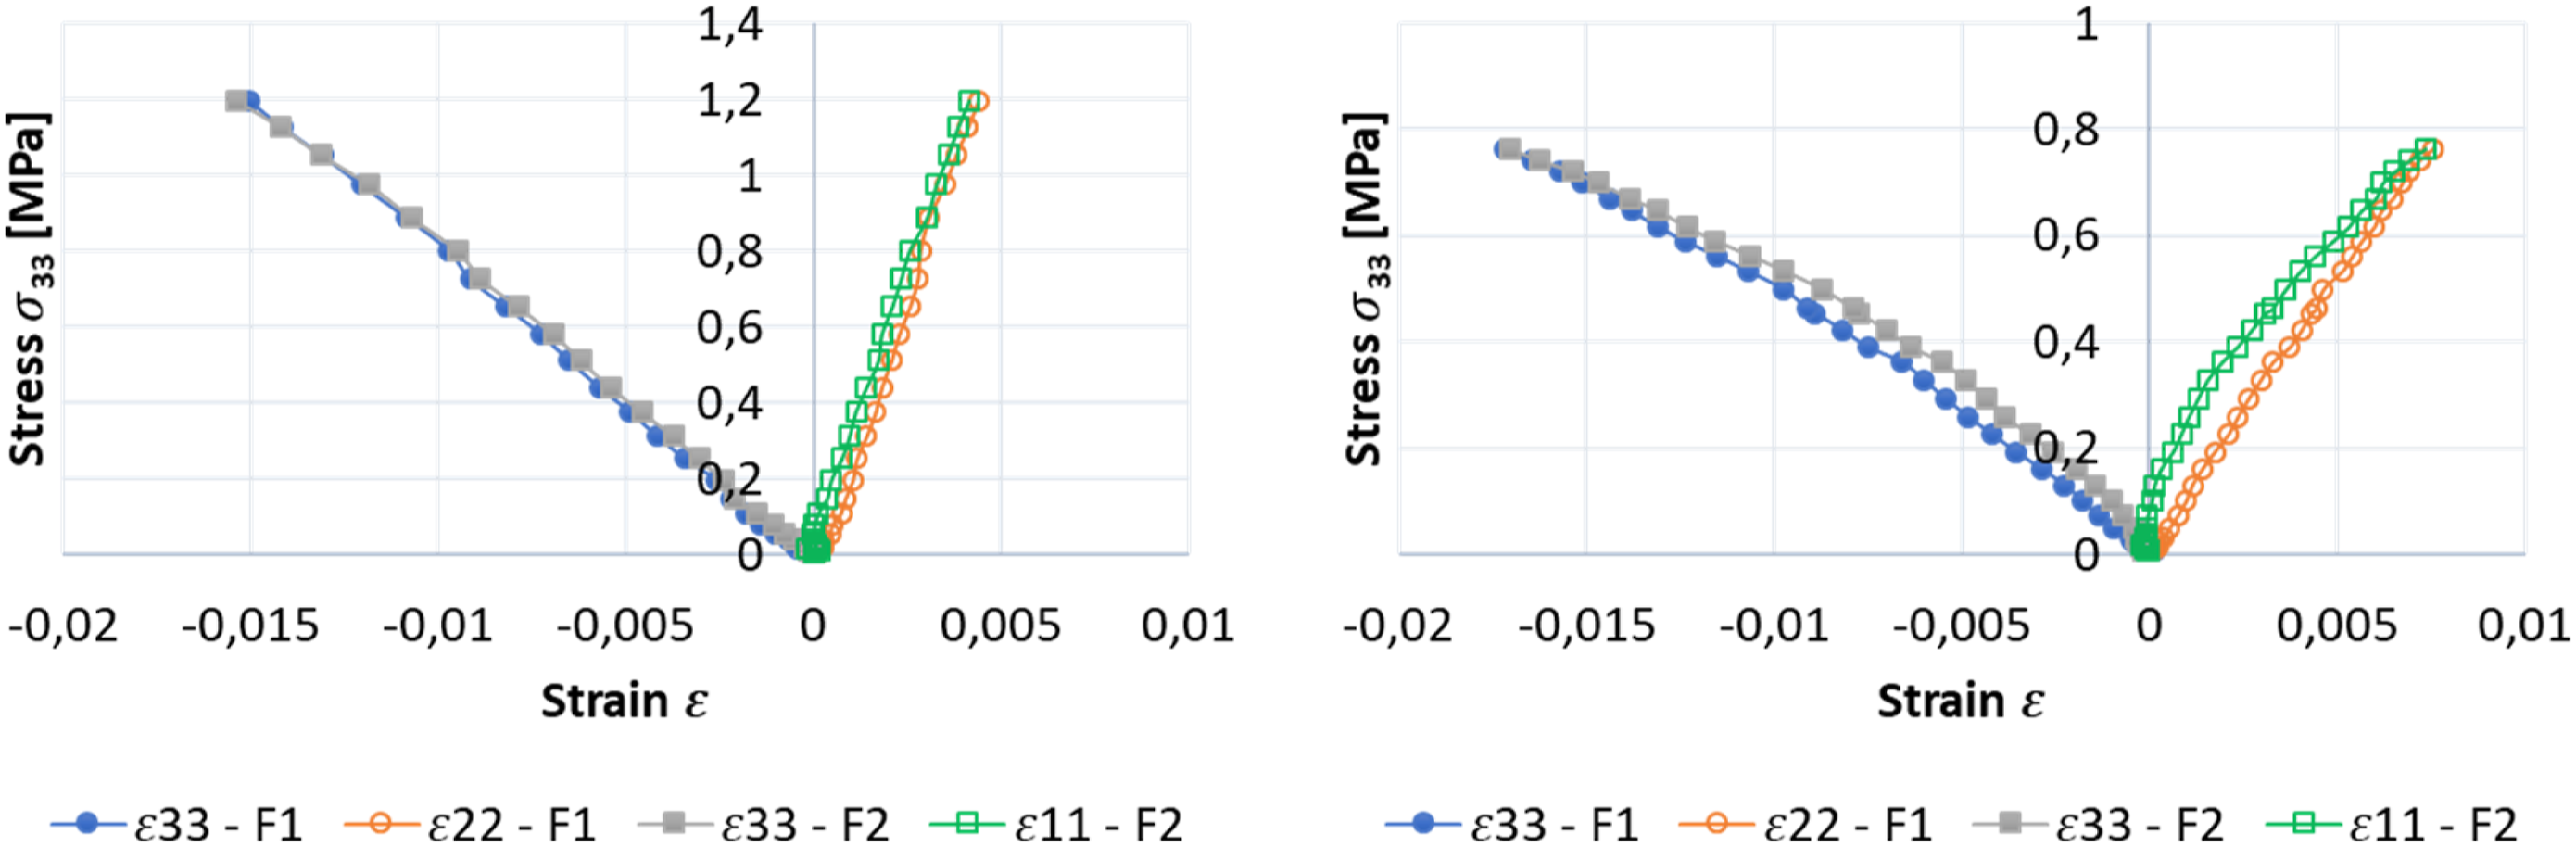
After this observation, a morphological study of the two types of foams was conducted. Several morphological parameters were measured using both SEM and X-ray tomography techniques, such as the average pore area, the average circularity of pores, the pore count per area, and the ligament thickness. For instance, X-ray tomography was carried out on specimens of 6×6×6 mm3 with a resolution of 3.89 X-ray tomography and SEM results - (i) Pore count/36 mm2 (ii) Average circularity of pores (iii) Ligament thickness for PVC and rPET foams.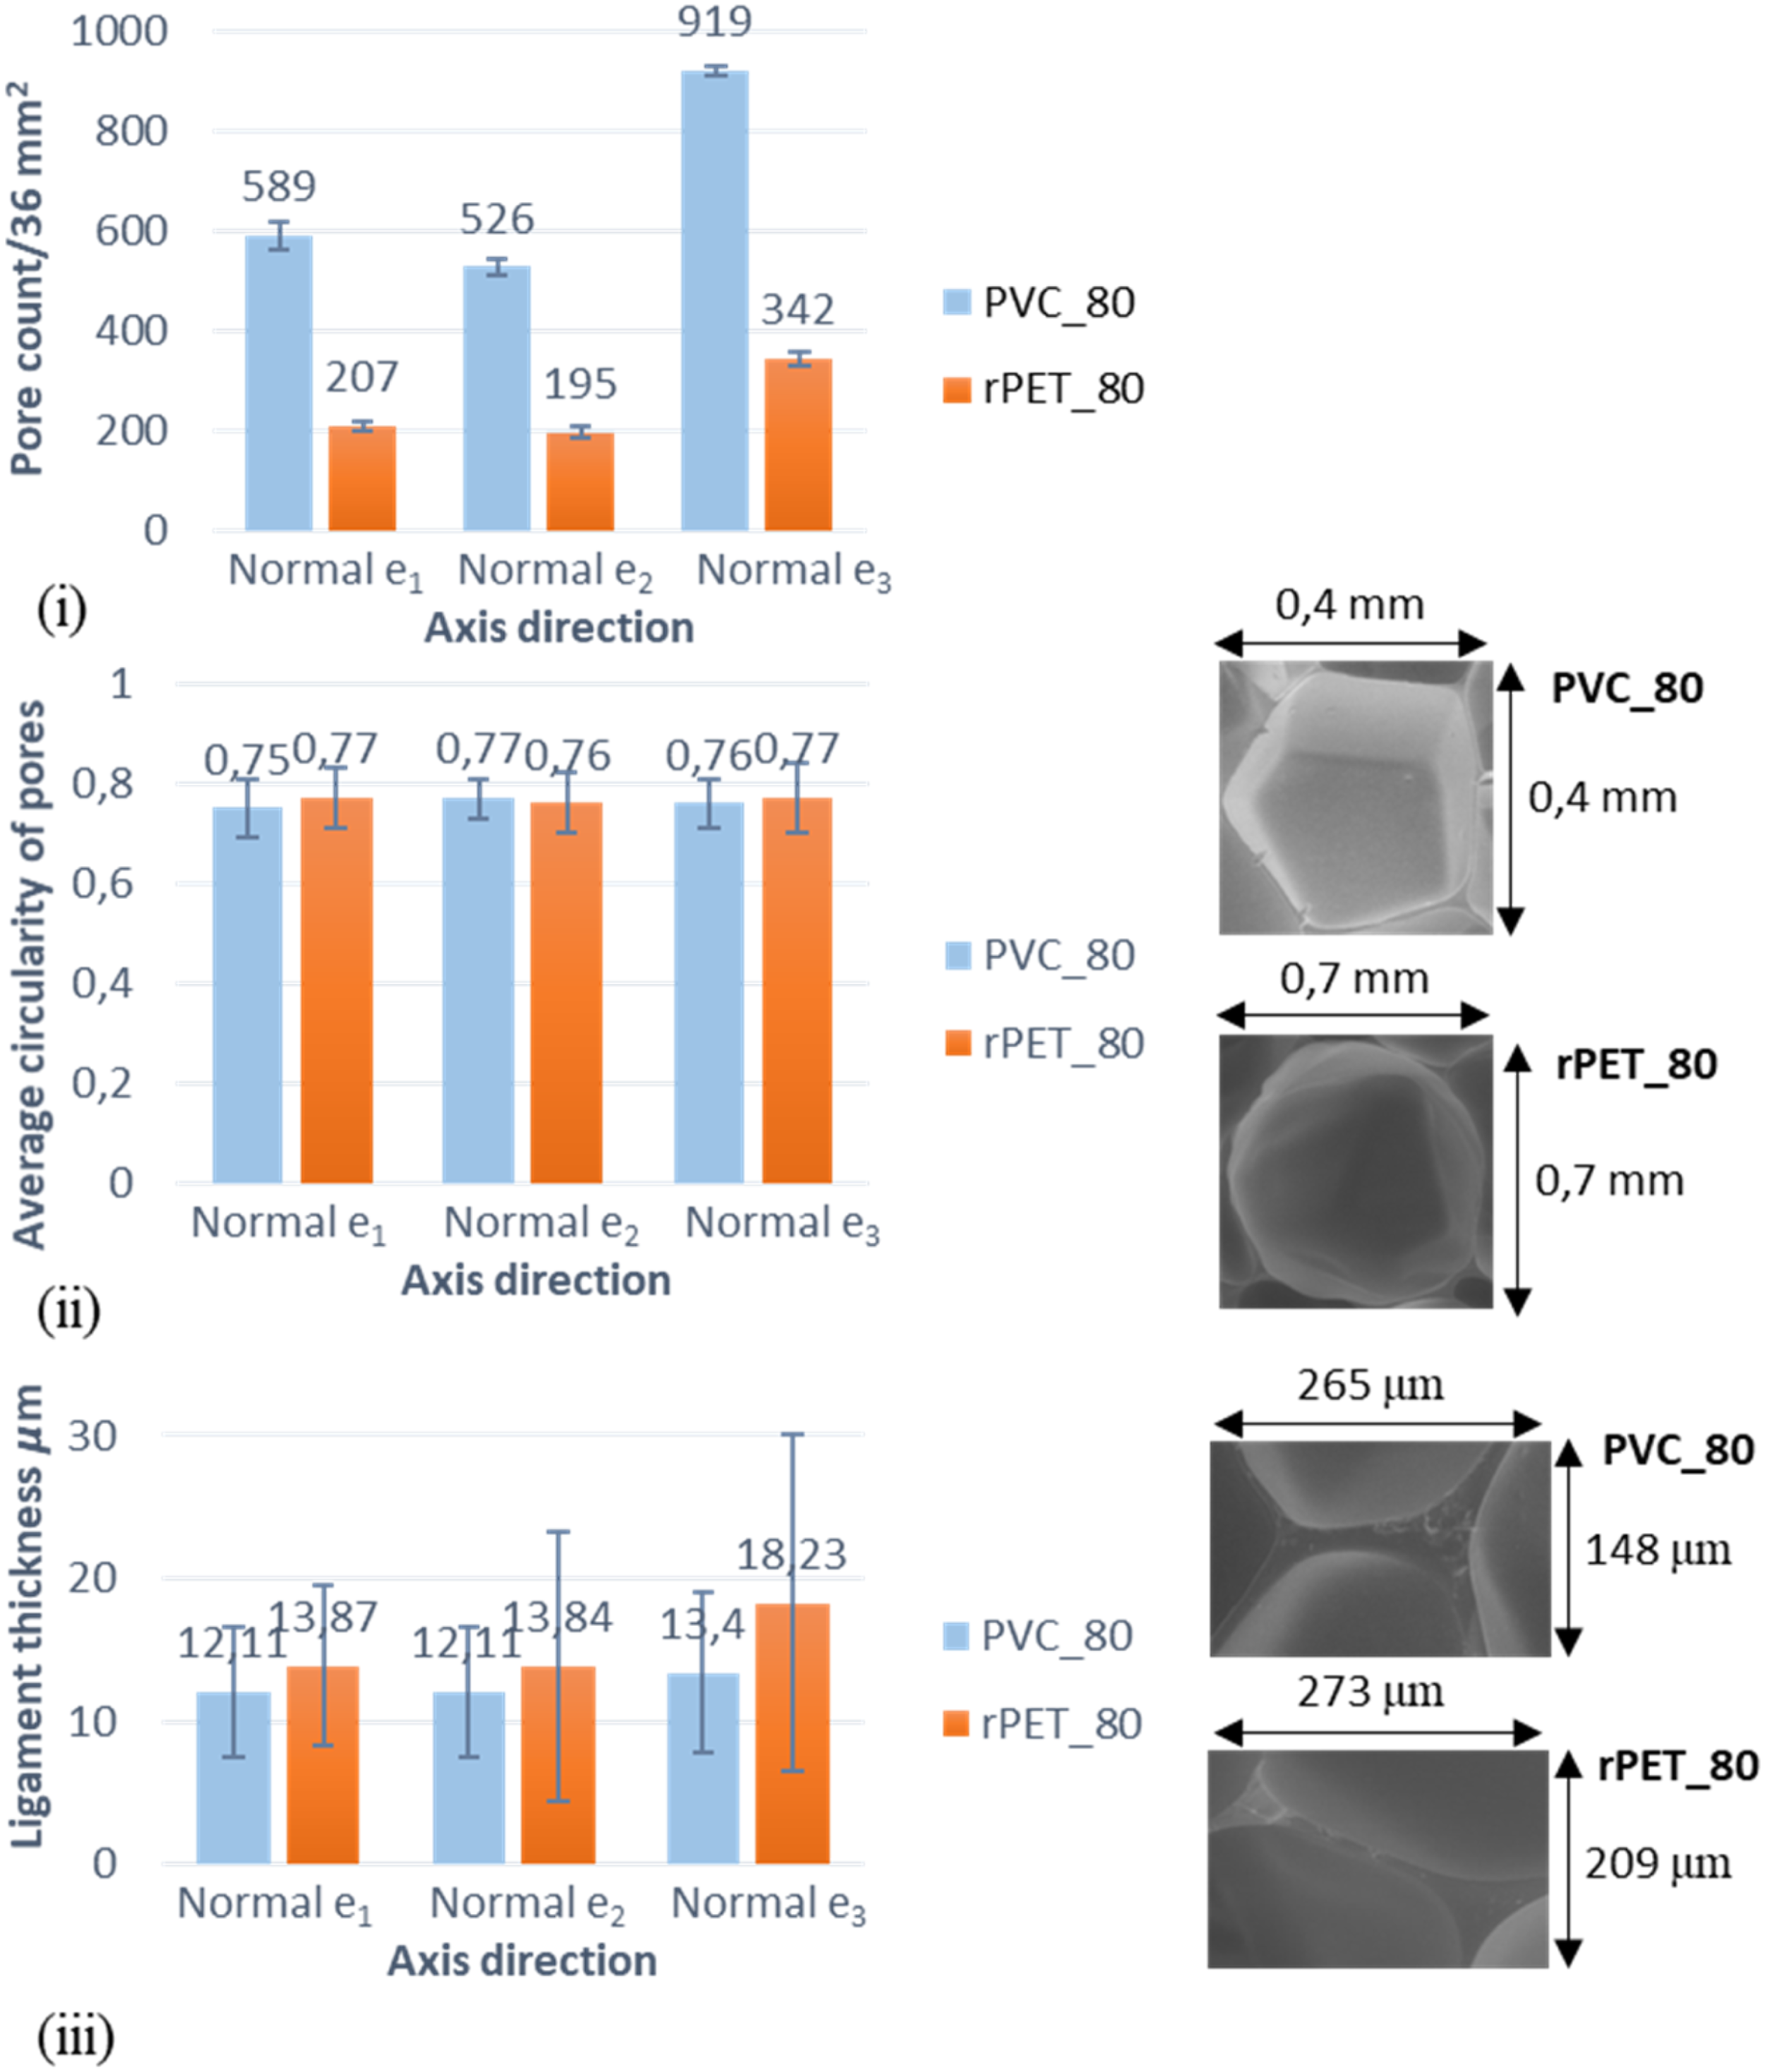
Uniaxial compression tests
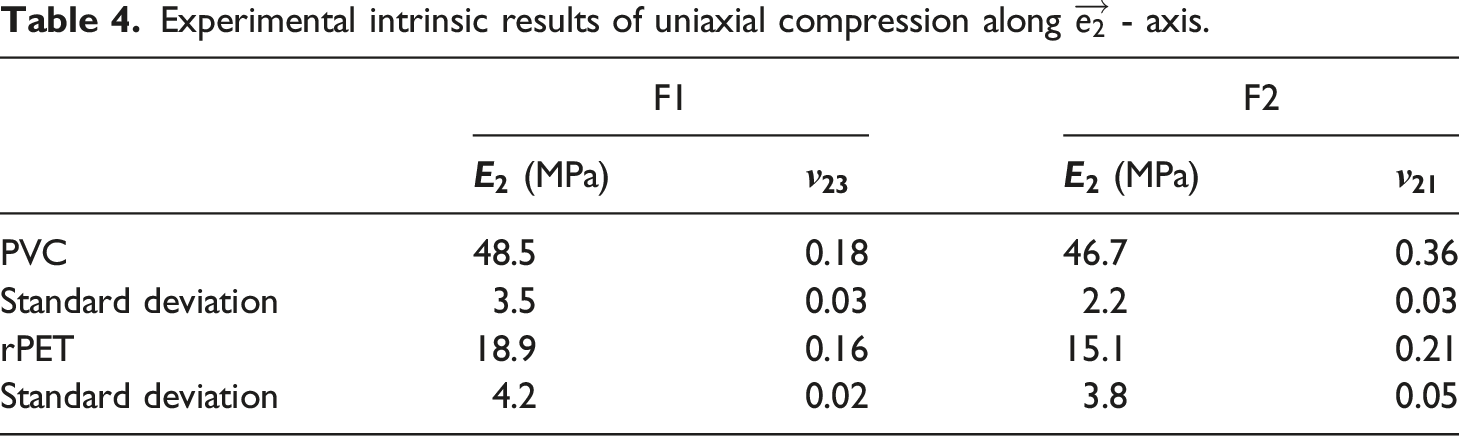
Experimental intrinsic results of uniaxial compression along
Shear tests
Shear tests in the (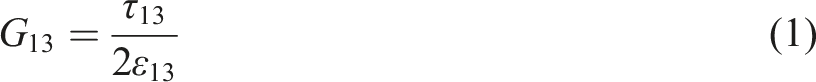
The shear tests carried out in this plane identified Shear specimen and strain profile (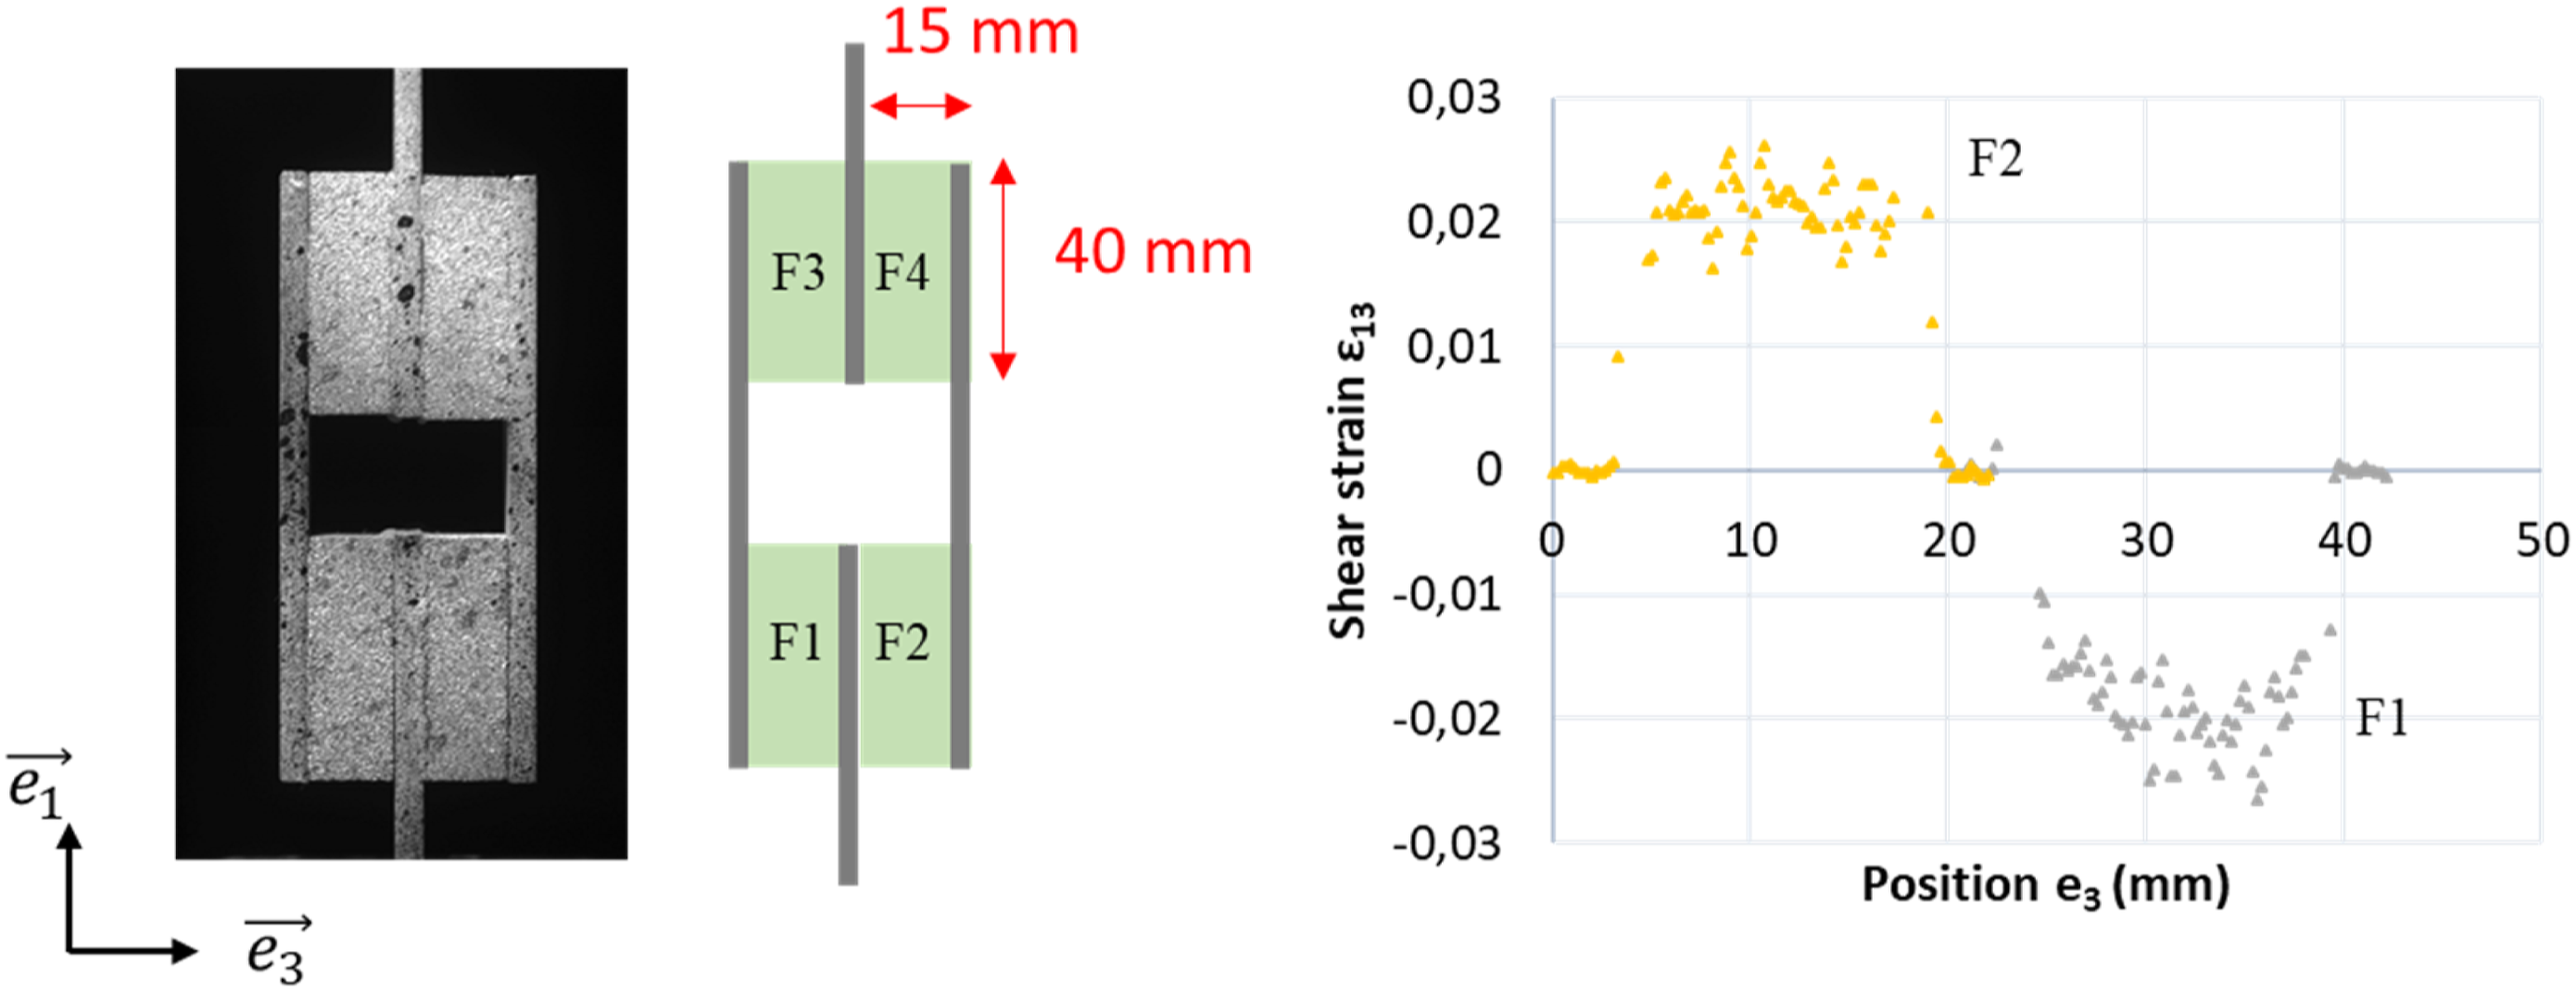
Since this shear test allowed determining an intrinsic property, other shear tests were also conducted but in the (
Experimental intrinsic results of shear tests in (

For the two foams, the Poisson’s ratios
Numerical elastic model
As mentioned earlier, based on the literature, PVC foams are transversely isotropic. Accordingly, using this hypothesis, the compliance matrix 
The equation (4) below is obtained using Voigt notation: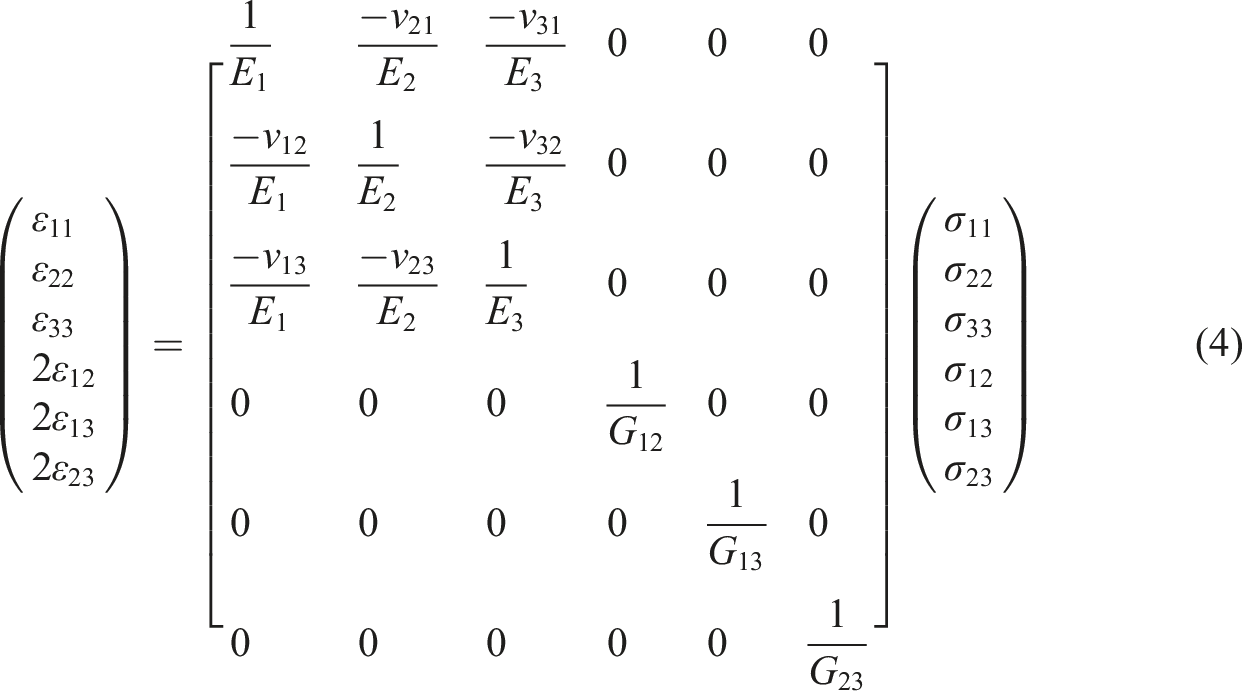
The notations 1, 2, and 3 correspond respectively to the
Model dimensions and boundary conditions
A numerical method has been implemented to identify the intrinsic elastic parameters, experimentally established but considered apparent rather than intrinsic. A finite element model, as shown in Figure 11, was created on Abaqus, where two symmetries about ( FE model and boundary conditions.


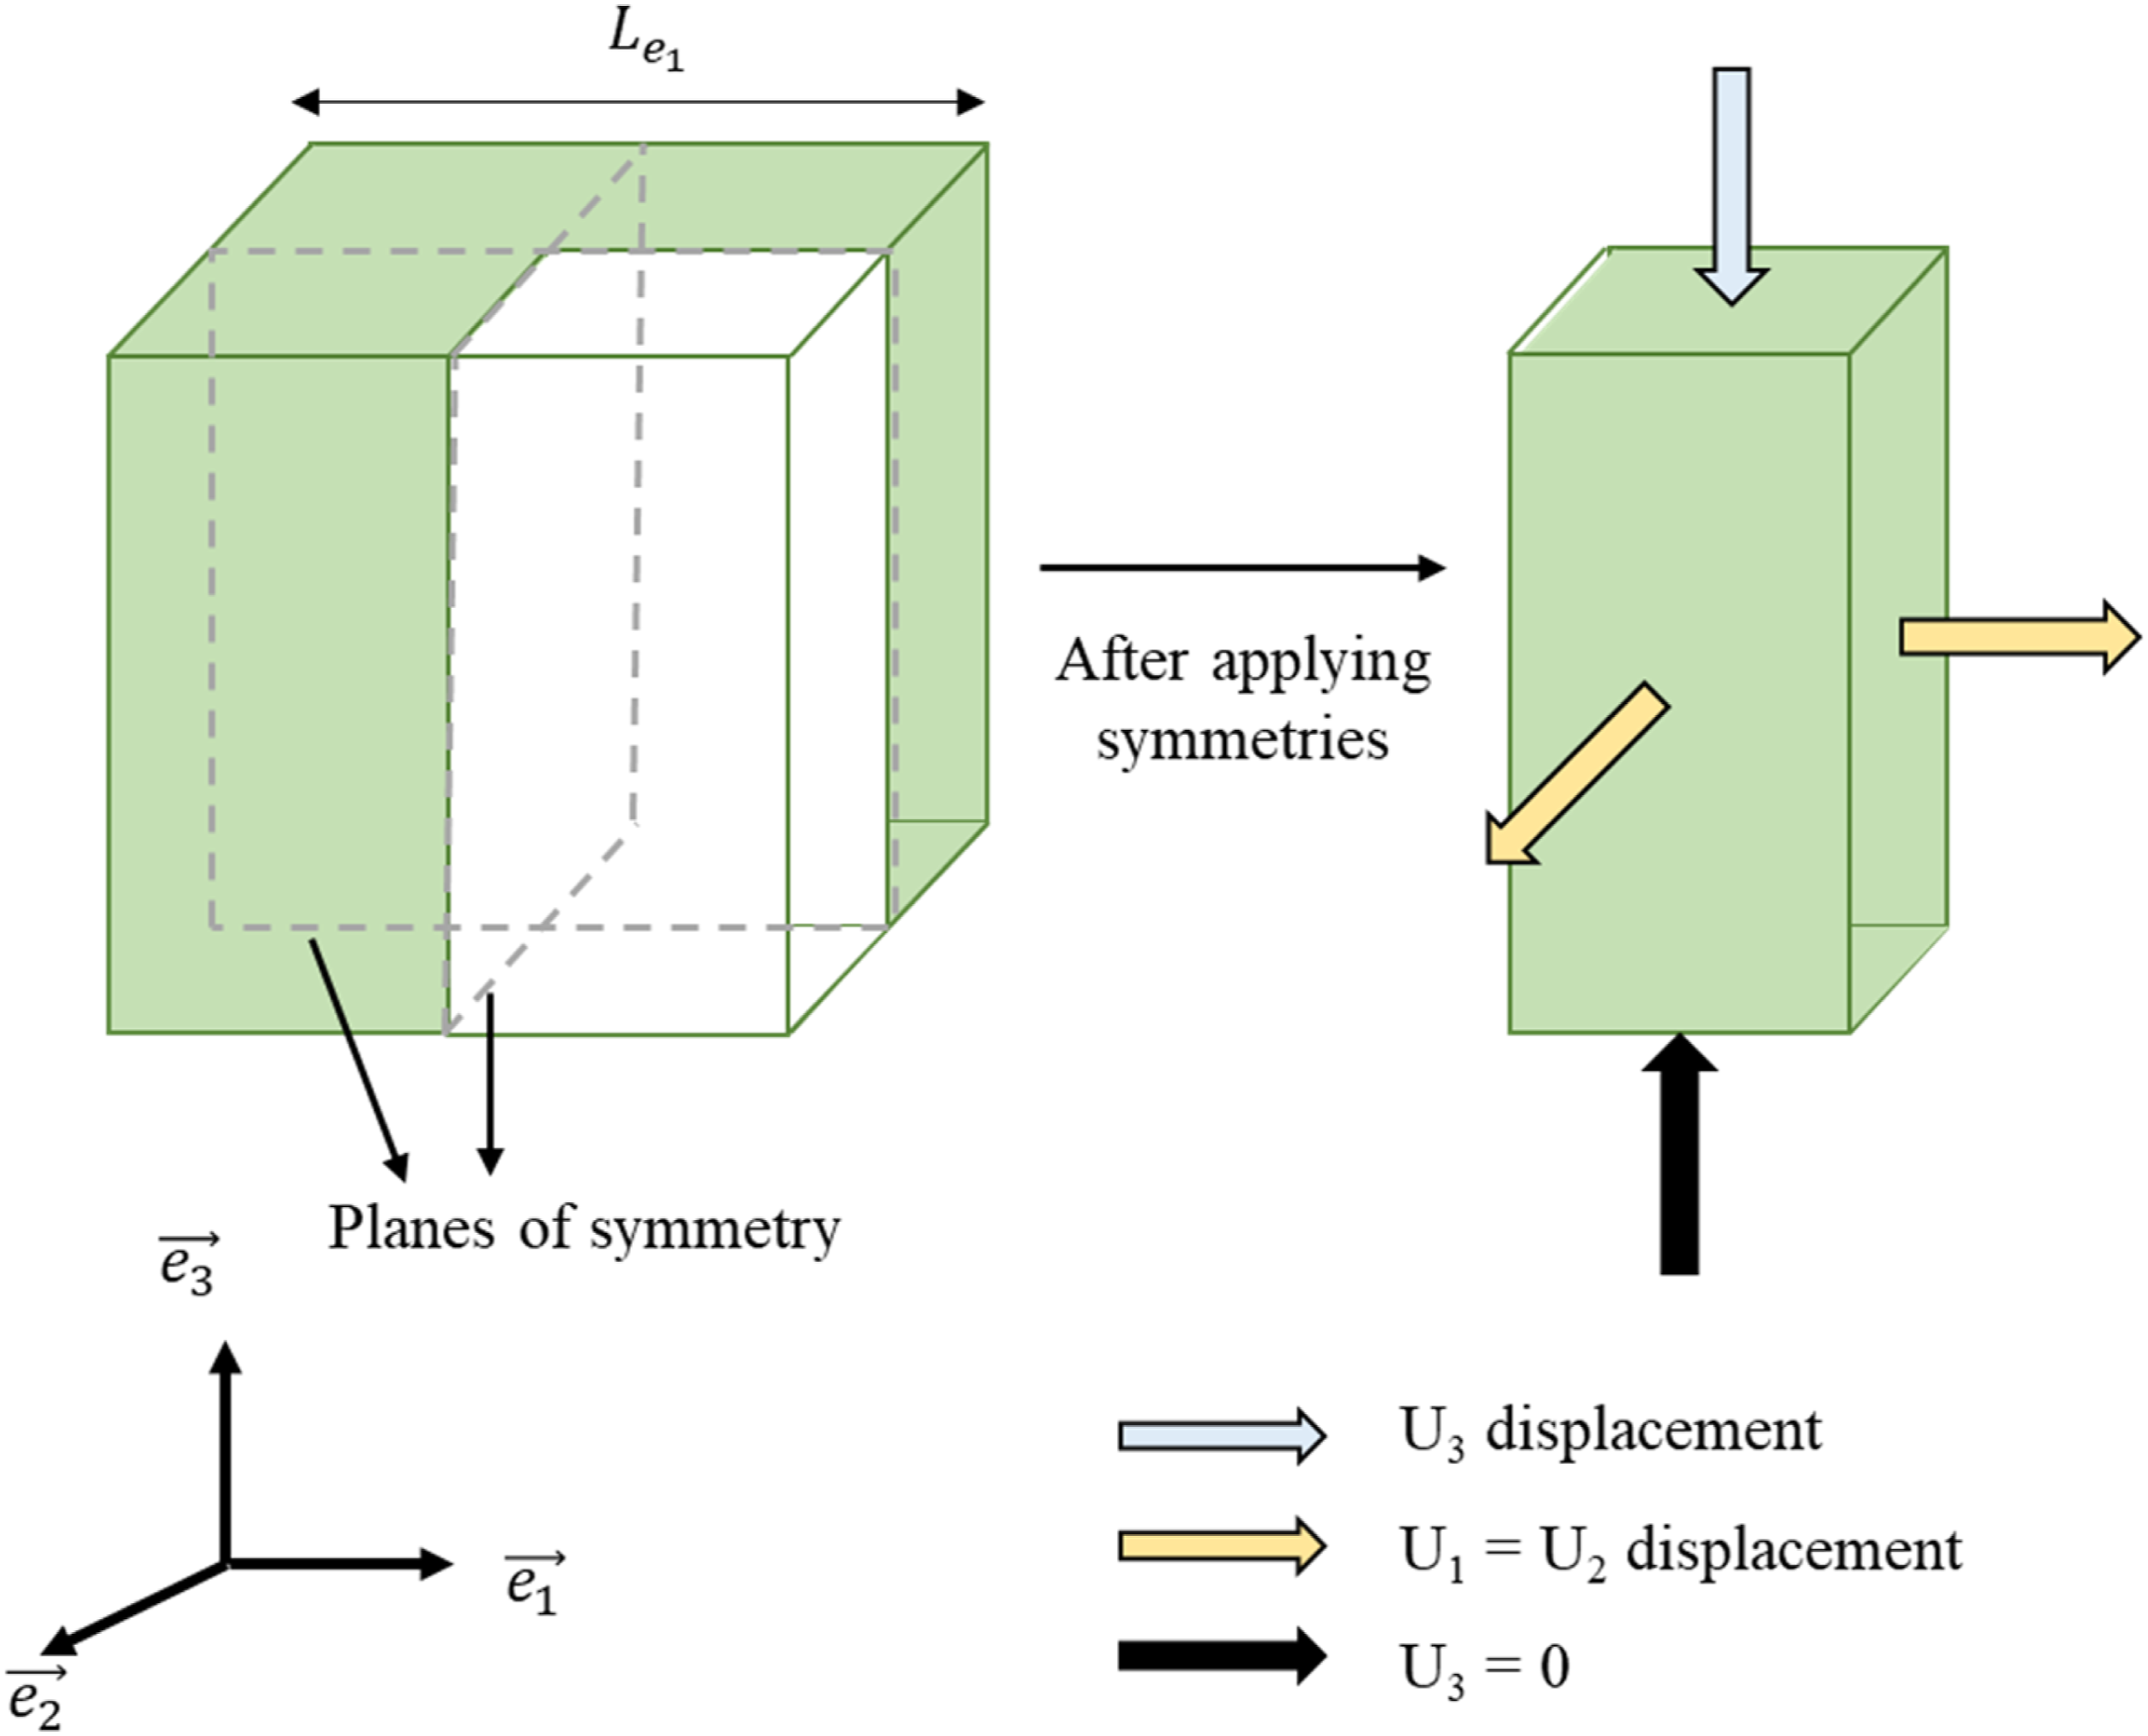
Furthermore, this model has been linked to Matlab through Python to manage its input parameters easily. It will be explained in detail in the following section.
Optimization loop
To organize the recalibration method, an interface on Matlab was created. It was linked to the Python code by defining the input parameters in this interface (specimen’s dimensions, mesh size, material properties, etc.). Moreover, a loop was also created in which the error between the experimental results and the numerical ones is calculated. This error is minimized after implementing it with the suitable other parameters in the minimizing function in Matlab. Once the minimal residual value is reached, the loop stops, and the intrinsic elastic parameters are obtained. These optimized parameters correspond to the minimal error possible. Although certain parameters have been identified intrinsically through experiments, they are also identified using this FEMU method. This identification enables the comparison between the values obtained both numerically and experimentally. This method is a generalized approach for performing a finite element model updating method (FEMU) based on minimizing the error between the experimentally obtained results and numerical results for each set of input parameters. In this article, the materials under consideration are PVC and rPET foams. Since both foams present a homogeneous strain field, as shown in Figure 6 (i)–(iii), the FEMU method was used with a fixed single-element mesh parameter.
Numerical calculations
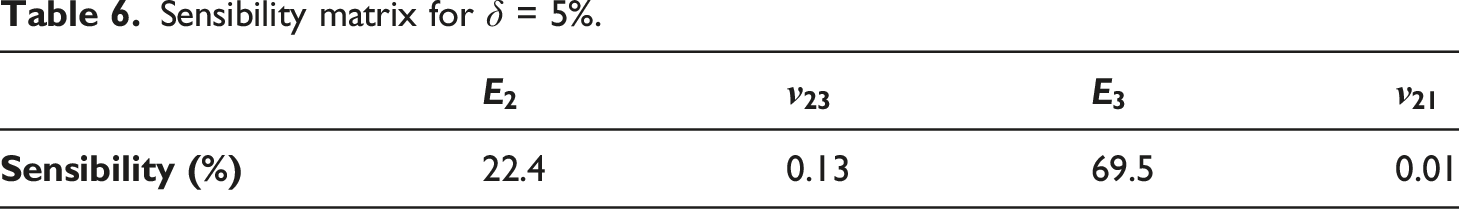
Sensibility matrix for

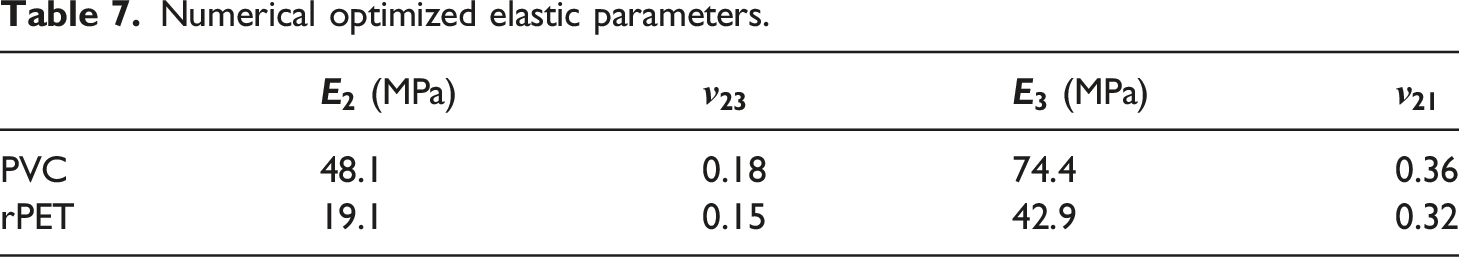
Numerical optimized elastic parameters.
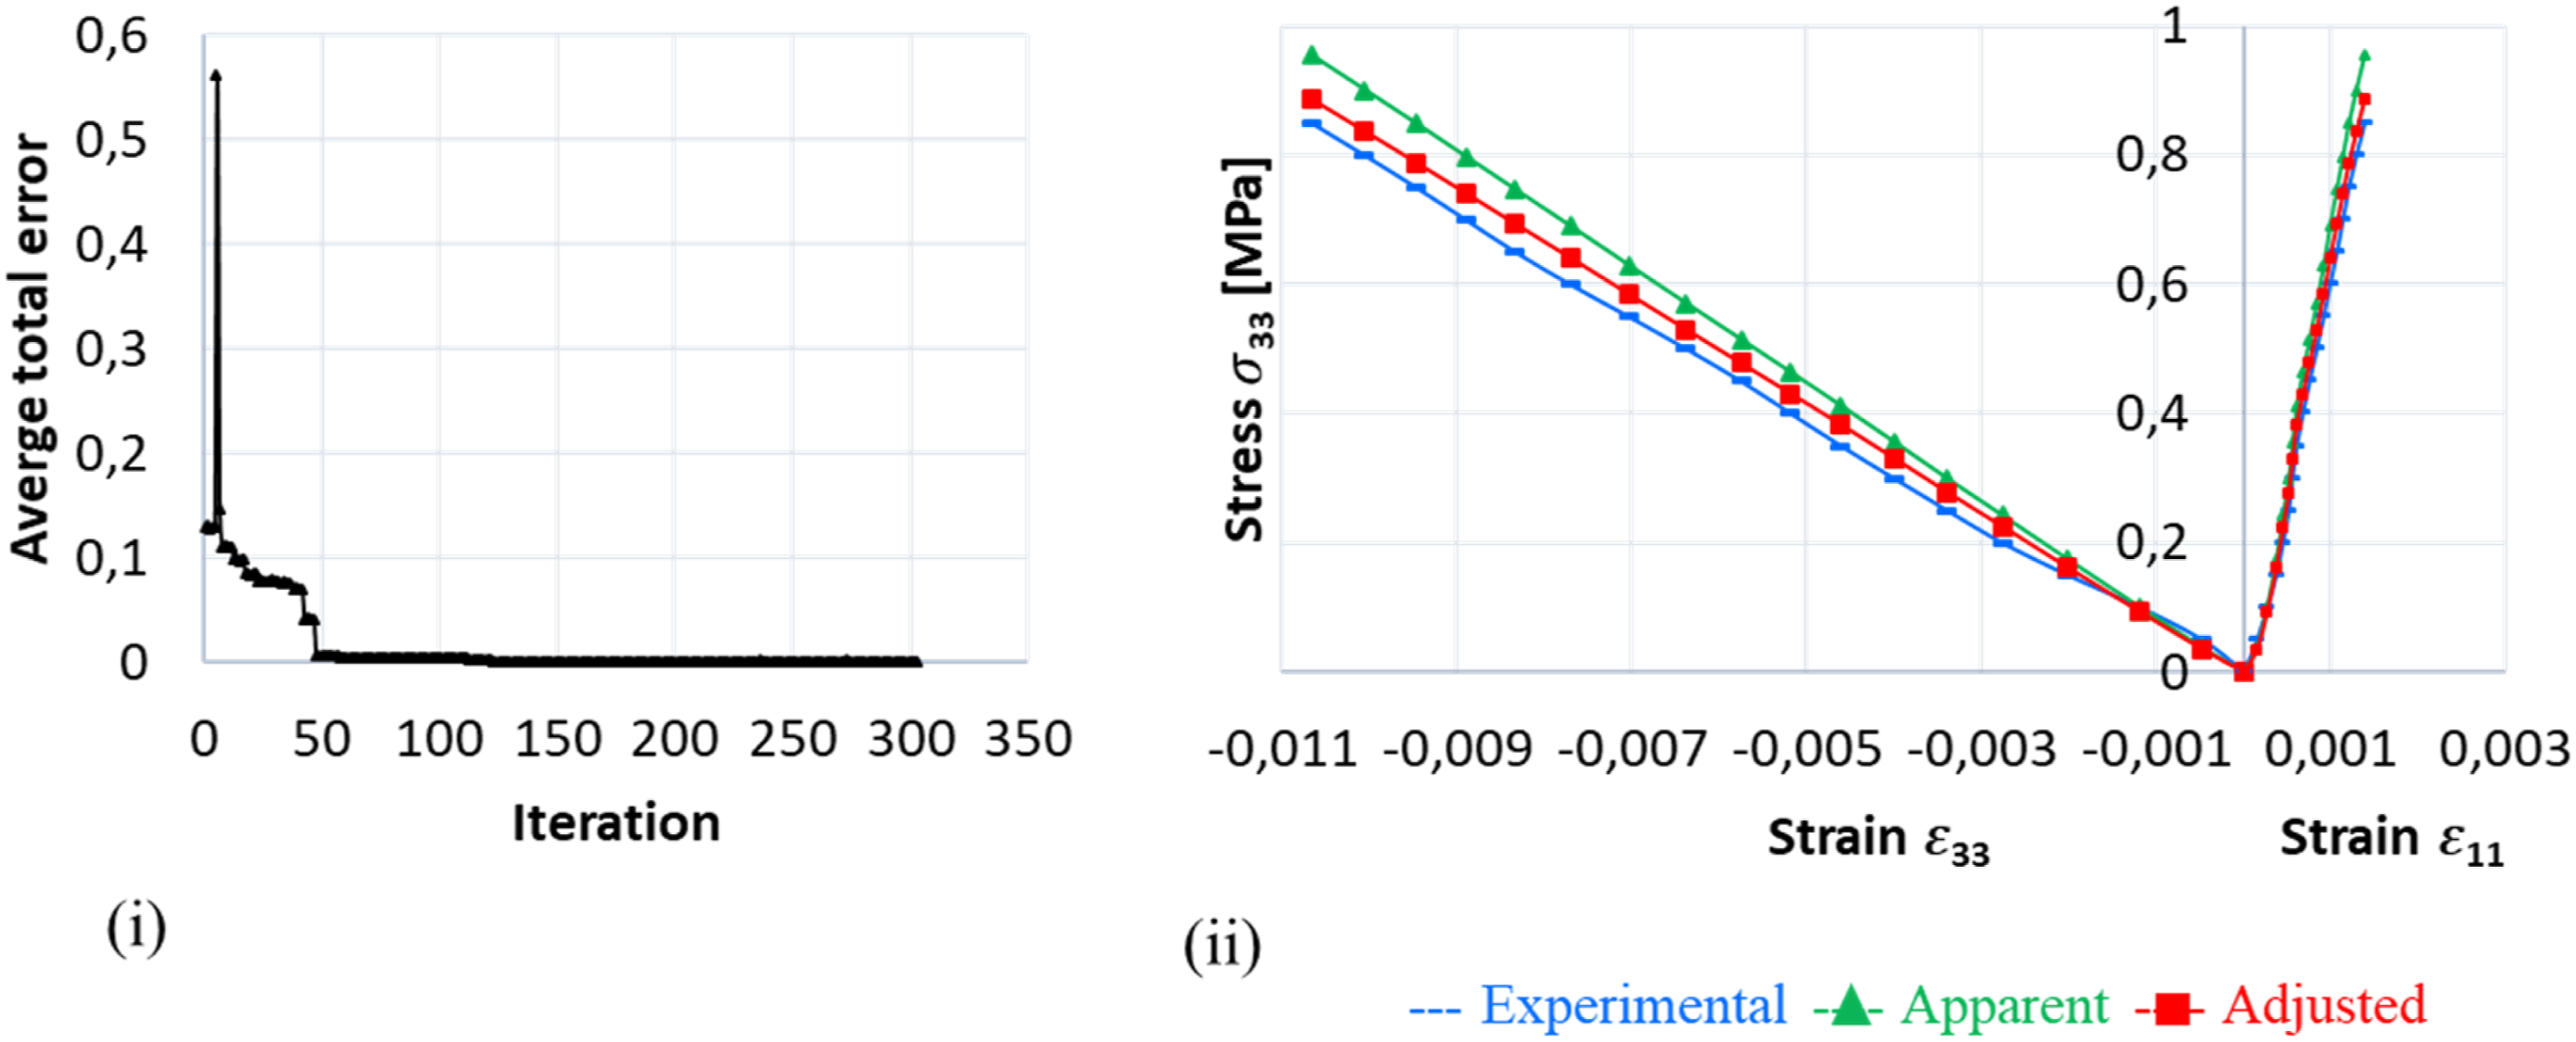
(i) Total error evolution, (ii) Stress-strain evolution for the set b of PVC specimens.
Analysis and discussions
Based on the graph (ii) of Figure 12, the green curve with the triangle pattern is drawn numerically using the apparent parameters found experimentally as input properties, while the blue curve with the dash pattern is drawn directly using the experimental values. On the other hand, the red curve with the square pattern is the one plotted using the adjusted parameters. The values in Table 7 correspond to the red curve in Figure 12.
Since Poisson’s coefficients were not found influential, their values displayed in Table 7 are not representative. This result is due to the fact that the FEMU method herein was realized based on adjusting force values. For instance, when this FEMU is performed based on displacement values, the Poisson's coefficients become influential, and their numerical values will therefore be representative.
20
But these two coefficients were already calculated, and their values were found intrinsic, as explained in the Triaxial compression tests and Uniaxial compression tests sections, as well as Young’s Modulus
Conclusions
This study identified the intrinsic elastic behavior of two polymer foams used as core materials for sandwich structures. This research was conducted based on an original method combining several experimental or numerical approaches. Digital image correlation (DIC) technique was applied to determine the different strain values of each specimen for the different tests carried out. Accordingly, the experimental part led to determining some intrinsic parameters of the foam. Nevertheless, some parameters obtained are considered apparent due to the multiaxial state of stress found experimentally. These apparent properties, as well as morphological parameters, were used to validate the transverse isotropy behavior of the two foams PVC and rPET. After confirming this hypothesis, the study was completed by a FE model on Abaqus linked to a minimization function on Matlab, which resulted in identifying the intrinsic values of the other parameters. Moreover, the reliability of this method was tested by comparing one of its resulting parameters to the corresponding one from the uniaxial compression test conducted experimentally. A good correlation was found between numerical calculations and experimental results. This study will be complemented with a plastic characterization to establish the overall homogenized behavior of the foam.
Footnotes
Acknowledgements
The authors would like to acknowledge the support provided by the Occitanie region in France and the WINDELO company for this project.
Declaration of conflicting interests
The author(s) declared no potential conflicts of interest with respect to the research, authorship, and/or publication of this article.
Funding
The author(s) received no financial support for the research, authorship, and/or publication of this article.