
Abstract
The objective of this work is to determine the fracture energy of a honeycomb/carbon-epoxy sandwich panel under mode II loading using the Asymmetric End-Notched Flexure (AENF) test. Experimental tests and numerical analyses aiming to validate all the procedures were performed. An equivalent crack length data reduction scheme was developed in order to simplify the experimental determination of the Resistance-curves (R-curves) using exclusively the load-displacement (P-δ) data. This strategy makes unnecessary the crack length monitoring during its propagation, which is hard to perform in mode II fracture tests. A mixed-mode I+II trapezoidal cohesive zone model was used for validating the proposed data reduction method. It was concluded that this methodology constitutes a suitable procedure for mode II fracture characterisation of debonding failure in composite sandwich panels.
Introduction
The requisites of low energy consumption led to increase the application of sandwich composite panels in structural components. 1 Their low weight makes them appealing for structures that move, as is the case of transports and wind energy blades, in order to diminish the energy consumption. 2 They also reveal good corrosion resistance and allow easier manufacture with different shapes. However, sandwich composite panels reveal a drawback related with their susceptibility to damage, namely debonding at the skin/core interfaces induced by, for example, low velocity impact. 3 Under bending loading, significant shear stresses develop at these interfaces owing to mismatch bending between the different materials constituting the skin and the core. Consequently, fracture characterisation under mode II loading of the skin/core bonding is crucial for an appropriate design. In this context, the Cracked Sandwich Beam (CSB) specimen has been used4,5 for the mode II dominated debonding fracture. This specimen can be viewed as an asymmetric version of the typical End-Notched Flexure (ENF) specimen widely used for mode II fracture characterisation of composite materials and adhesive bonded joints, and adapted to the sandwich configuration. For the study of mode II debonding, Carlsson 4 performed a design analysis of this specimen based on laminated beam first-order shear deformation theory. He concluded that crack kinking into the core is unlikely to occur, since the sign of interlaminar shear stresses at the crack tip is negative. On the other hand, core crushing may occur, as the normal stresses at the crack tip are compressive. In another study, Carlsson et al. 6 concluded that specimens employing a short crack reveal core shear failure preceding crack extension, while core crushing at the crack tip occurs for a long crack. The Authors argued that appropriate crack propagation is possible to achieve if there is a correct selection of the specimen dimensions. Shipsha et al. 5 proposed an alteration to the classic sandwich ENF specimen by including a stiff metal hinge with rounded edges in the pre-crack region. The objective was keeping the sandwich faces at a constant distance in order to minimise friction effects between the crack faces, whose influence on fatigue analysis was considered relevant. The Authors observed that the modified version of the specimen gave rise to more stable crack growth. Zhang et al. 7 studied the influence of elevated temperature on mode II interfacial fracture response of composite sandwich materials with glass-fibre reinforced polymer skins (GFRP) and foam core using the ENF test. They observed a reduction of the strain energy release rate with temperature increase and unstable crack growth for temperatures close to the glass transition temperature of GFRP. The Authors also proposed an analytical model to predict the strain energy release rate of specimens accounting for change of temperatures and friction between the crack faces. They concluded about its good performance when the friction between the crack faces is considered. Bluth et al. 8 proposed the separated ENF test for mode II fracture toughness characterisation of skin/core debonding in sandwich composites. This test considers an adjustable tensioned wire placed underneath the top skin to avoid its contact with the core, thus preventing frictional forces between crack faces during loading. An additional objective was to achieve crack growth stability. The Authors concluded that stability increases with the ratio between the initial crack length and the span length.
The objective of this work is to perform mode II fracture characterisation of the skin/core debonding in sandwich composites panels. The AENF test was considered for this purpose. In order to overcome the difficulties associated to crack length monitoring during these fracture tests, a data reduction scheme based on Timoshenko beam theory, specimen compliance and equivalent crack concept was used in order to obtain the R-curves. A finite element analysis including mixed-mode I+II trapezoidal cohesive zone model was performed aiming to validate all the procedures. It was confirmed that the used specimen configuration favours the dominance of mode II loading constituting a valuable solution for mode II fracture characterisation of debonding in sandwich specimens.
Experimental work
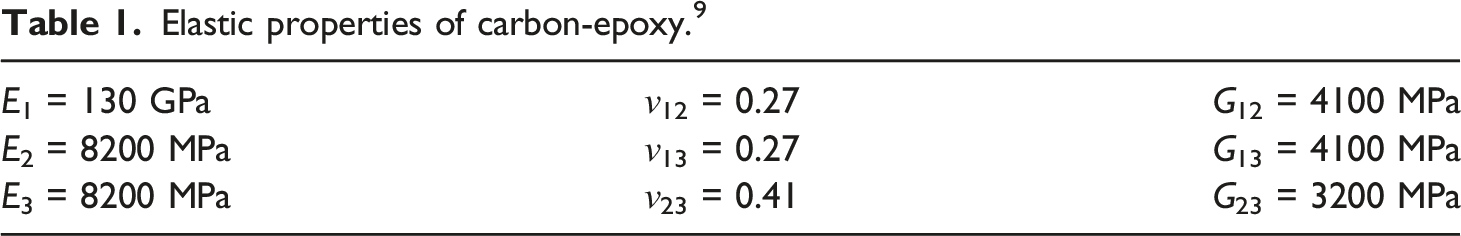
Elastic properties of carbon-epoxy. 9
The core hexagonal unit cell is shown in Figure 1. The core elastic properties were obtained using the Malek and Gibson methodology,
10
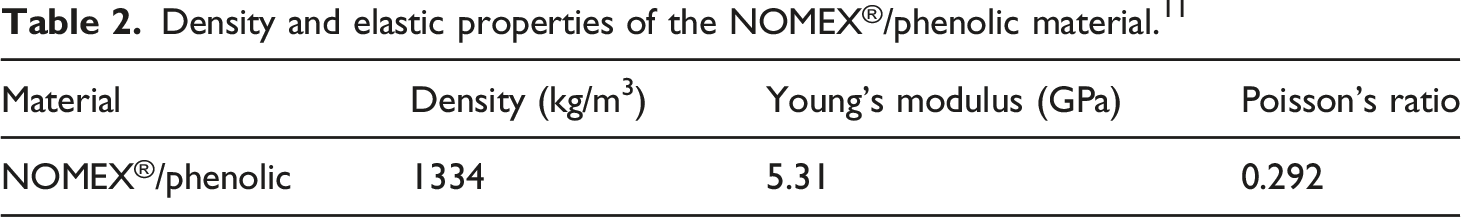
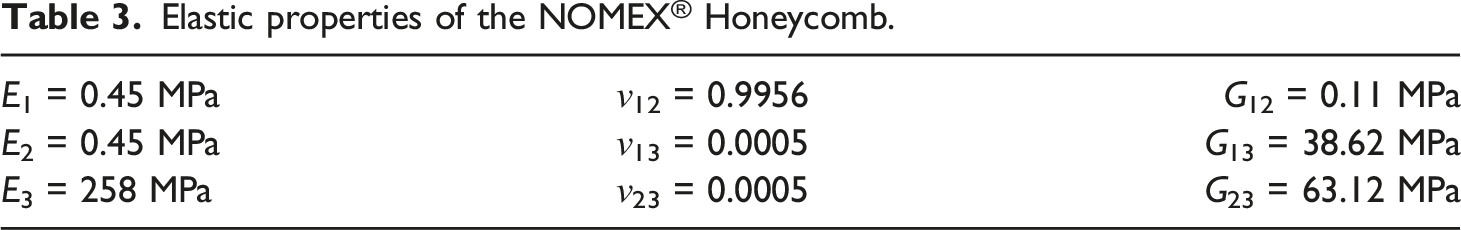
which requires the cell dimensions (Figure 1) and the density and elastic constants of the NOMEX®/phenolic material that constitutes the honeycomb (Table 2). The resulting elastic properties of the NOMEX® Honeycomb core are presented in Table 3 and are used in the simulations of the sandwich panel fracture behaviour. Unit cell definition for the hexagonal NOMEX®/phenolic material. Geometrical parameters: l=h=2.7329 mm, t = 0.0895 mm and θ = 30°. Density and elastic properties of the NOMEX®/phenolic material.
11
Elastic properties of the NOMEX® Honeycomb.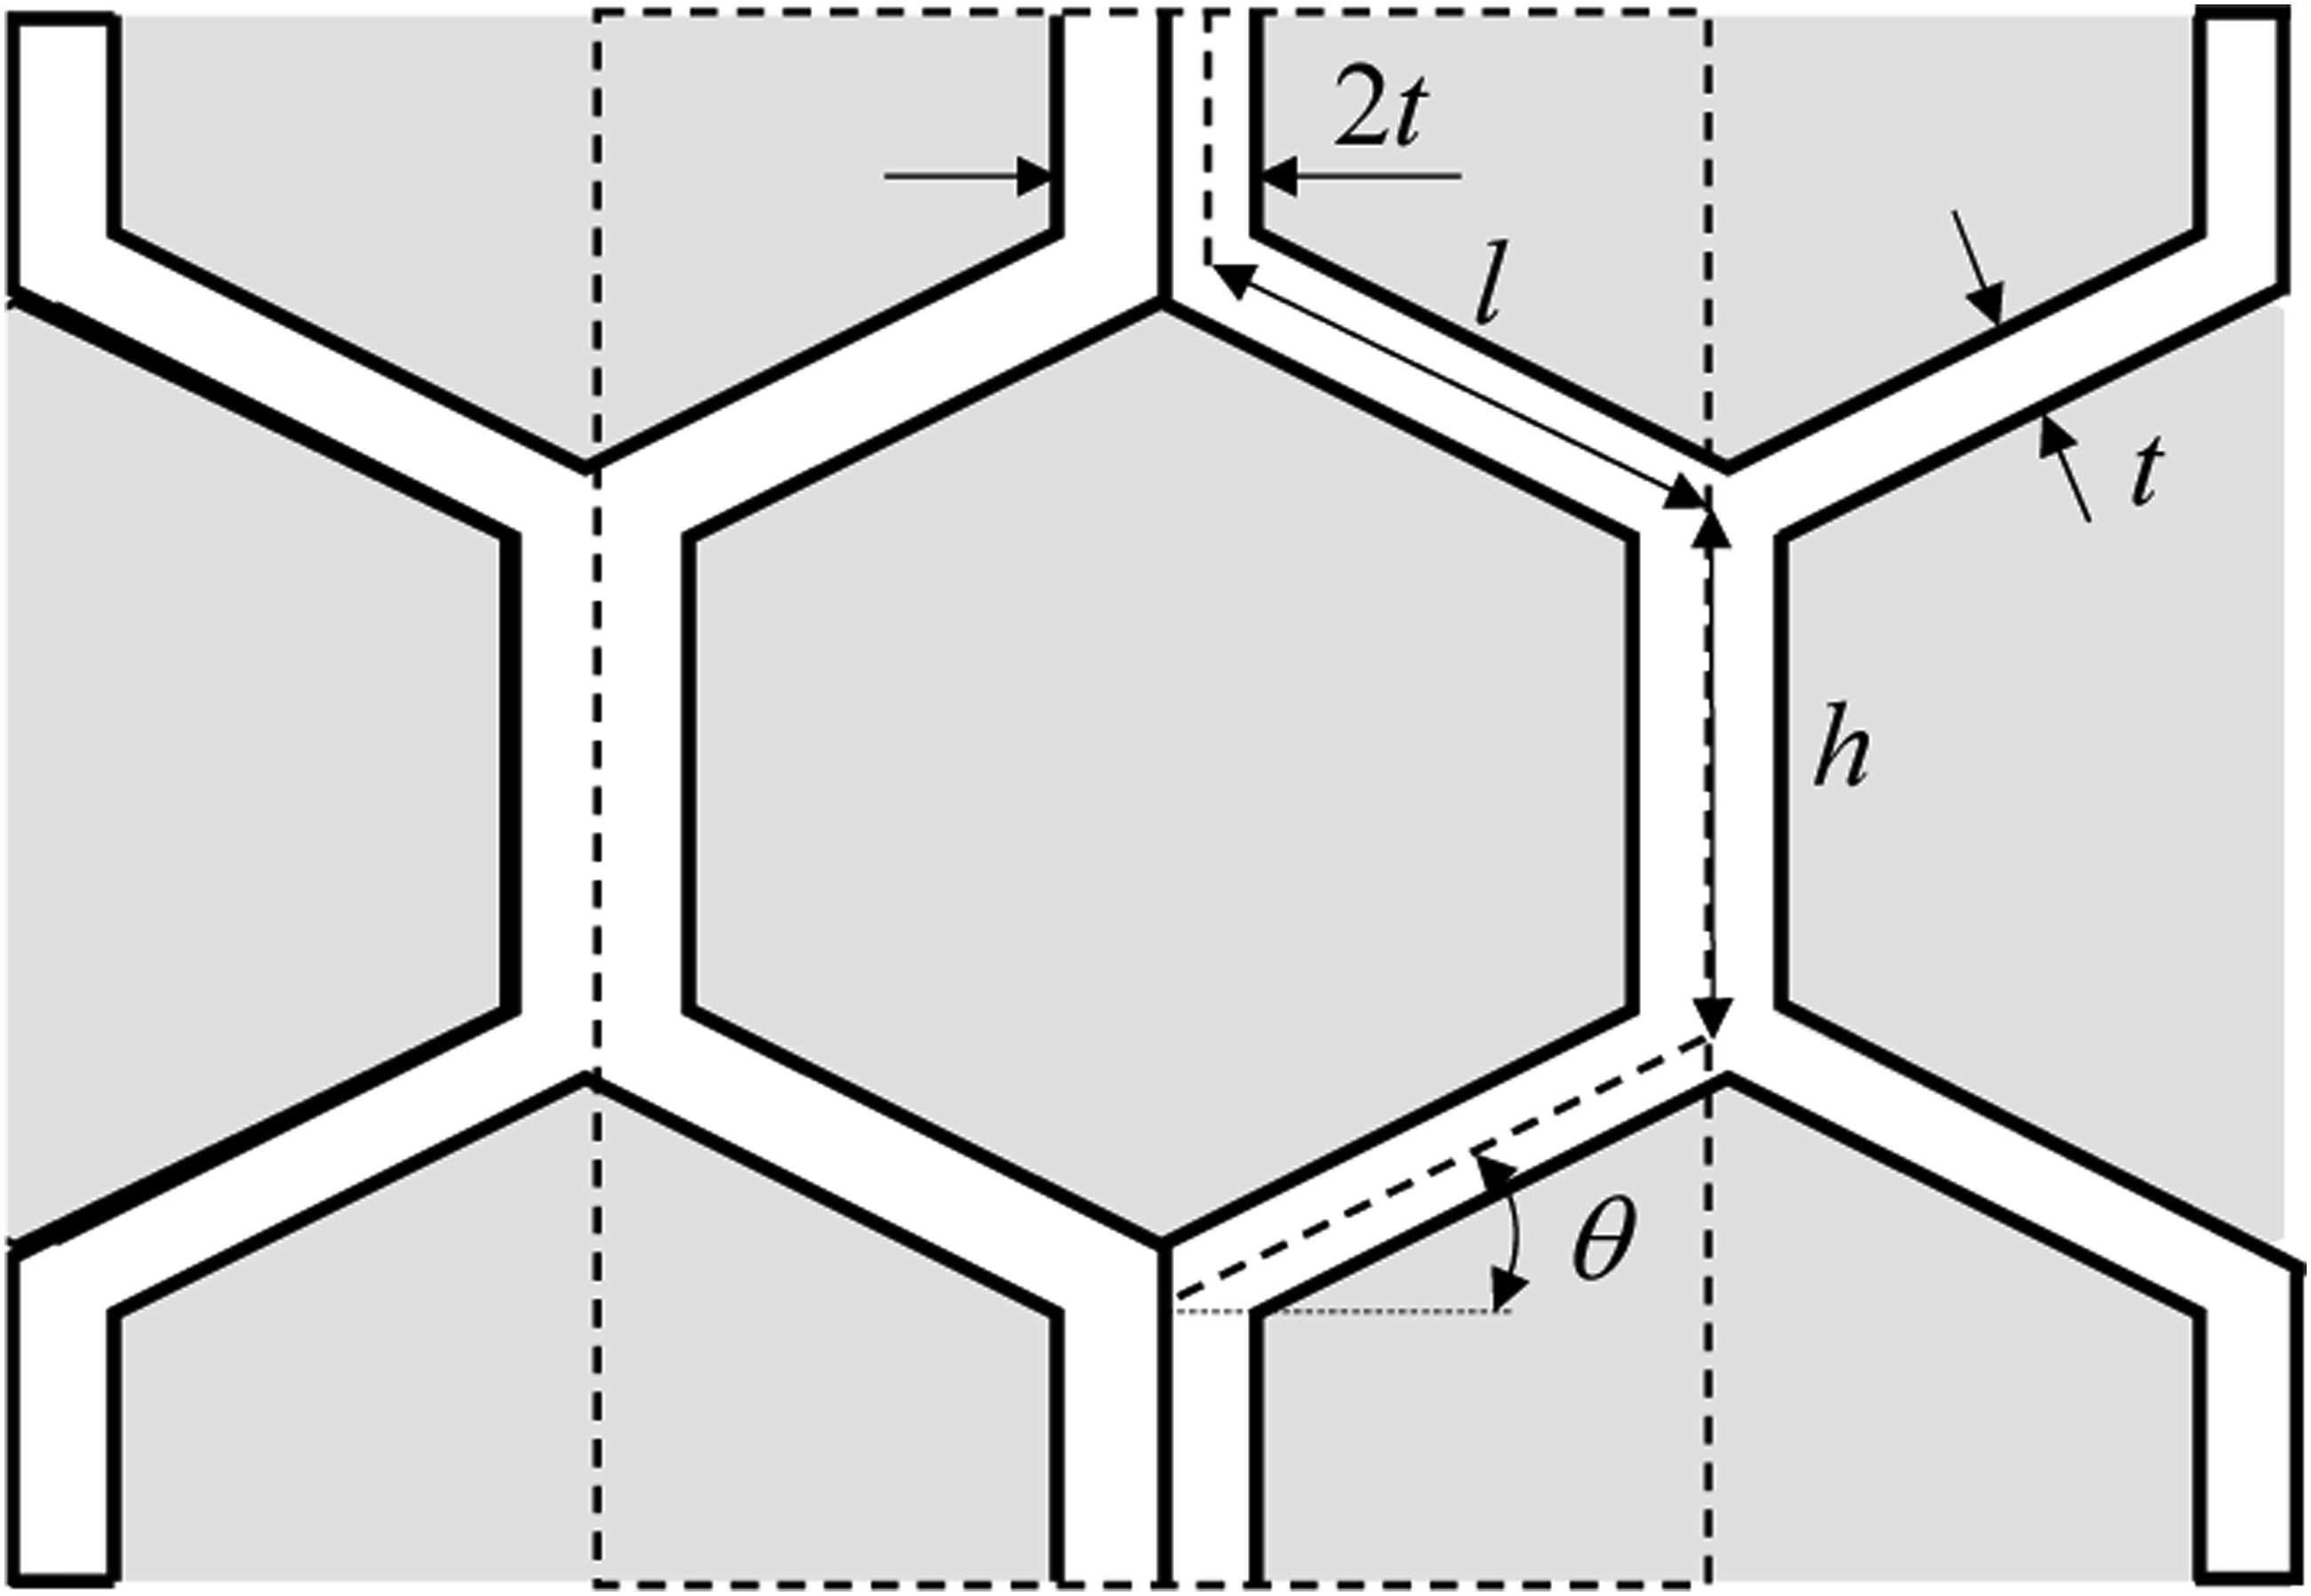
The sandwich panels were manufactured by skin/core bonding using a structural epoxy adhesive with moderate ductility, ARALDITE® 2015–1 from Huntsman (E = 1850 MPa and ν = 0.3). In order to improve skin/core adhesion, the CFRP bonding surface was sandpapered, subsequently cleaned and degreased with isopropyl alcohol. A bond line thickness of 0.3 mm was assured inserting calibrated steel spacers at the plate edges. The introduction of the pre-crack was implemented by placing two thin TEFLON® films at pre-defined region with the selected length. A small amount of lubricating oil was placed between them in order to diminish the friction effects at the pre-crack region. The final specimens (Figure 2) were obtained after cutting operations of the sandwich panel. Schematic representation of the AENF test (dimensions in mm): L=75, a0=45, hc=10, hs=1.5 and width B=30.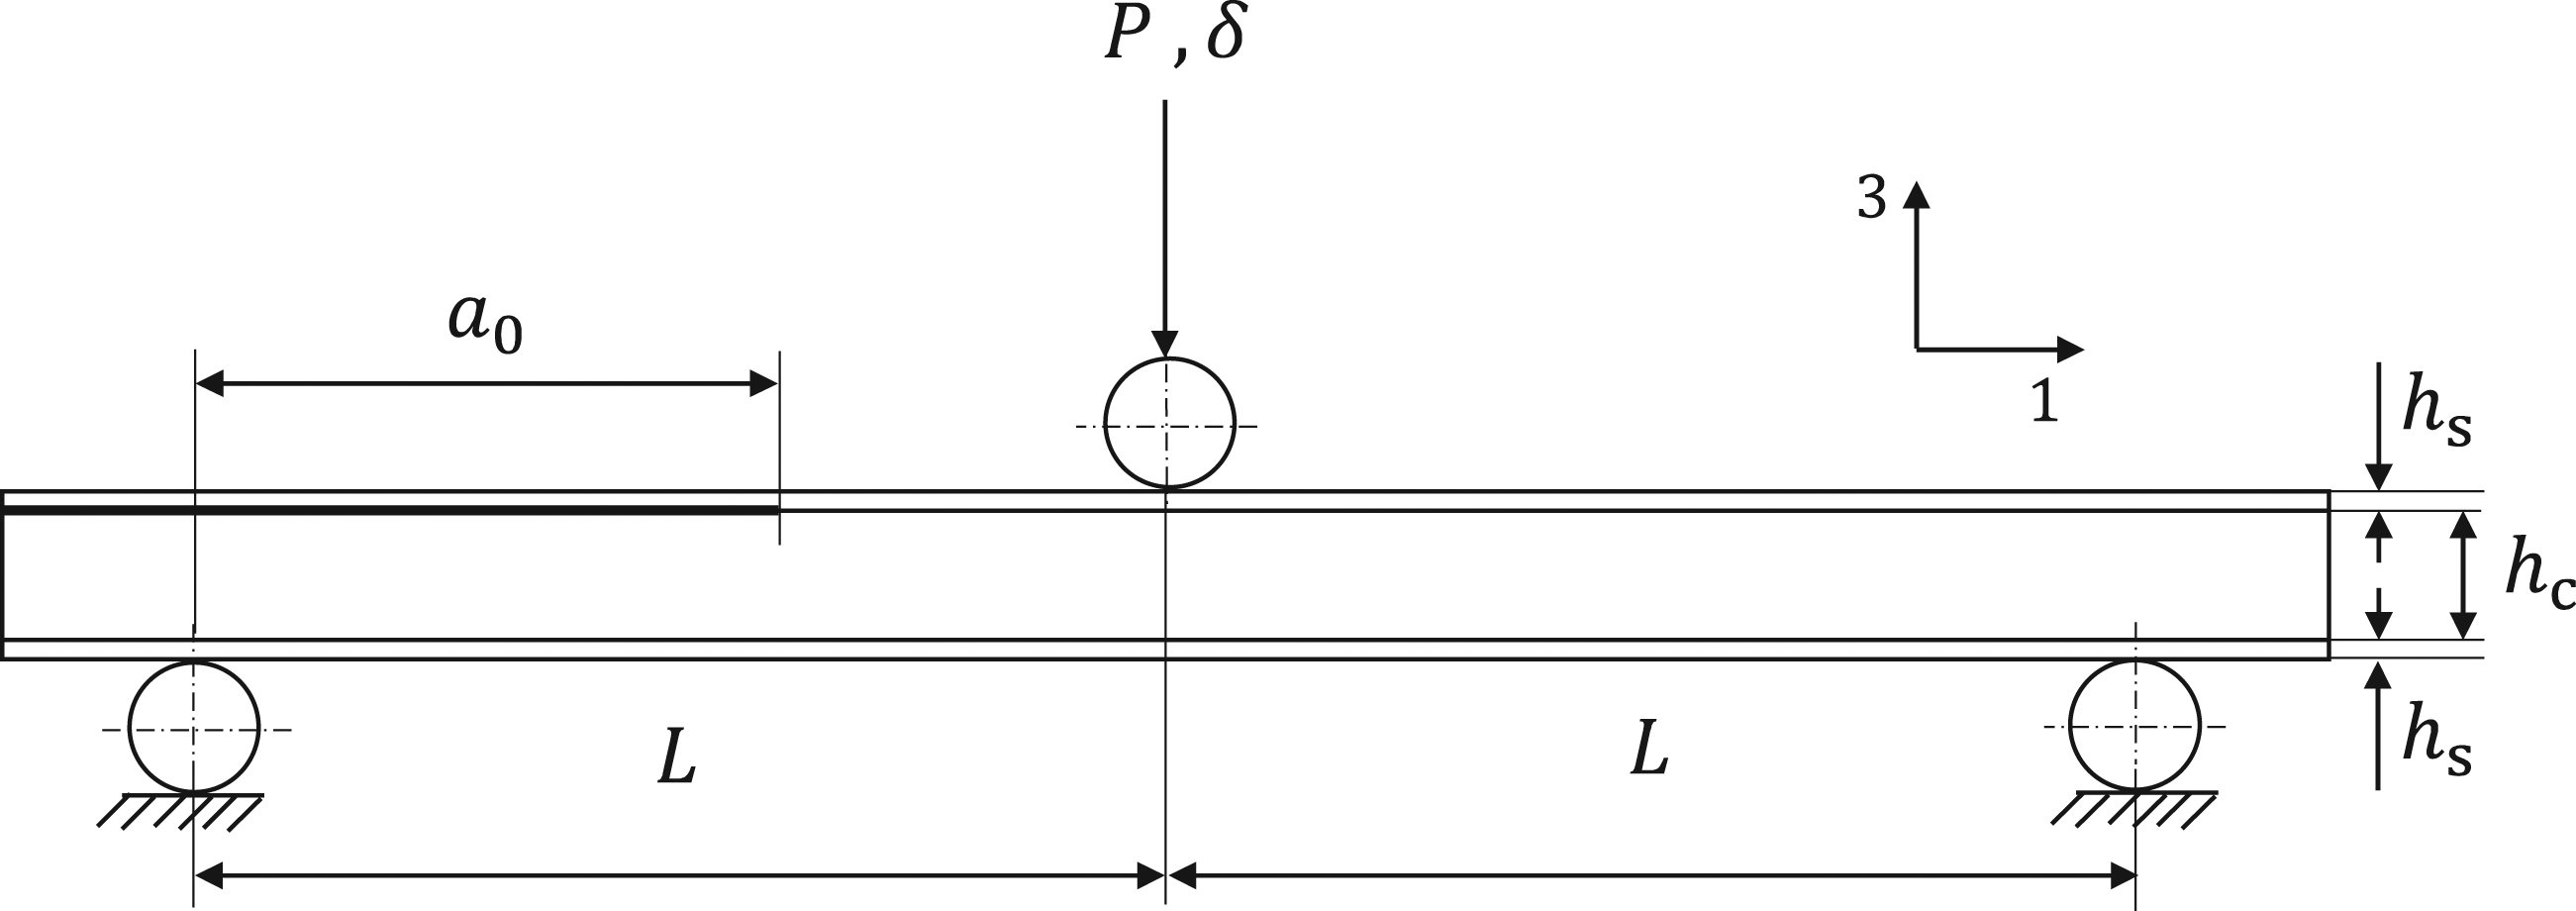
The fracture tests (Figure 3) were performed on a universal testing machine (INSTRON® 5900R) with a load cell of 1 kN. The loading was applied under displacement control with a rate of 1 mm/min. The P-δ curves were recorded for post-processing analysis aiming to get the R-curves. Damage propagation took place for a certain extent as a combination of core/skin debonding and core shear failure in the vicinity of the crack plane. The energy associated to this failure mode was considered as being representative of the critical mode II fracture energy of these sandwich panels. The AENF test.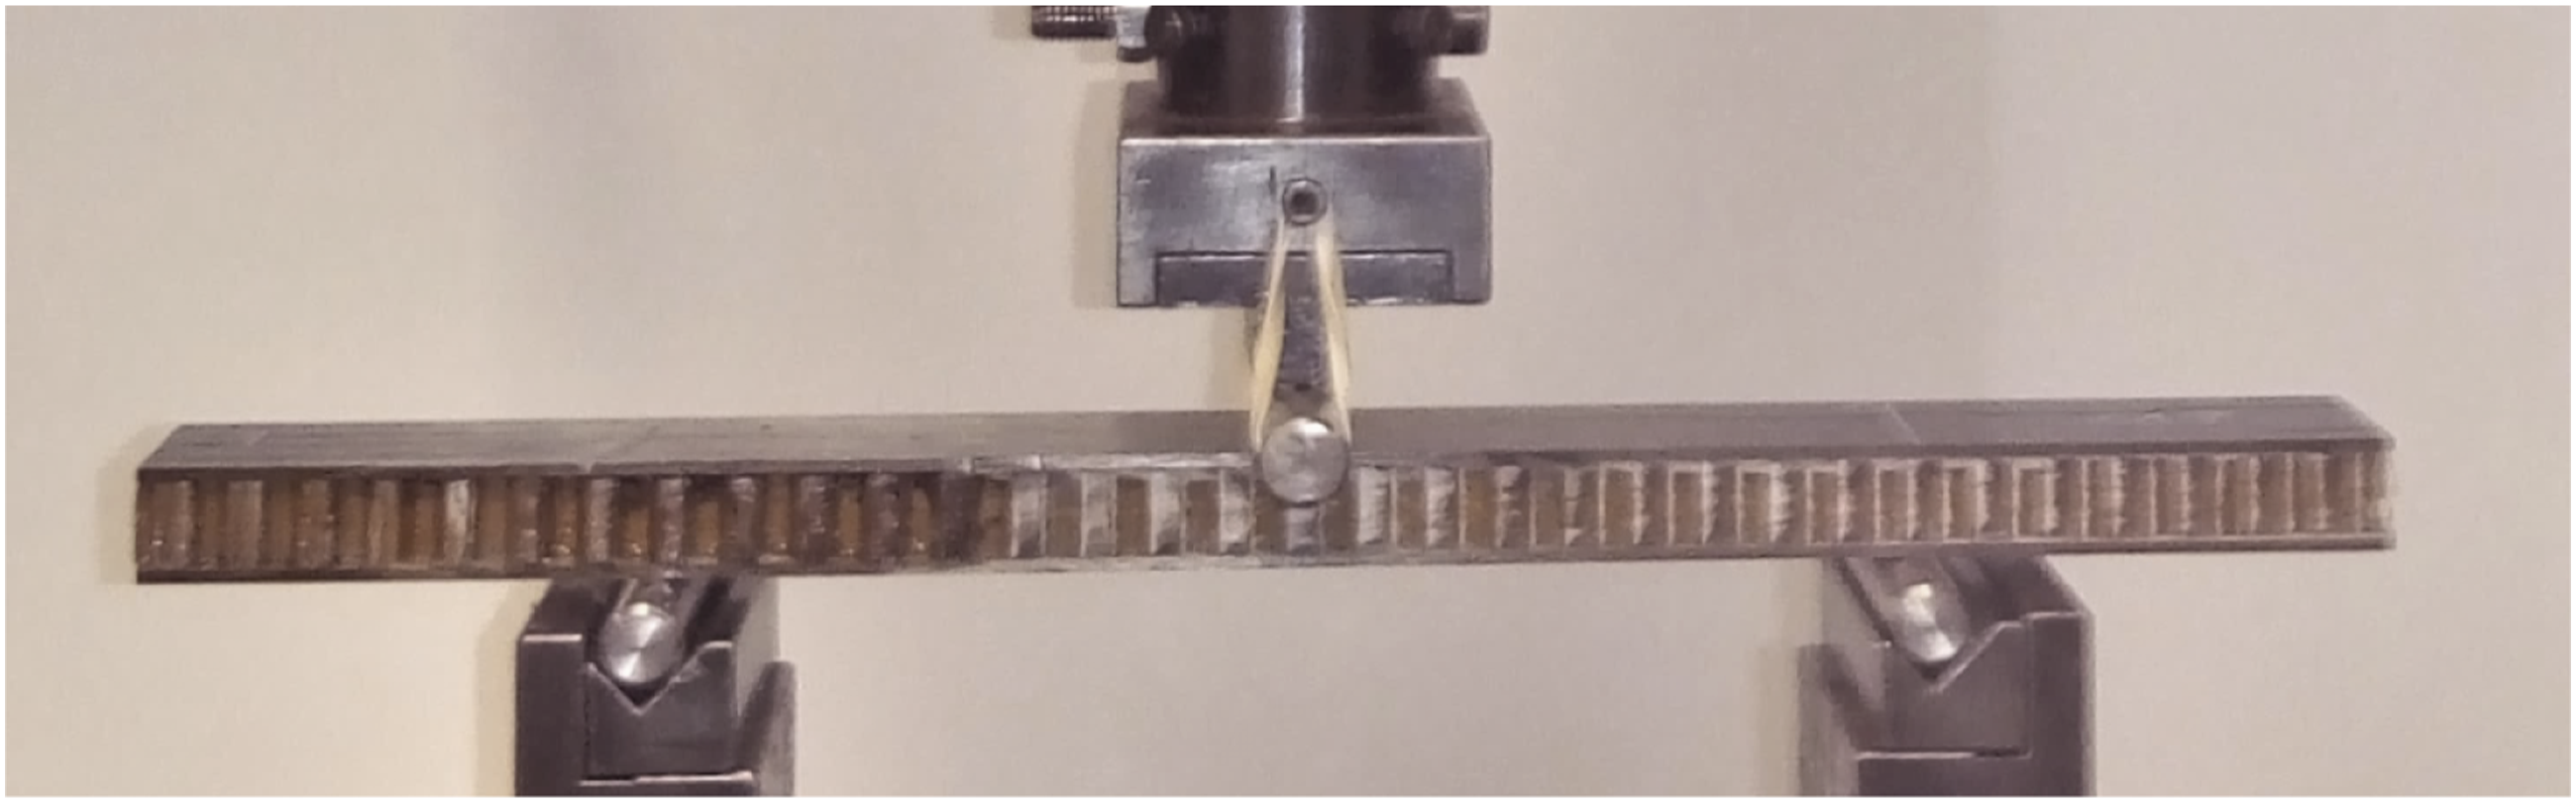
Data reduction scheme
An asymmetric version of the ENF test was used aiming to characterise the mode II fracture behaviour of sandwich panels. Despite the geometrical and material asymmetries, damage propagates almost under shear at, or close to, the intended skin/core bonding. Owing to test specificities, the clear identification of the damage size in the course of the test becomes a quite complicated task. In order to circumvent this relevant limitation that could originate important errors on fracture energy estimation, a data reduction scheme based on Timoshenko beam theory, specimen compliance and equivalent crack concept (Compliance Based Beam Method – CBBM) was developed for this test.
The method starts with determination of the strain energy of the AENF specimen considering bending (UB) and shear (US) effects,
12

In order to facilitate obtaining the equations, the sandwich AENF specimen is divided in three parts: the upper skin (identified by subscript U in Figure 4) and the remaining core and lower skin (identified by subscript L in Figure 4) at the debonded region, and the intact sandwich part (identified by subscript T in Figure 4). The reaction load at the left support must be partitioned between the two arms (subscripts U and L). Assuming that they behave like two cantilever beams fixed to the intact part of the specimen and deforming with the same curvature, the following relation can be obtained Identification of geometrical parameters on the AENF specimen.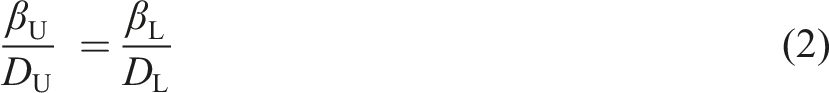


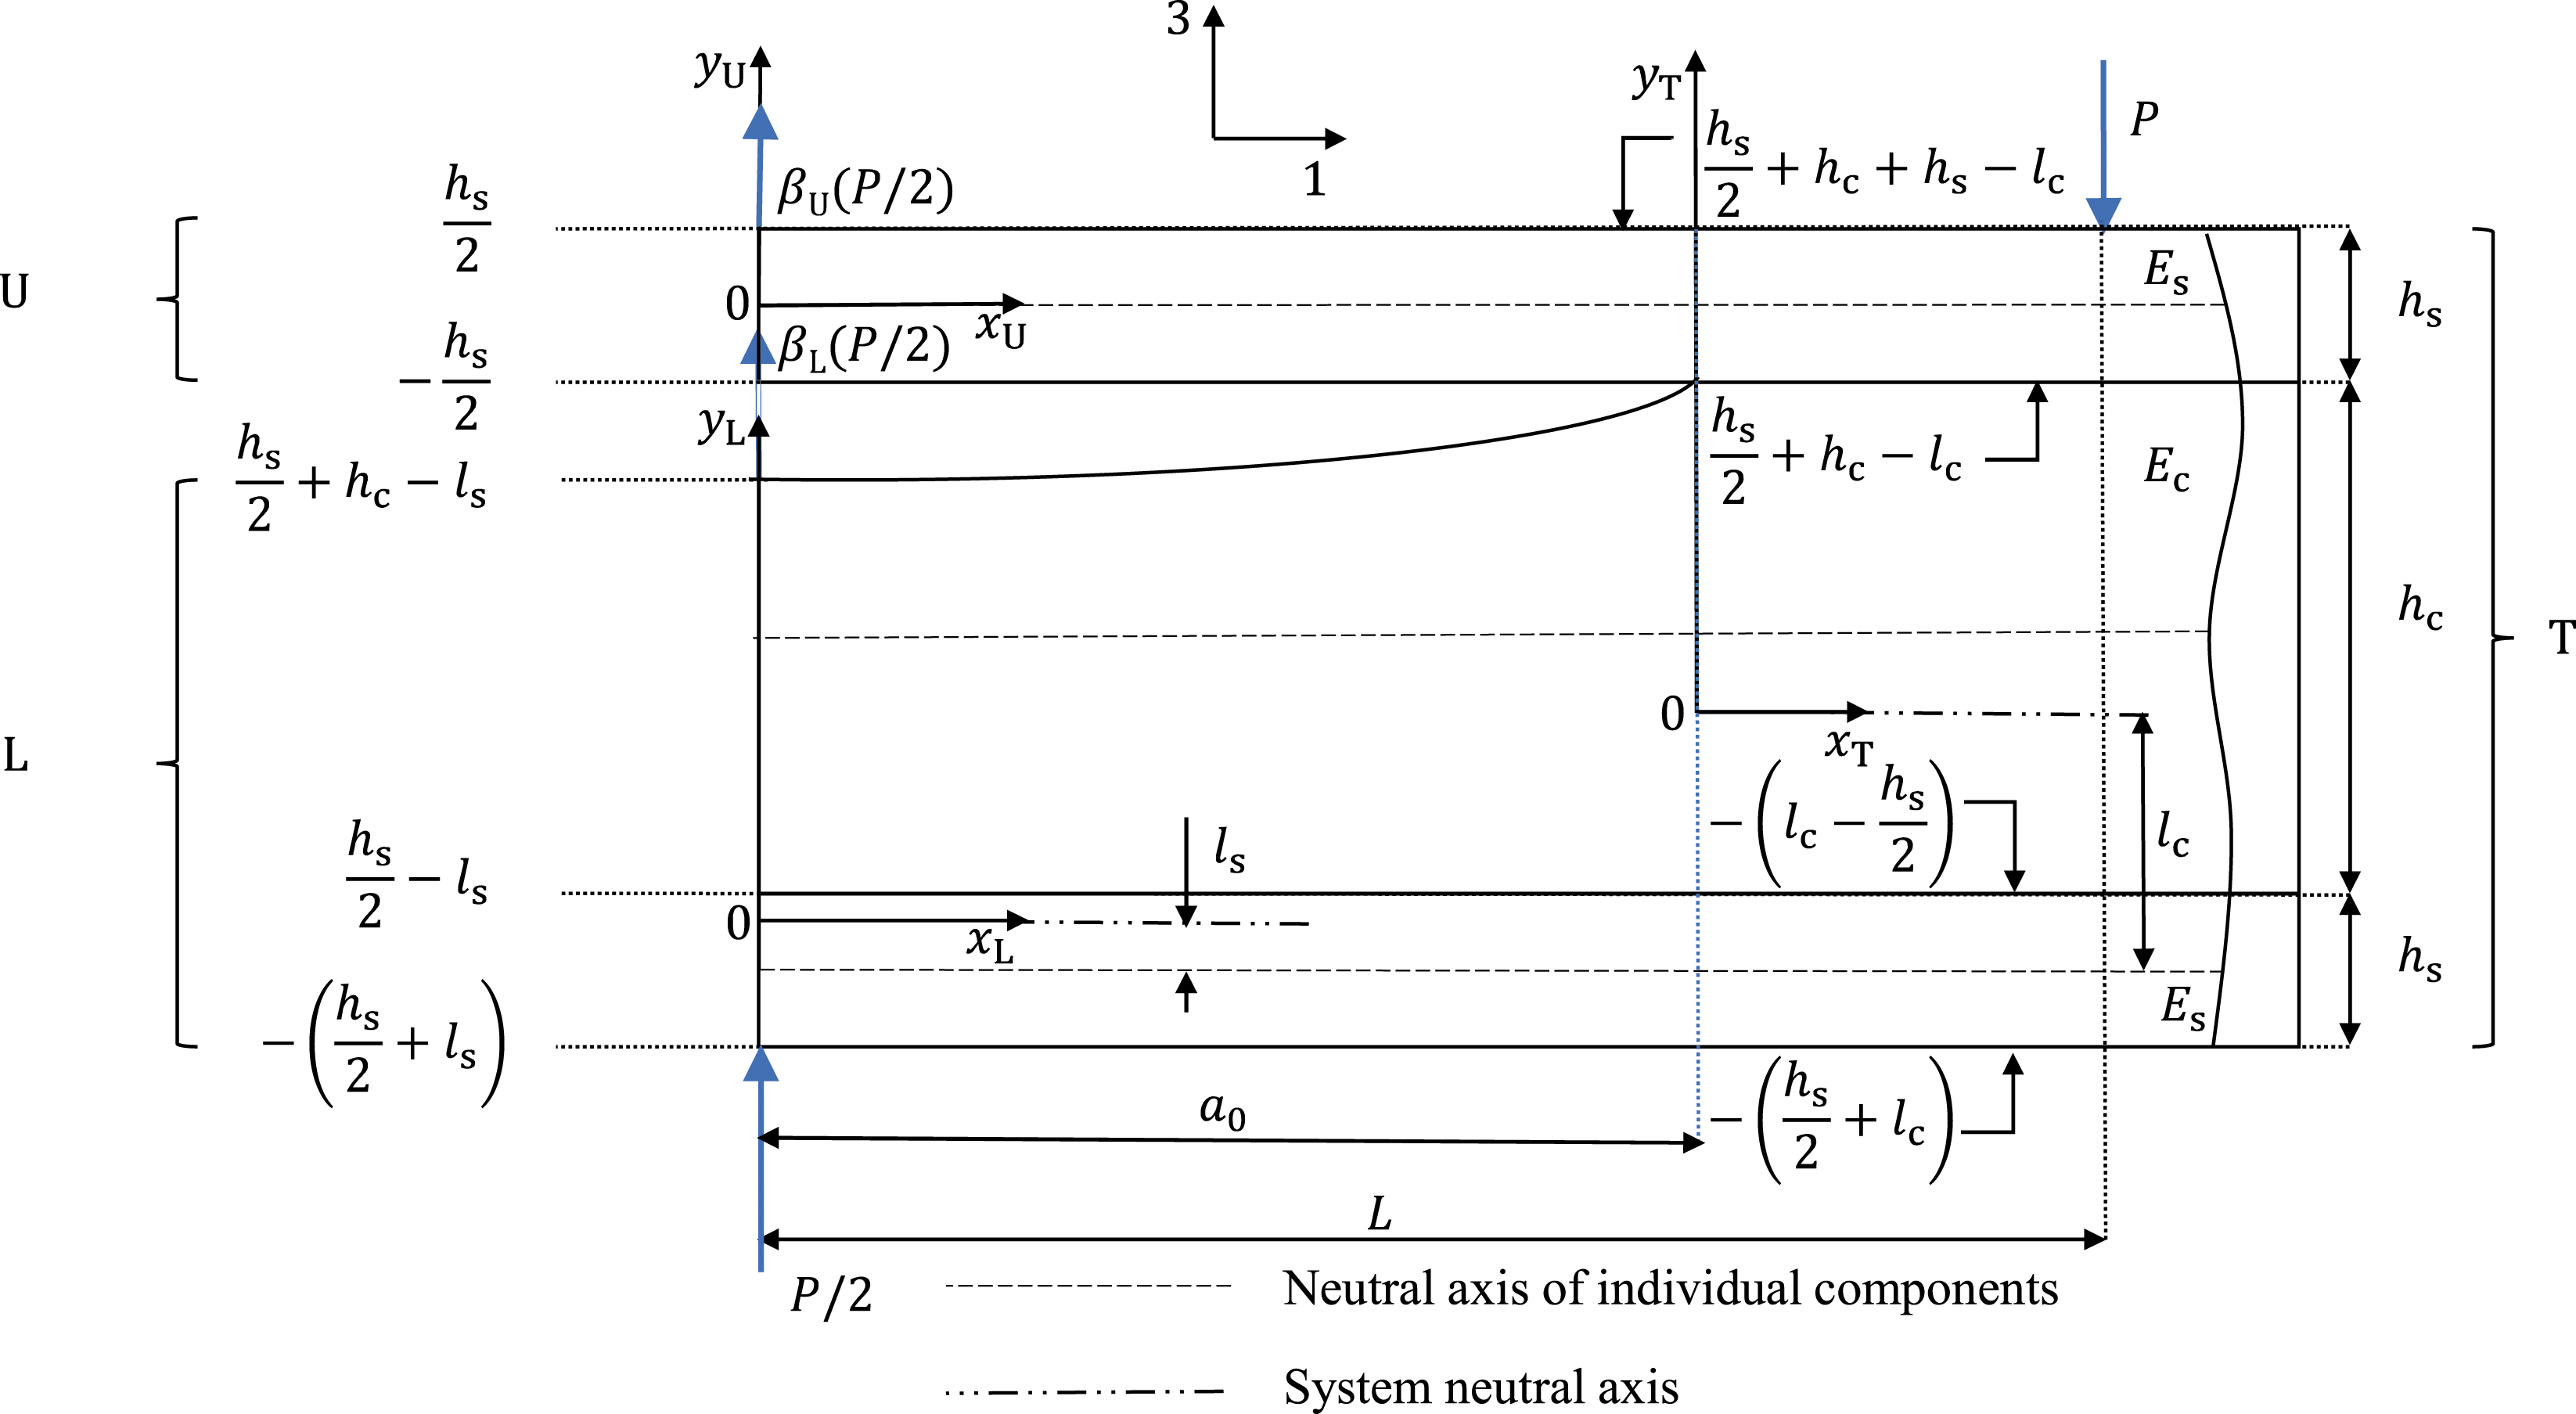
For the region U (Figure 4), the strain energy is obtained from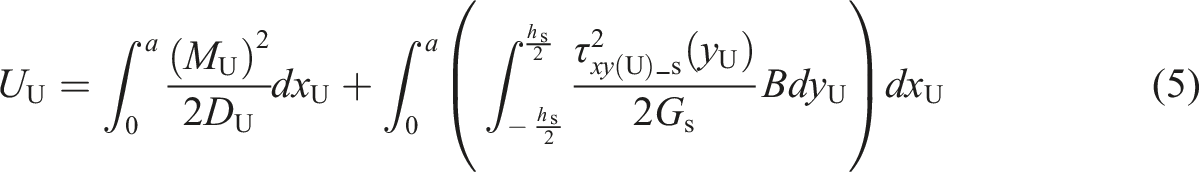
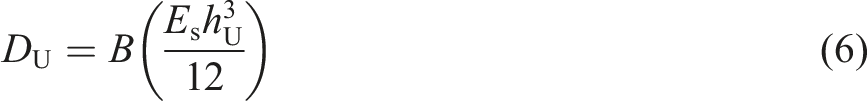
Es being the longitudinal modulus (E1) of the skin and B is the width as introduced in Figure 2. The profile of shear stresses along thickness can be obtained from the next equation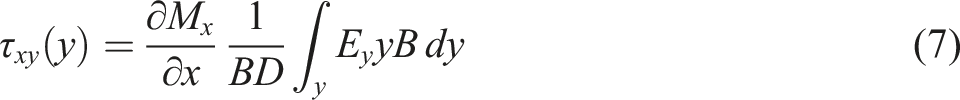

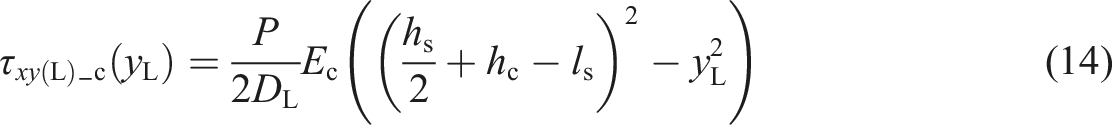
For the region L (Figure 4), the strain energy writes,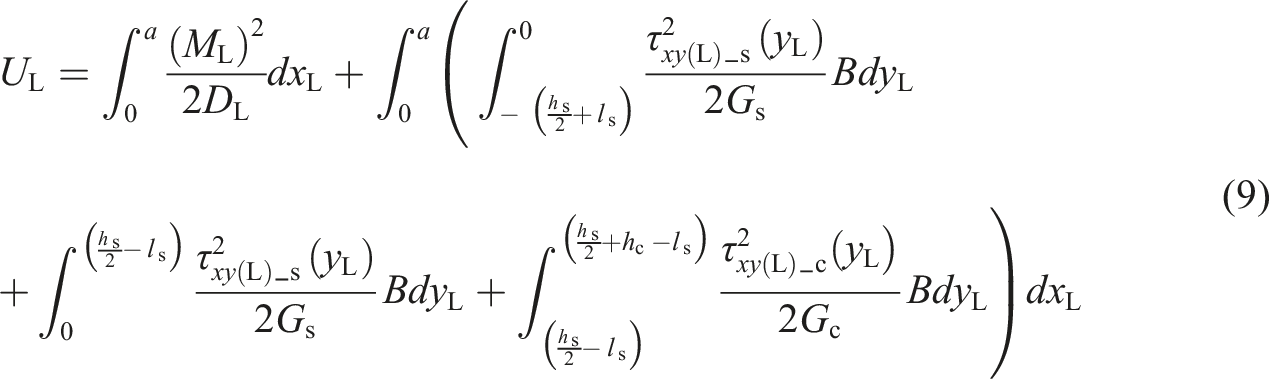


The shear stress profile along thickness within part L can be given by equation (8). For 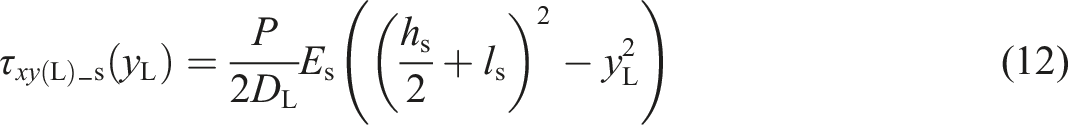

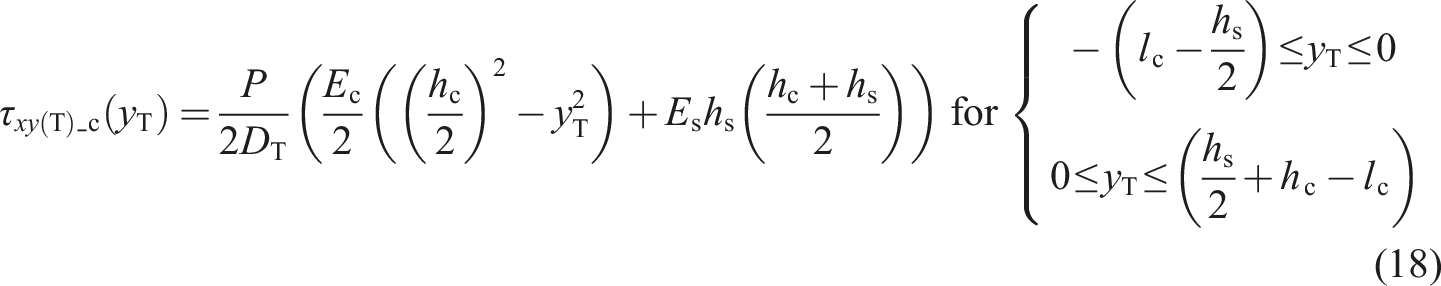
For the region T (Figure 4), the strain energy of the specimen becomes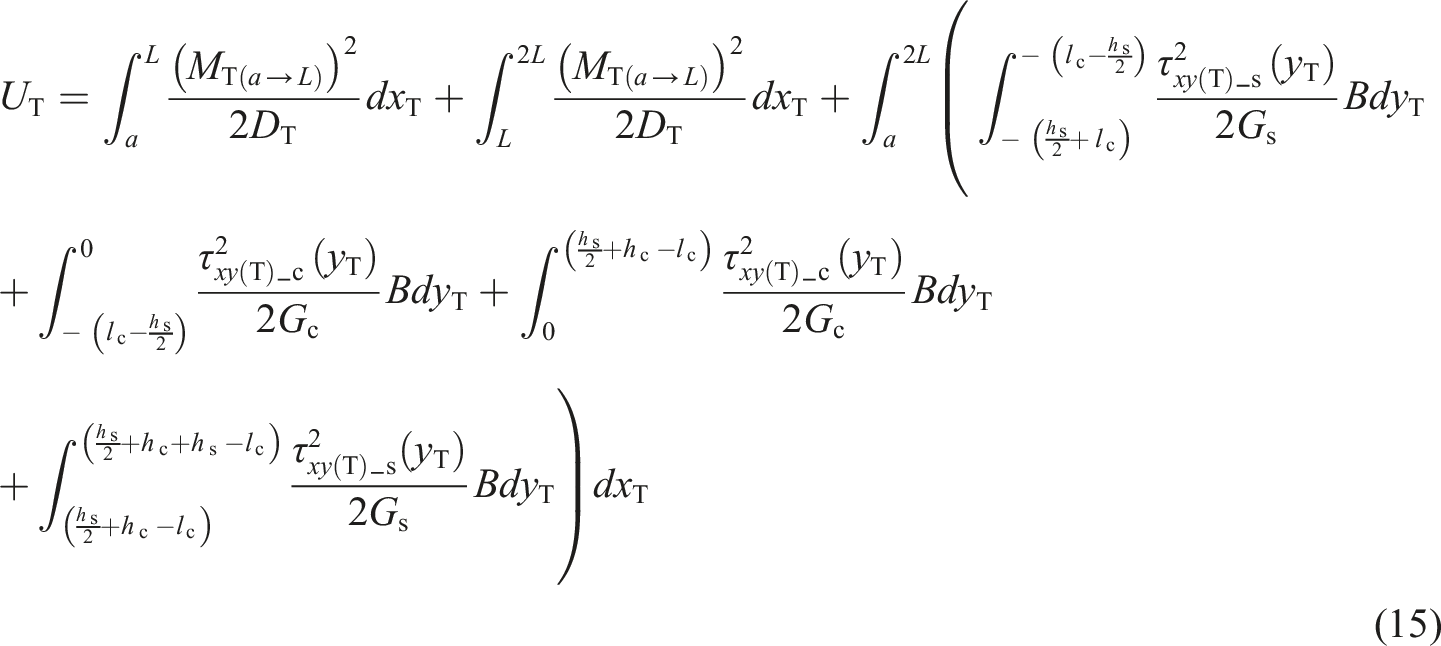
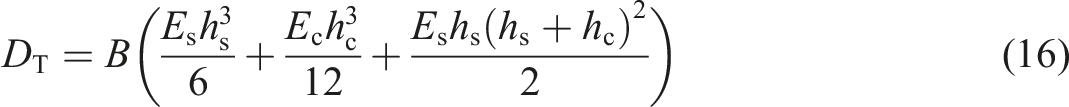
The outline of shear stresses along thickness of part T are given by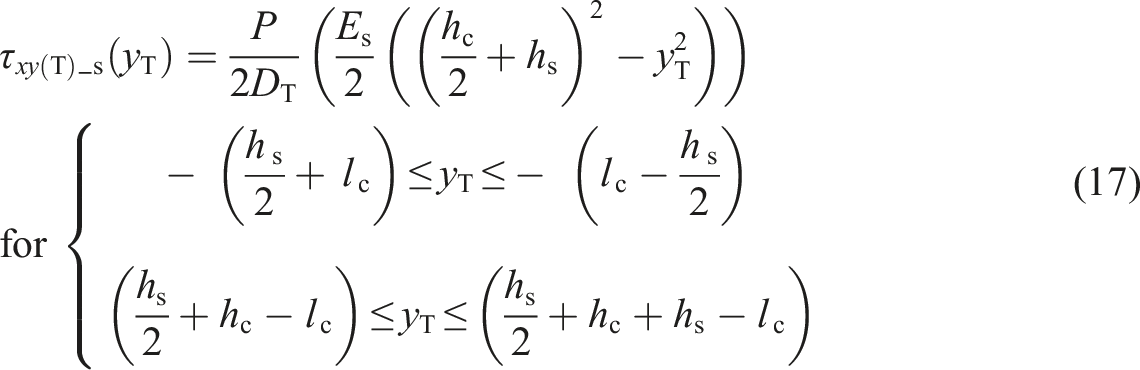
The total strain energy (U) of the AENF specimen is obtained summing the strain energy components (equations (5), (9), and (15)). Applying the Castigliano theorem (δ=dU/dP) gives rise to a relation between the applied displacement and resulting force at the loaded point, which allows to define the specimen compliance (C) as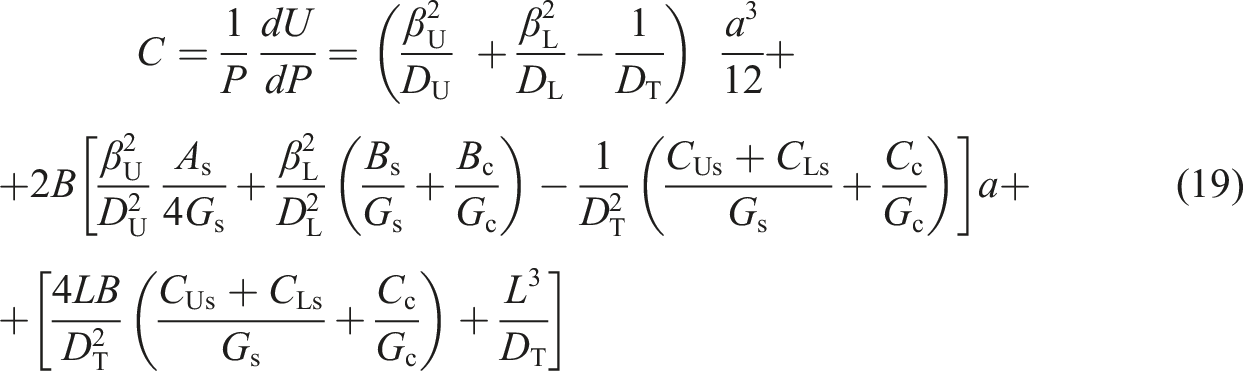

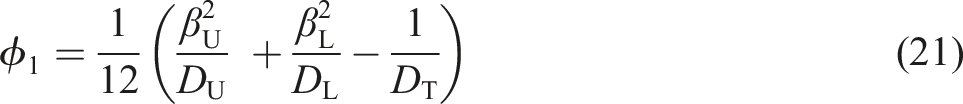


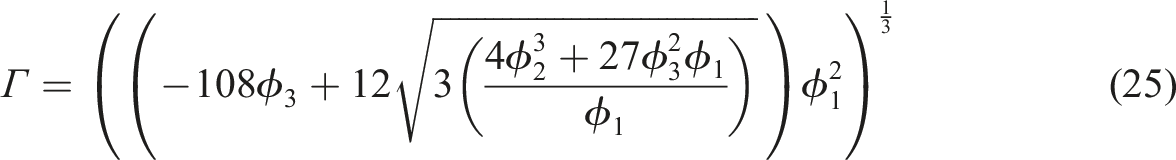
Employing the MATLAB® software, the ae becomes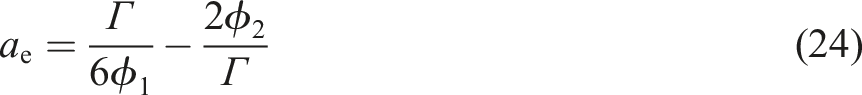
Using the Irwin-Kies relation,
13
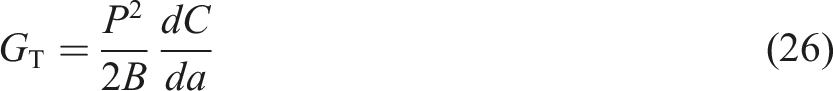
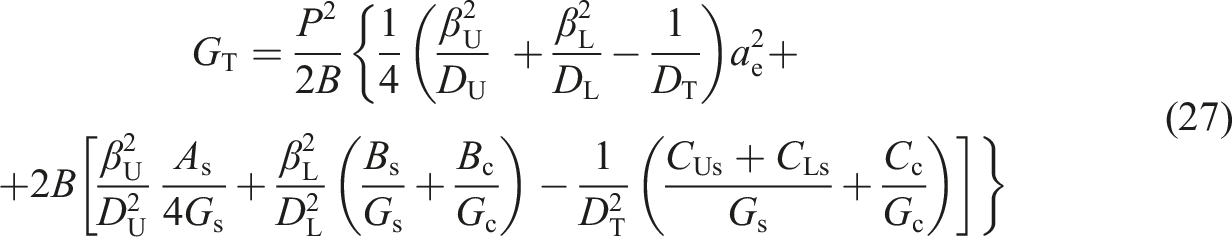
The GT=f (ae) relation is known as the R-curve. This curve allows the identification of the critical fracture energy at the plateau value that follows the initial rising trend of energy mimicking the development of the fracture process zone.
Results and discussion
The load-displacement (P-δ) curves of the four valid tests are plotted in Figure 5. The curves reveal consistency regarding initial stiffness and maximum load, after which all the curves present an almost constant value (plateau). Load-displacement curves of the AENF test.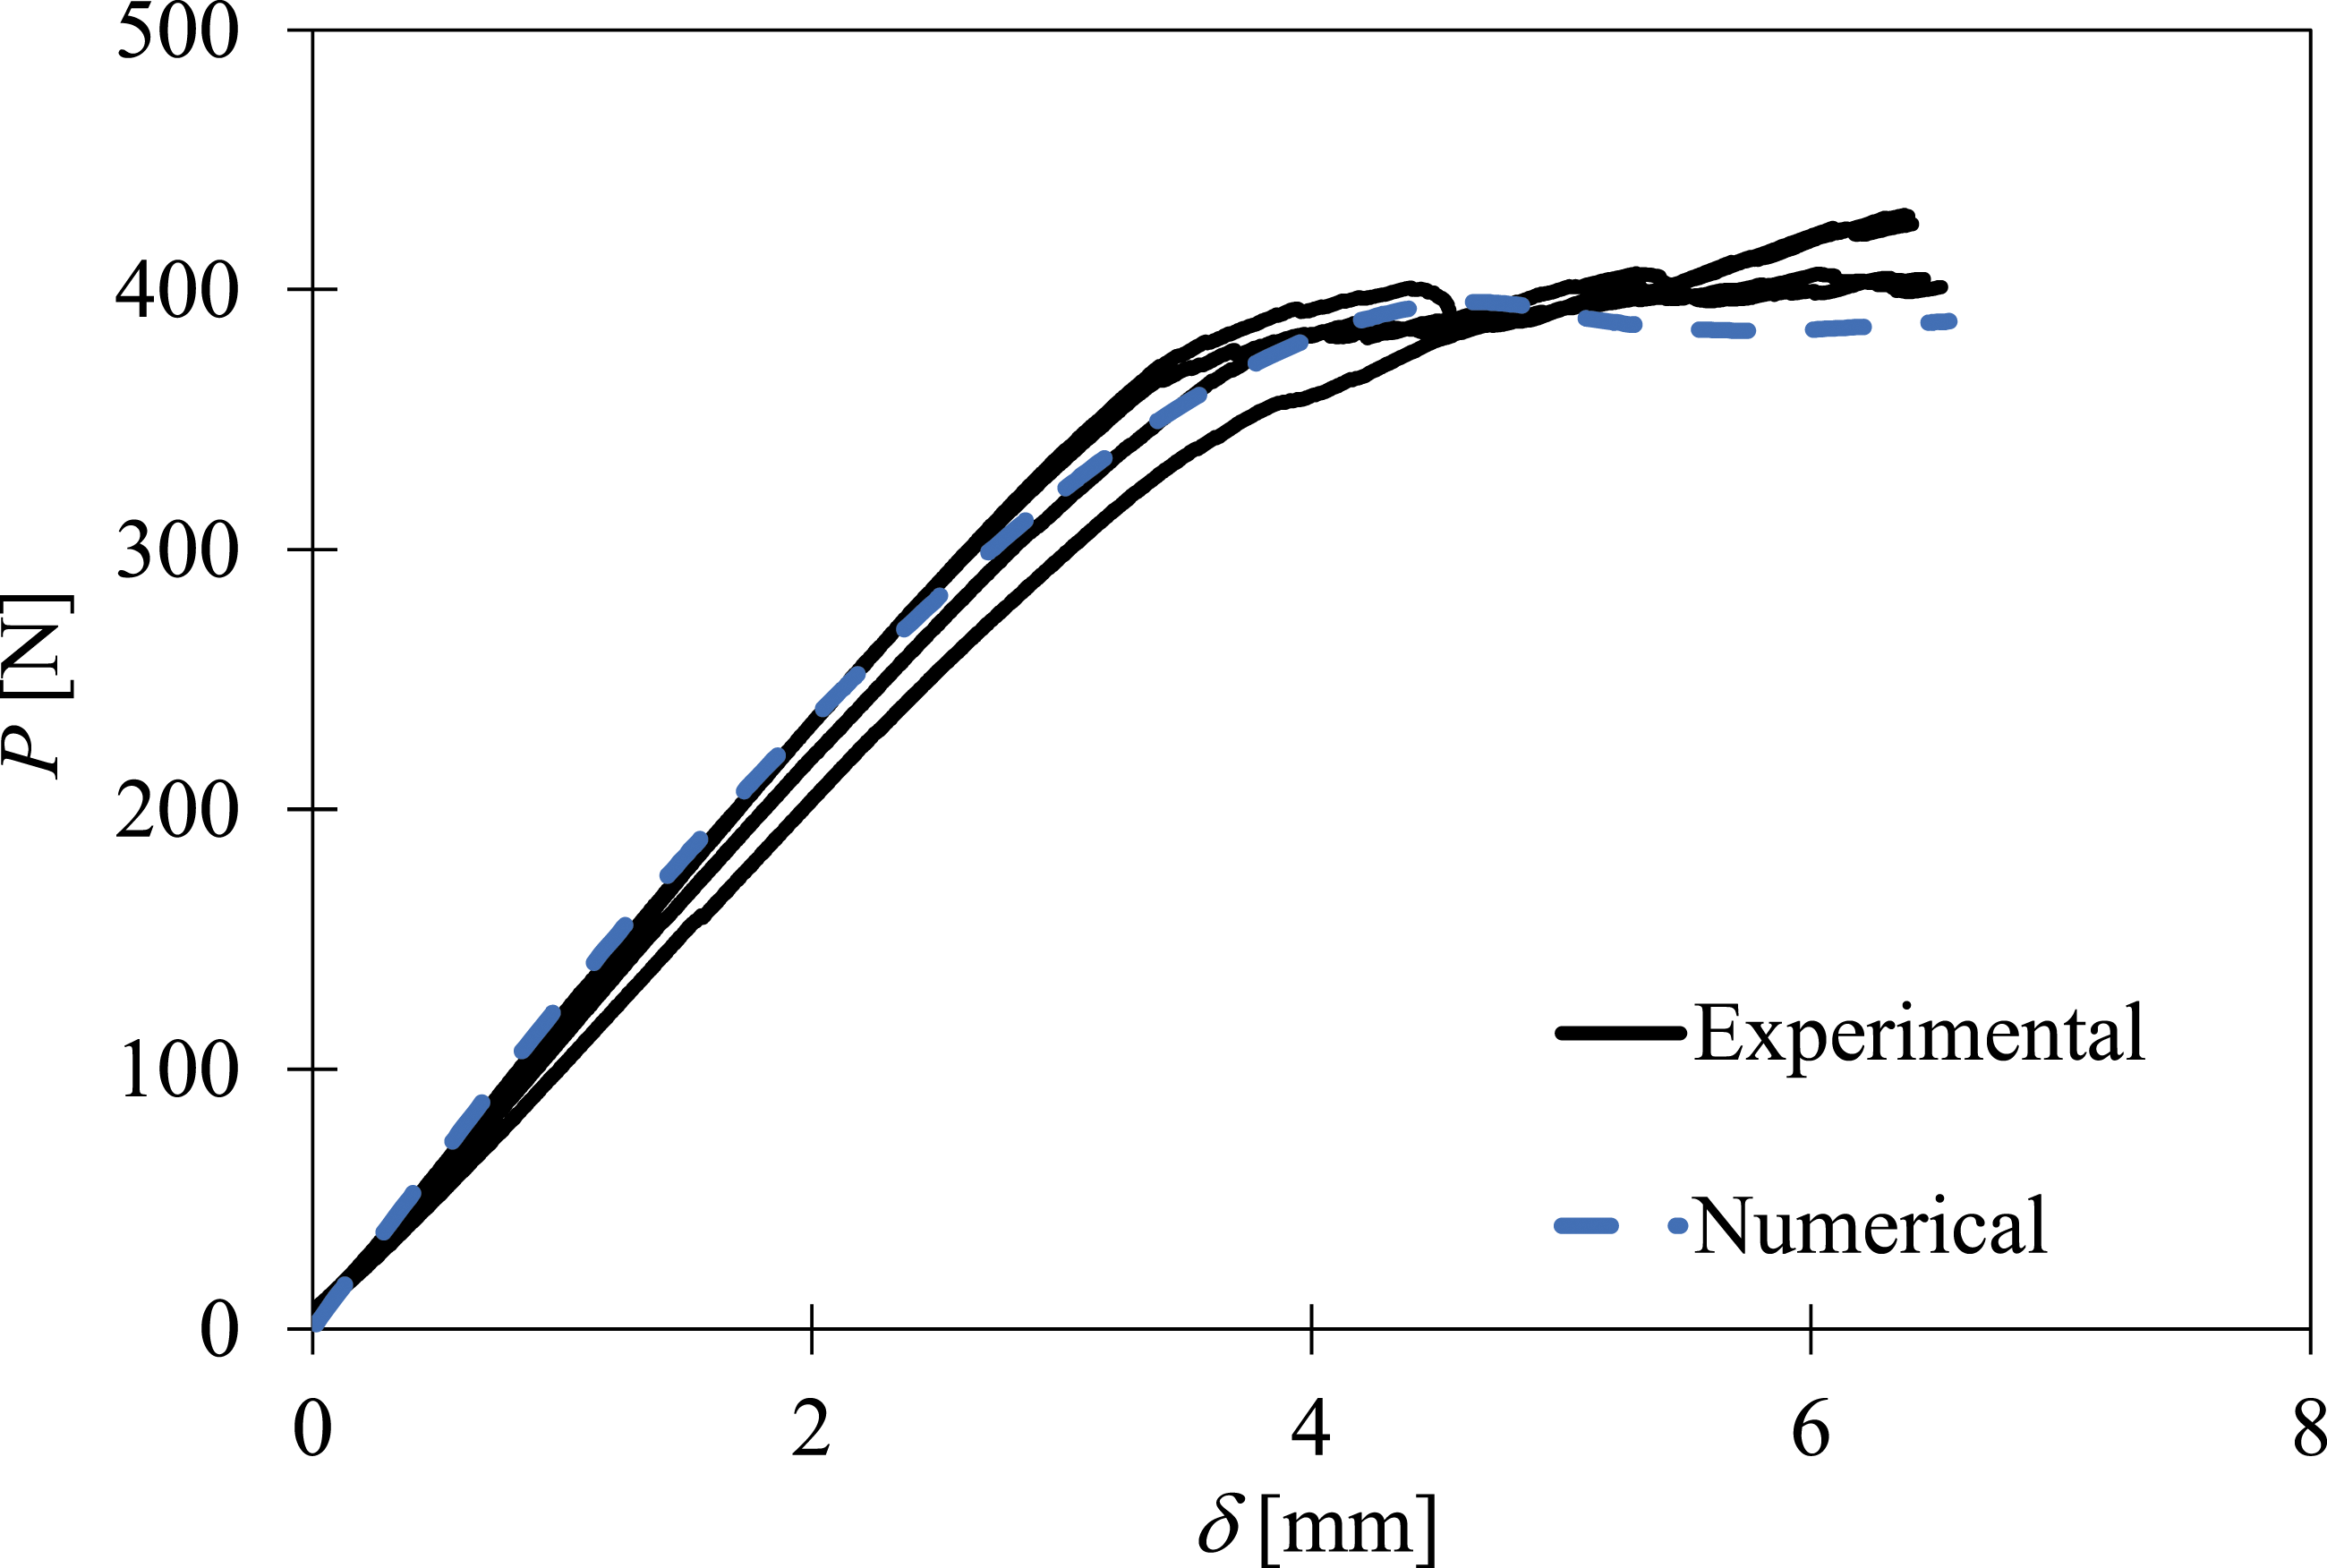
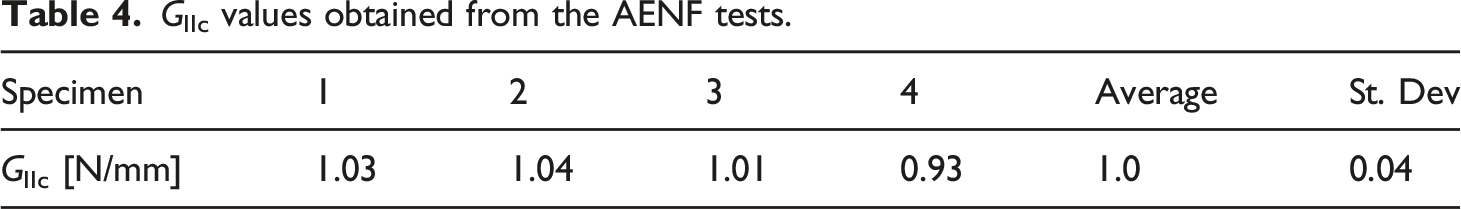
The R-curves were obtained from the P-δ data using the data reduction method described in section 3 and are plotted in Figure 5. These curves are constituted by two main branches. A steep initial part that is characterised by a pronounced increase of energy representative of fracture process zone development until a critical value is attained. Subsequently, the R-curves reveal a smooth upward trend, never presenting a clear plateau revelatory of self-similar crack growth. This circumstance makes it difficult to define the critical fracture energy resulting from these tests. In order to establish a criterion, it was decided to select the fracture energy value corresponding to the beginning of the plateau in the P-δ curves. Coherent values with very low scatter were obtained revealing the consistency of the employed methodology (Table 4). It was observed that an average fracture energy value GIIc=1.0 N/mm is representative of this set of specimens (Figure 6). R-curves of the AENF test. GIIc values obtained from the AENF tests.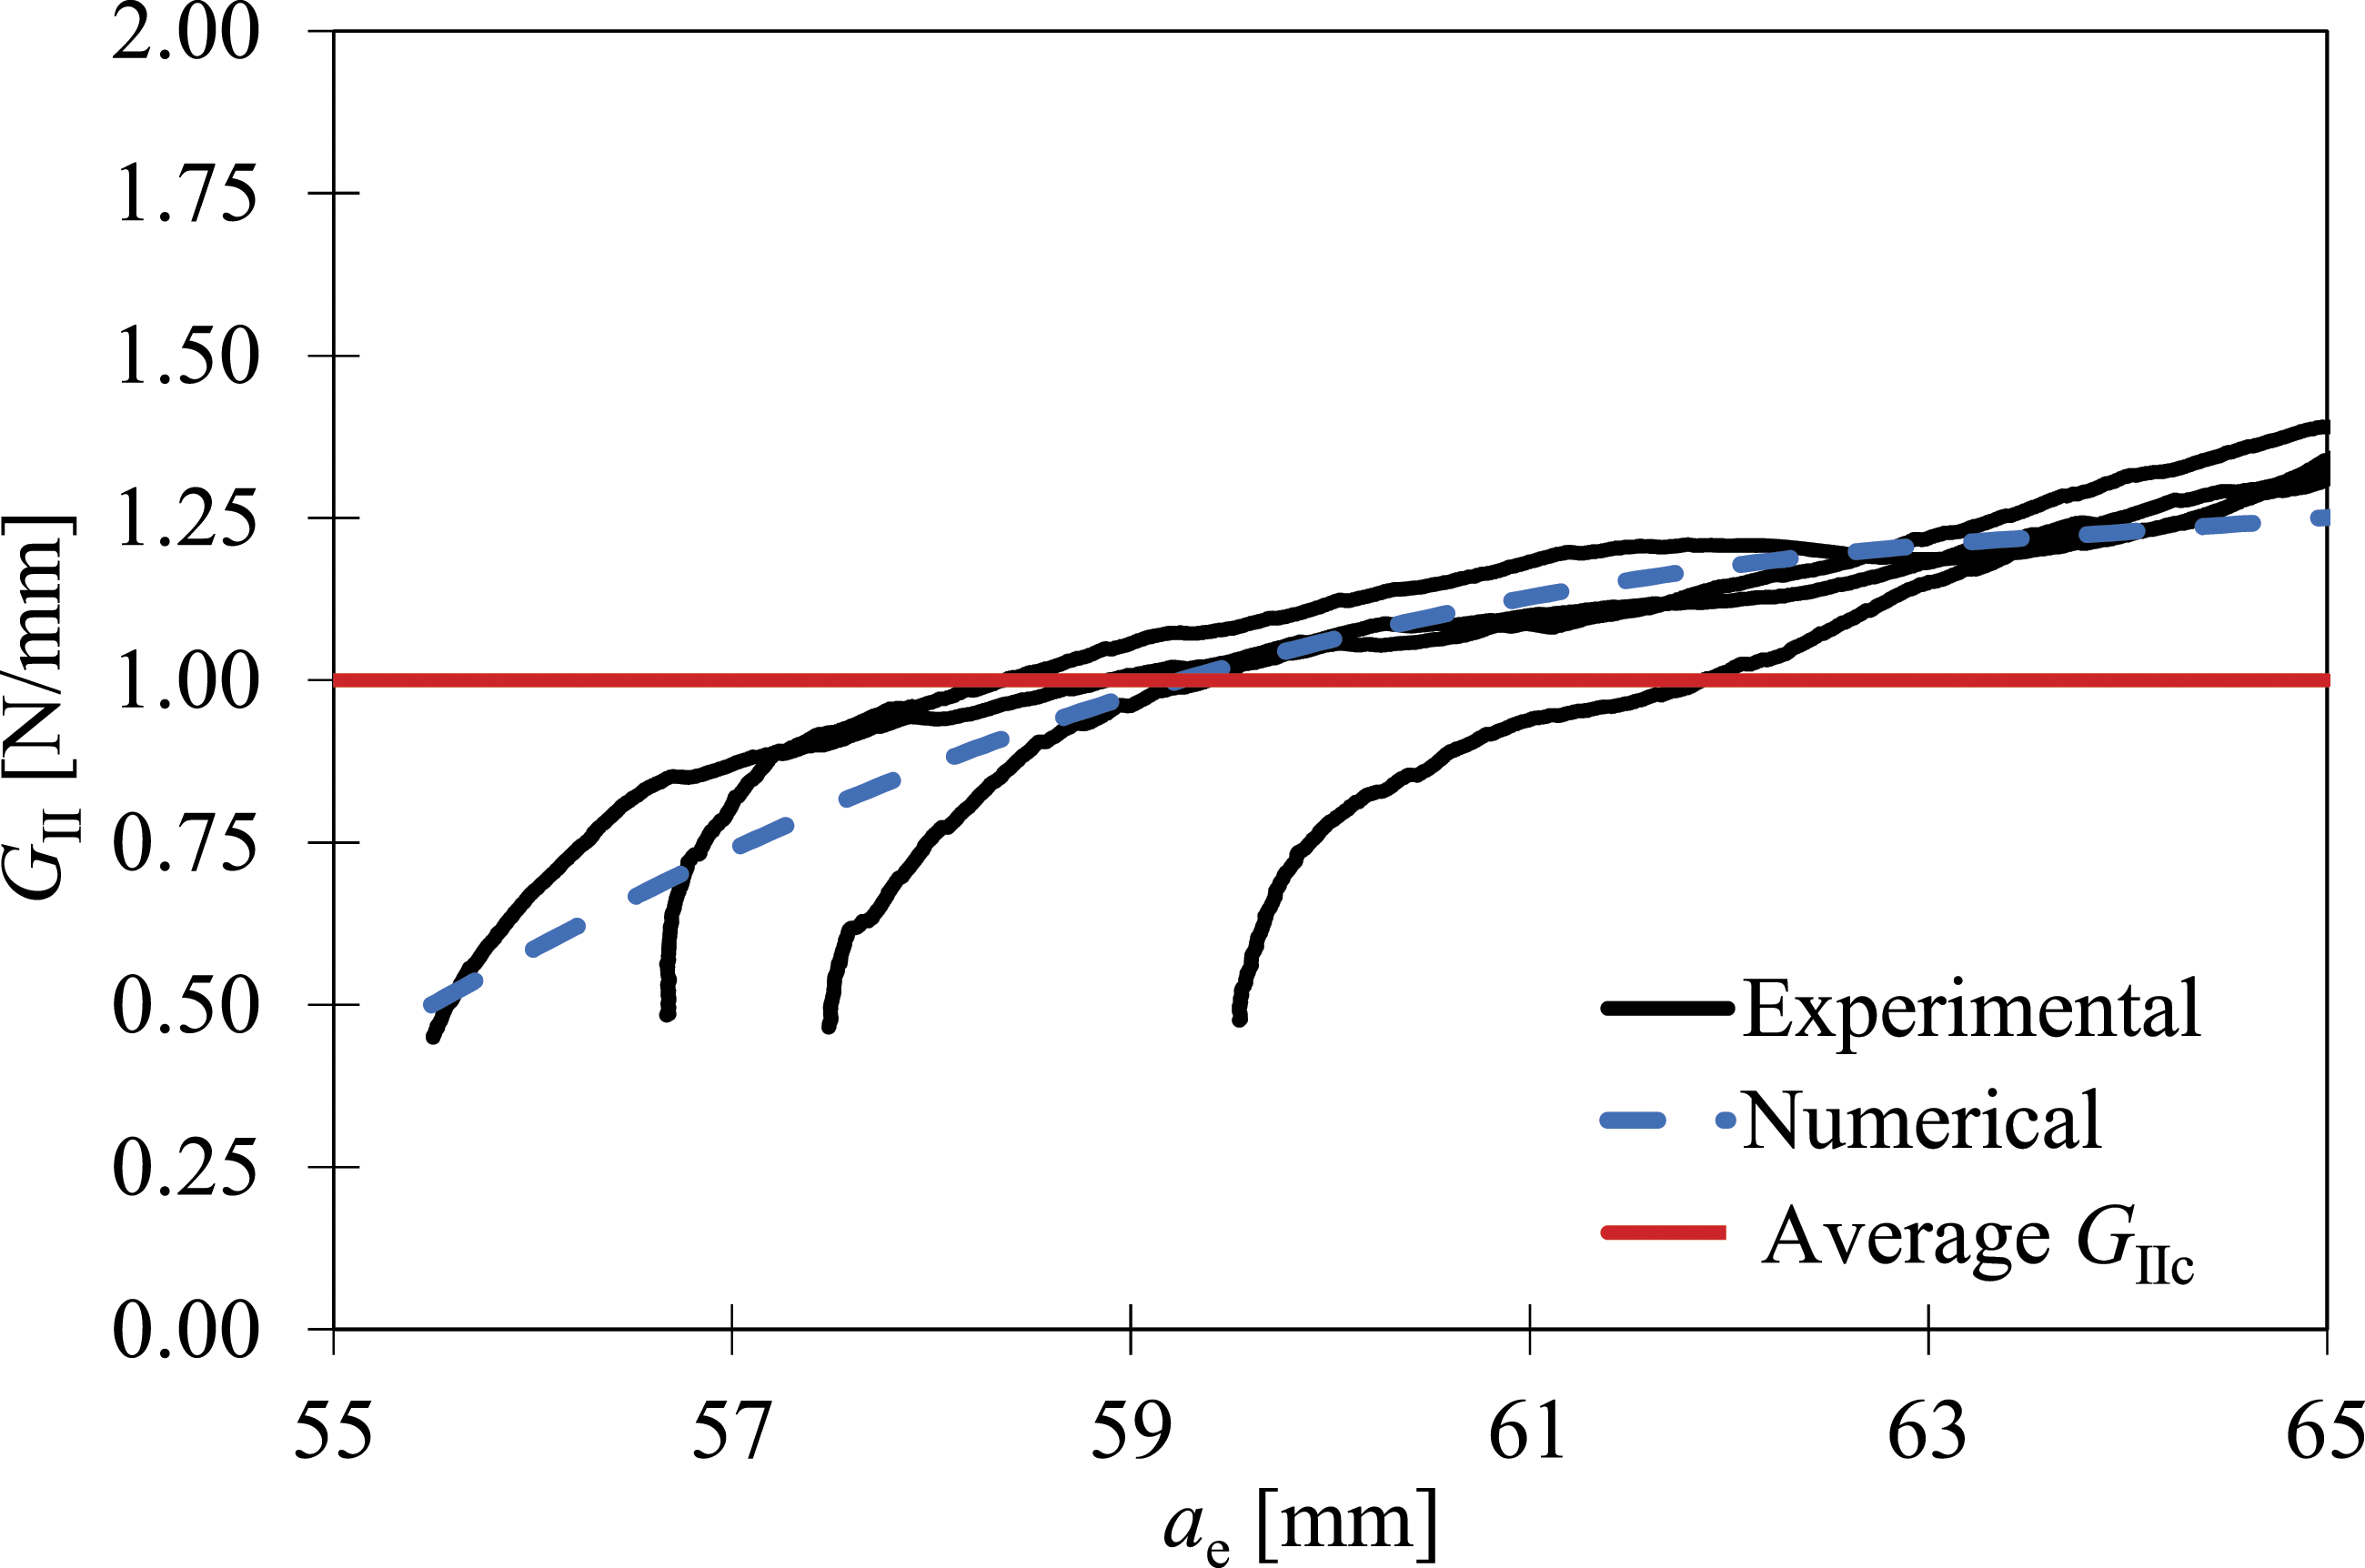
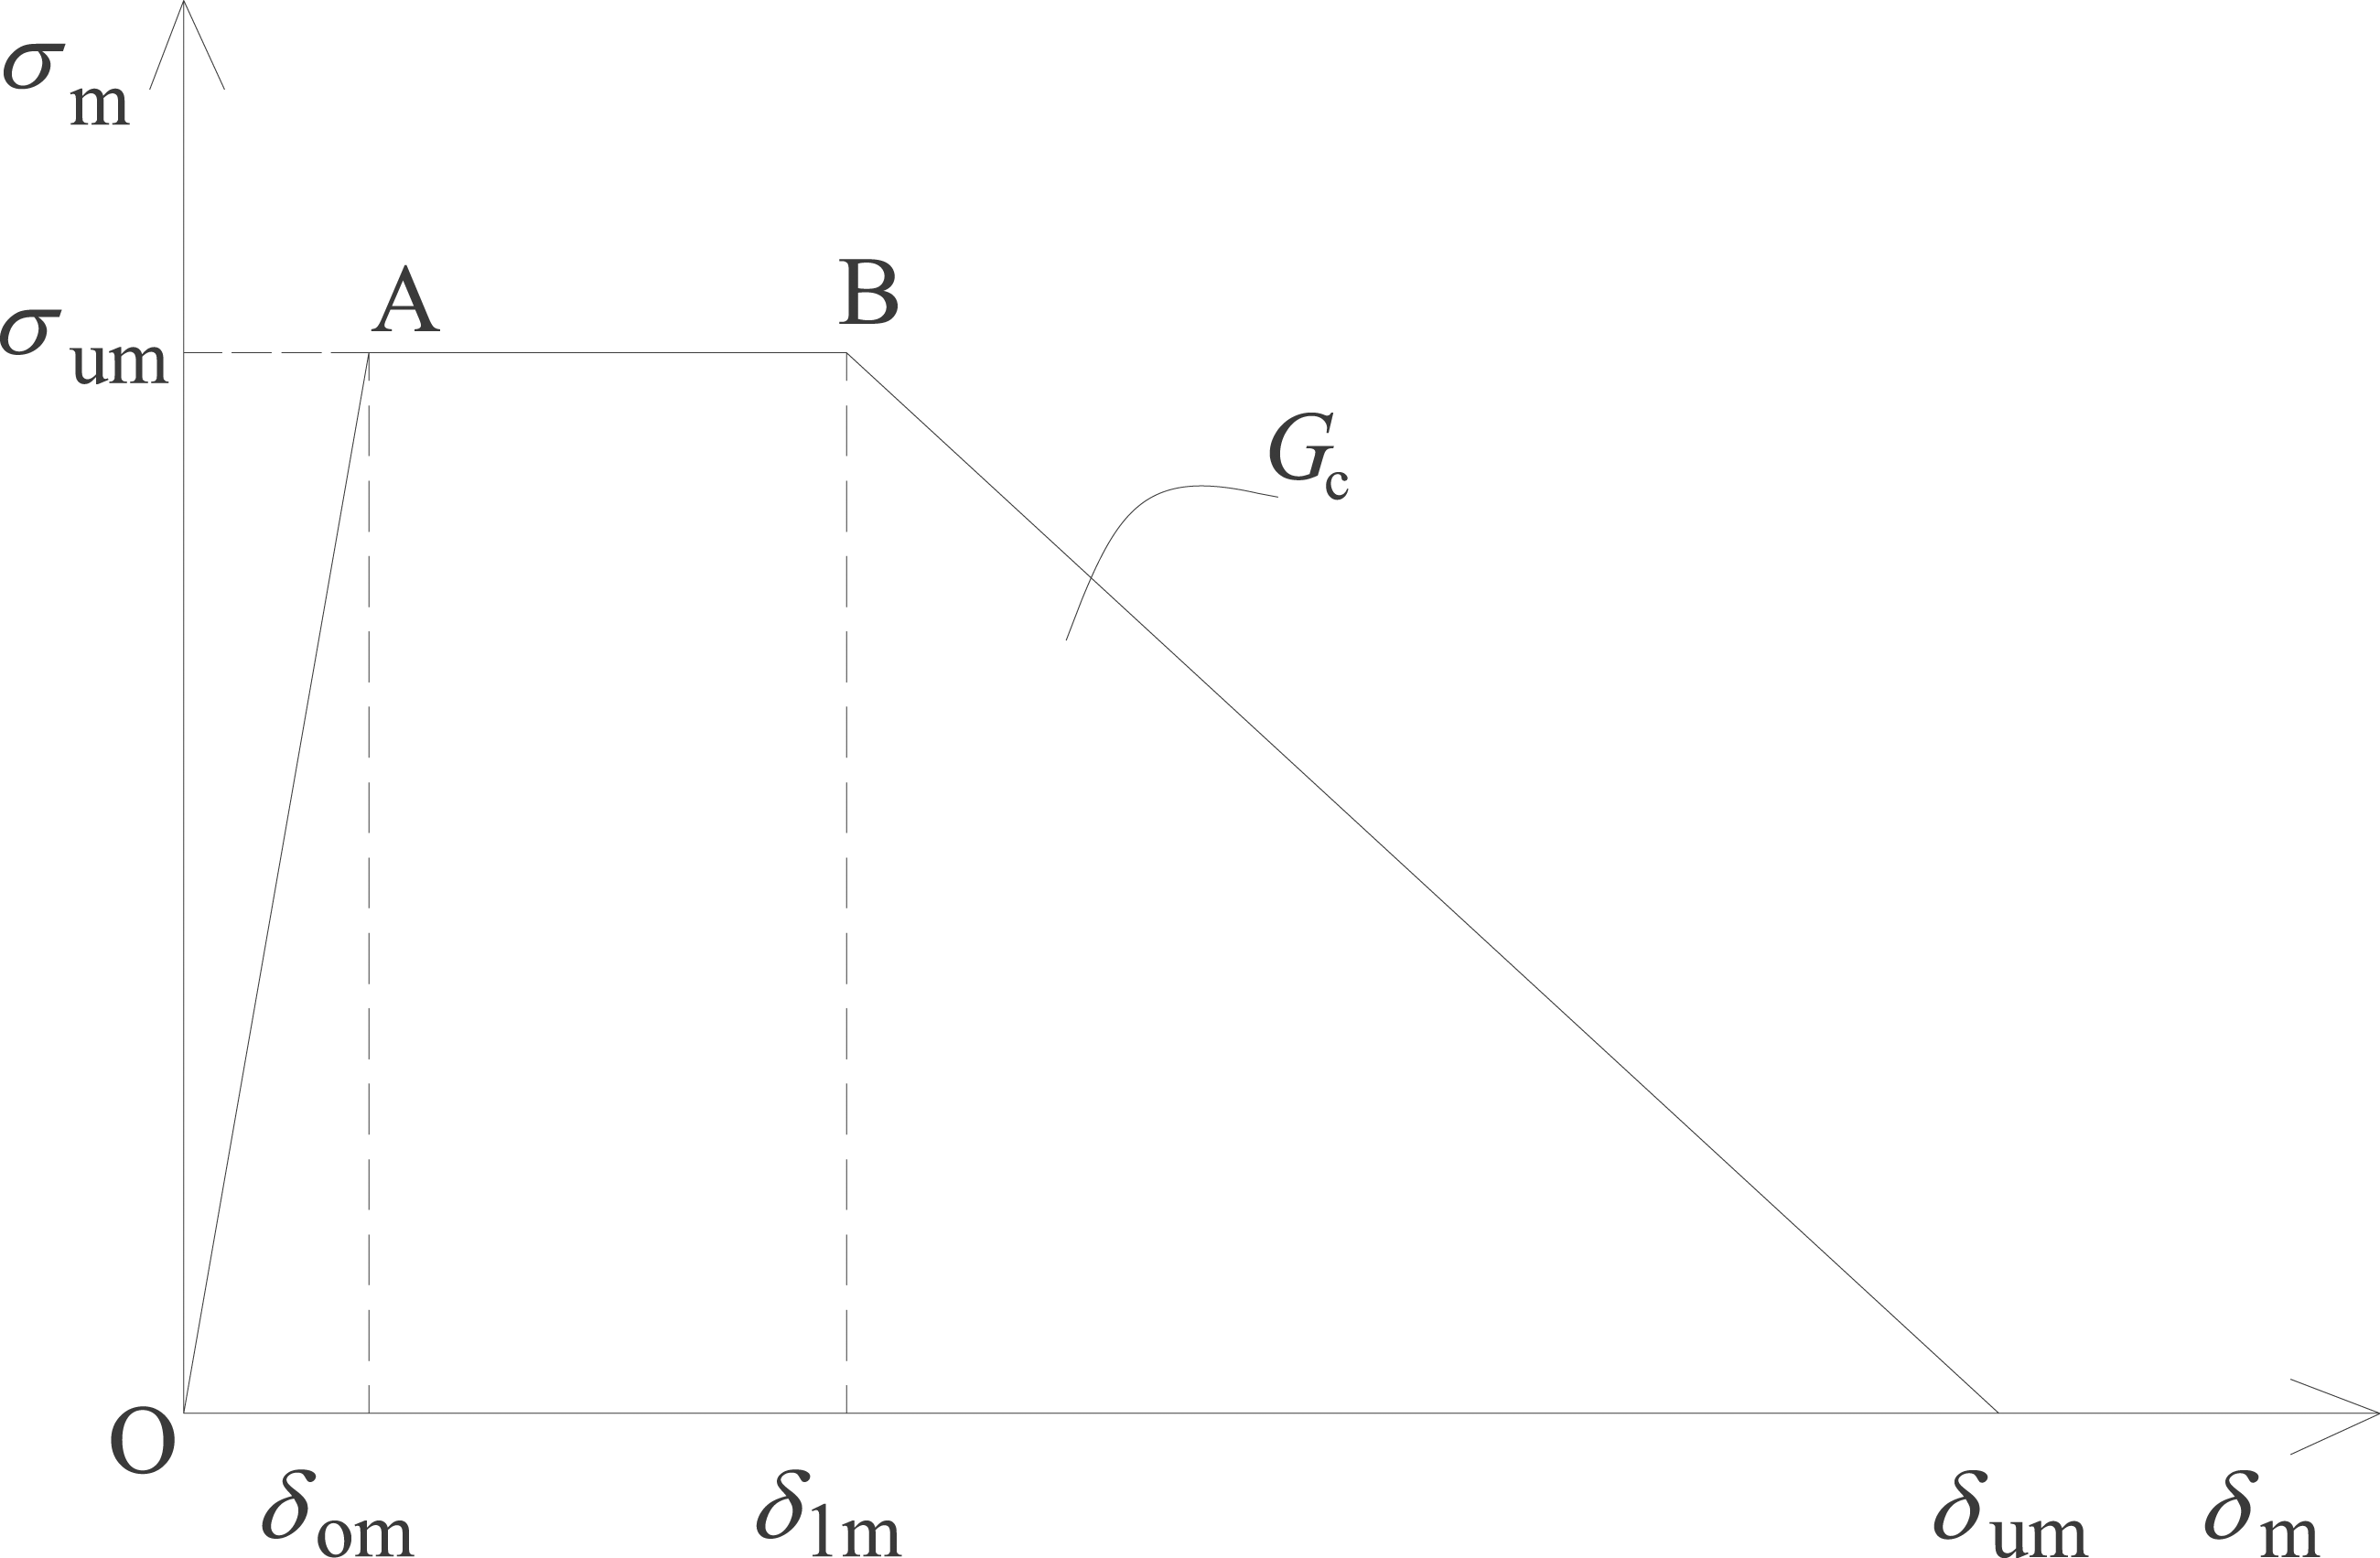
In order to better understand the observed fracture behaviour, a numerical analysis using a mixed-mode I+II cohesive zone model (CZM) was performed. The CZM was implemented in the ABAQUS® software by means of a developed user subroutine. A trapezoidal cohesive law was used (Figure 7) owing to non-linear fracture behaviour observed. The CZM was previously developed14,15 and is based on determination of the energy dissipated on each increment in order to define the evolution of the damage parameter that simulates gradual material degradation. Damage onset is predicted by means of the quadratic stress criterion,
14
while the linear energetic based criterion,
16
Mixed-mode I+II trapezoidal cohesive law; the subscript m identifies mixed-mode I+II loading, σu is the local strength, δo, δ1 and δu are tractions at damage onset, inflection point and failure, respectively.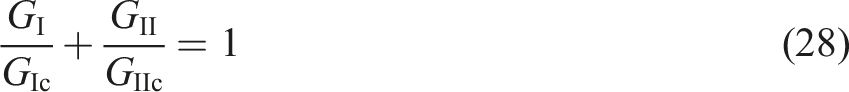
A two-dimensional finite element analysis was performed considering a mesh predominantly refined near crack plane (Figure 8(a)). Plane-strain solid elements with eight nodes were used for specimen arms and compatible zero thickness cohesive elements with six nodes were located at the crack plane. It was observed that damage growth occurs predominantly under shear loading (Figure 8(b)) pointing to a clear predominance of mode II loading in the AENF test. This means that fracture energy GT given by equation (27) and measured in this fracture test is representative of the critical value under mode II loading, GIIc. (a) Mesh used in the AENF test; (b) Detail at the crack tip allowing identifying shear loading effects.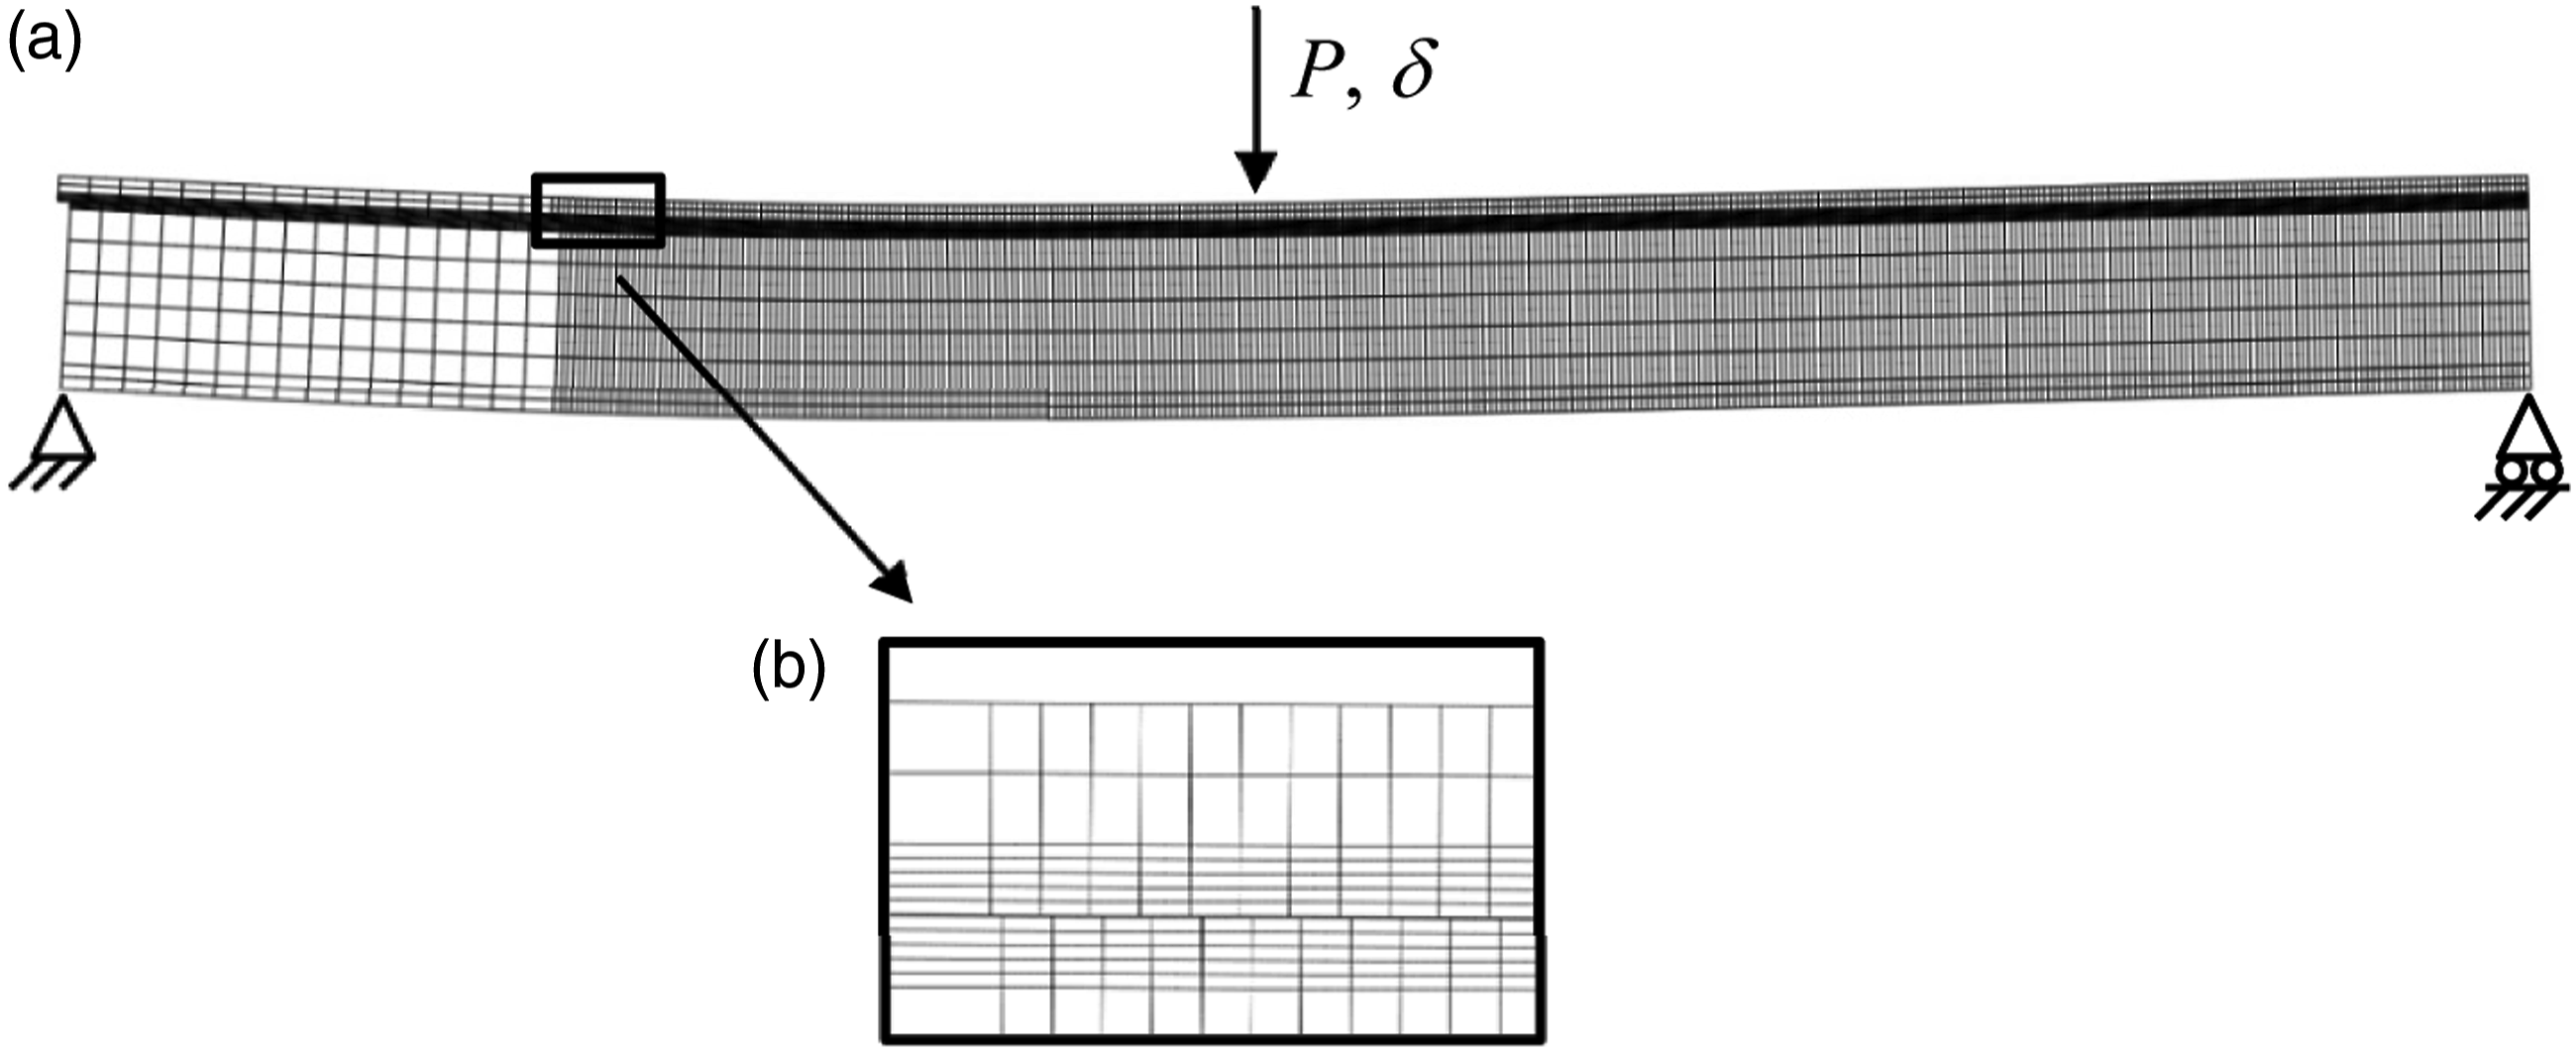
A numerical inverse procedure was followed aiming to reproduce the experimental P-δ curves. Good reproducibility was achieved (Figure 5) with GIIc = 1.0 N/mm, and considering a mode II local strength σuII = 1.5 MPa and relative displacement (δ1,II = 0.3 mm) at the trapezoid inflection point B in Figure 7. It was also observed that the resulting numerical R-curve reflects well the observed trends (Figure 6). In fact, the absence of a clear plateau in the propagating region was also verified in the numerical result. In order to understand this behaviour, the evolution of the cohesive zone length (CZL) during the AENF test simulation was registered in-line with the numerical P-δ curve. From Figure 9, it can be observed that CZL increases up to a peak of 25 mm occurring slightly after the peak load, and decreases after it. This large CZL results from low local strength (σuII = 1.5 MPa) associated with relevant fracture behaviour (GIIc = 1.0 N/mm). In fact, material damage onset occurs for low load levels and an extensive damage zone develops until crack-starting advance takes place. The lack of a plateau value on the CZL = f(δ) relationship reflects the absence of self-similar crack growth for a given extent, which is replicated by crack propagation with constant fracture process zone (FPZ) ahead of its tip. This can be explained by the confinement of the FPZ induced by compressive stresses developing nearby the central loading point. Anyway, the criterion used to identify GIIc proved to be adequate owing to good reproducibility of the experimental P-δ and R-curves observed. Numerical P-δ curve and the corresponding evolution of CZL=f (δ) during the AENF test.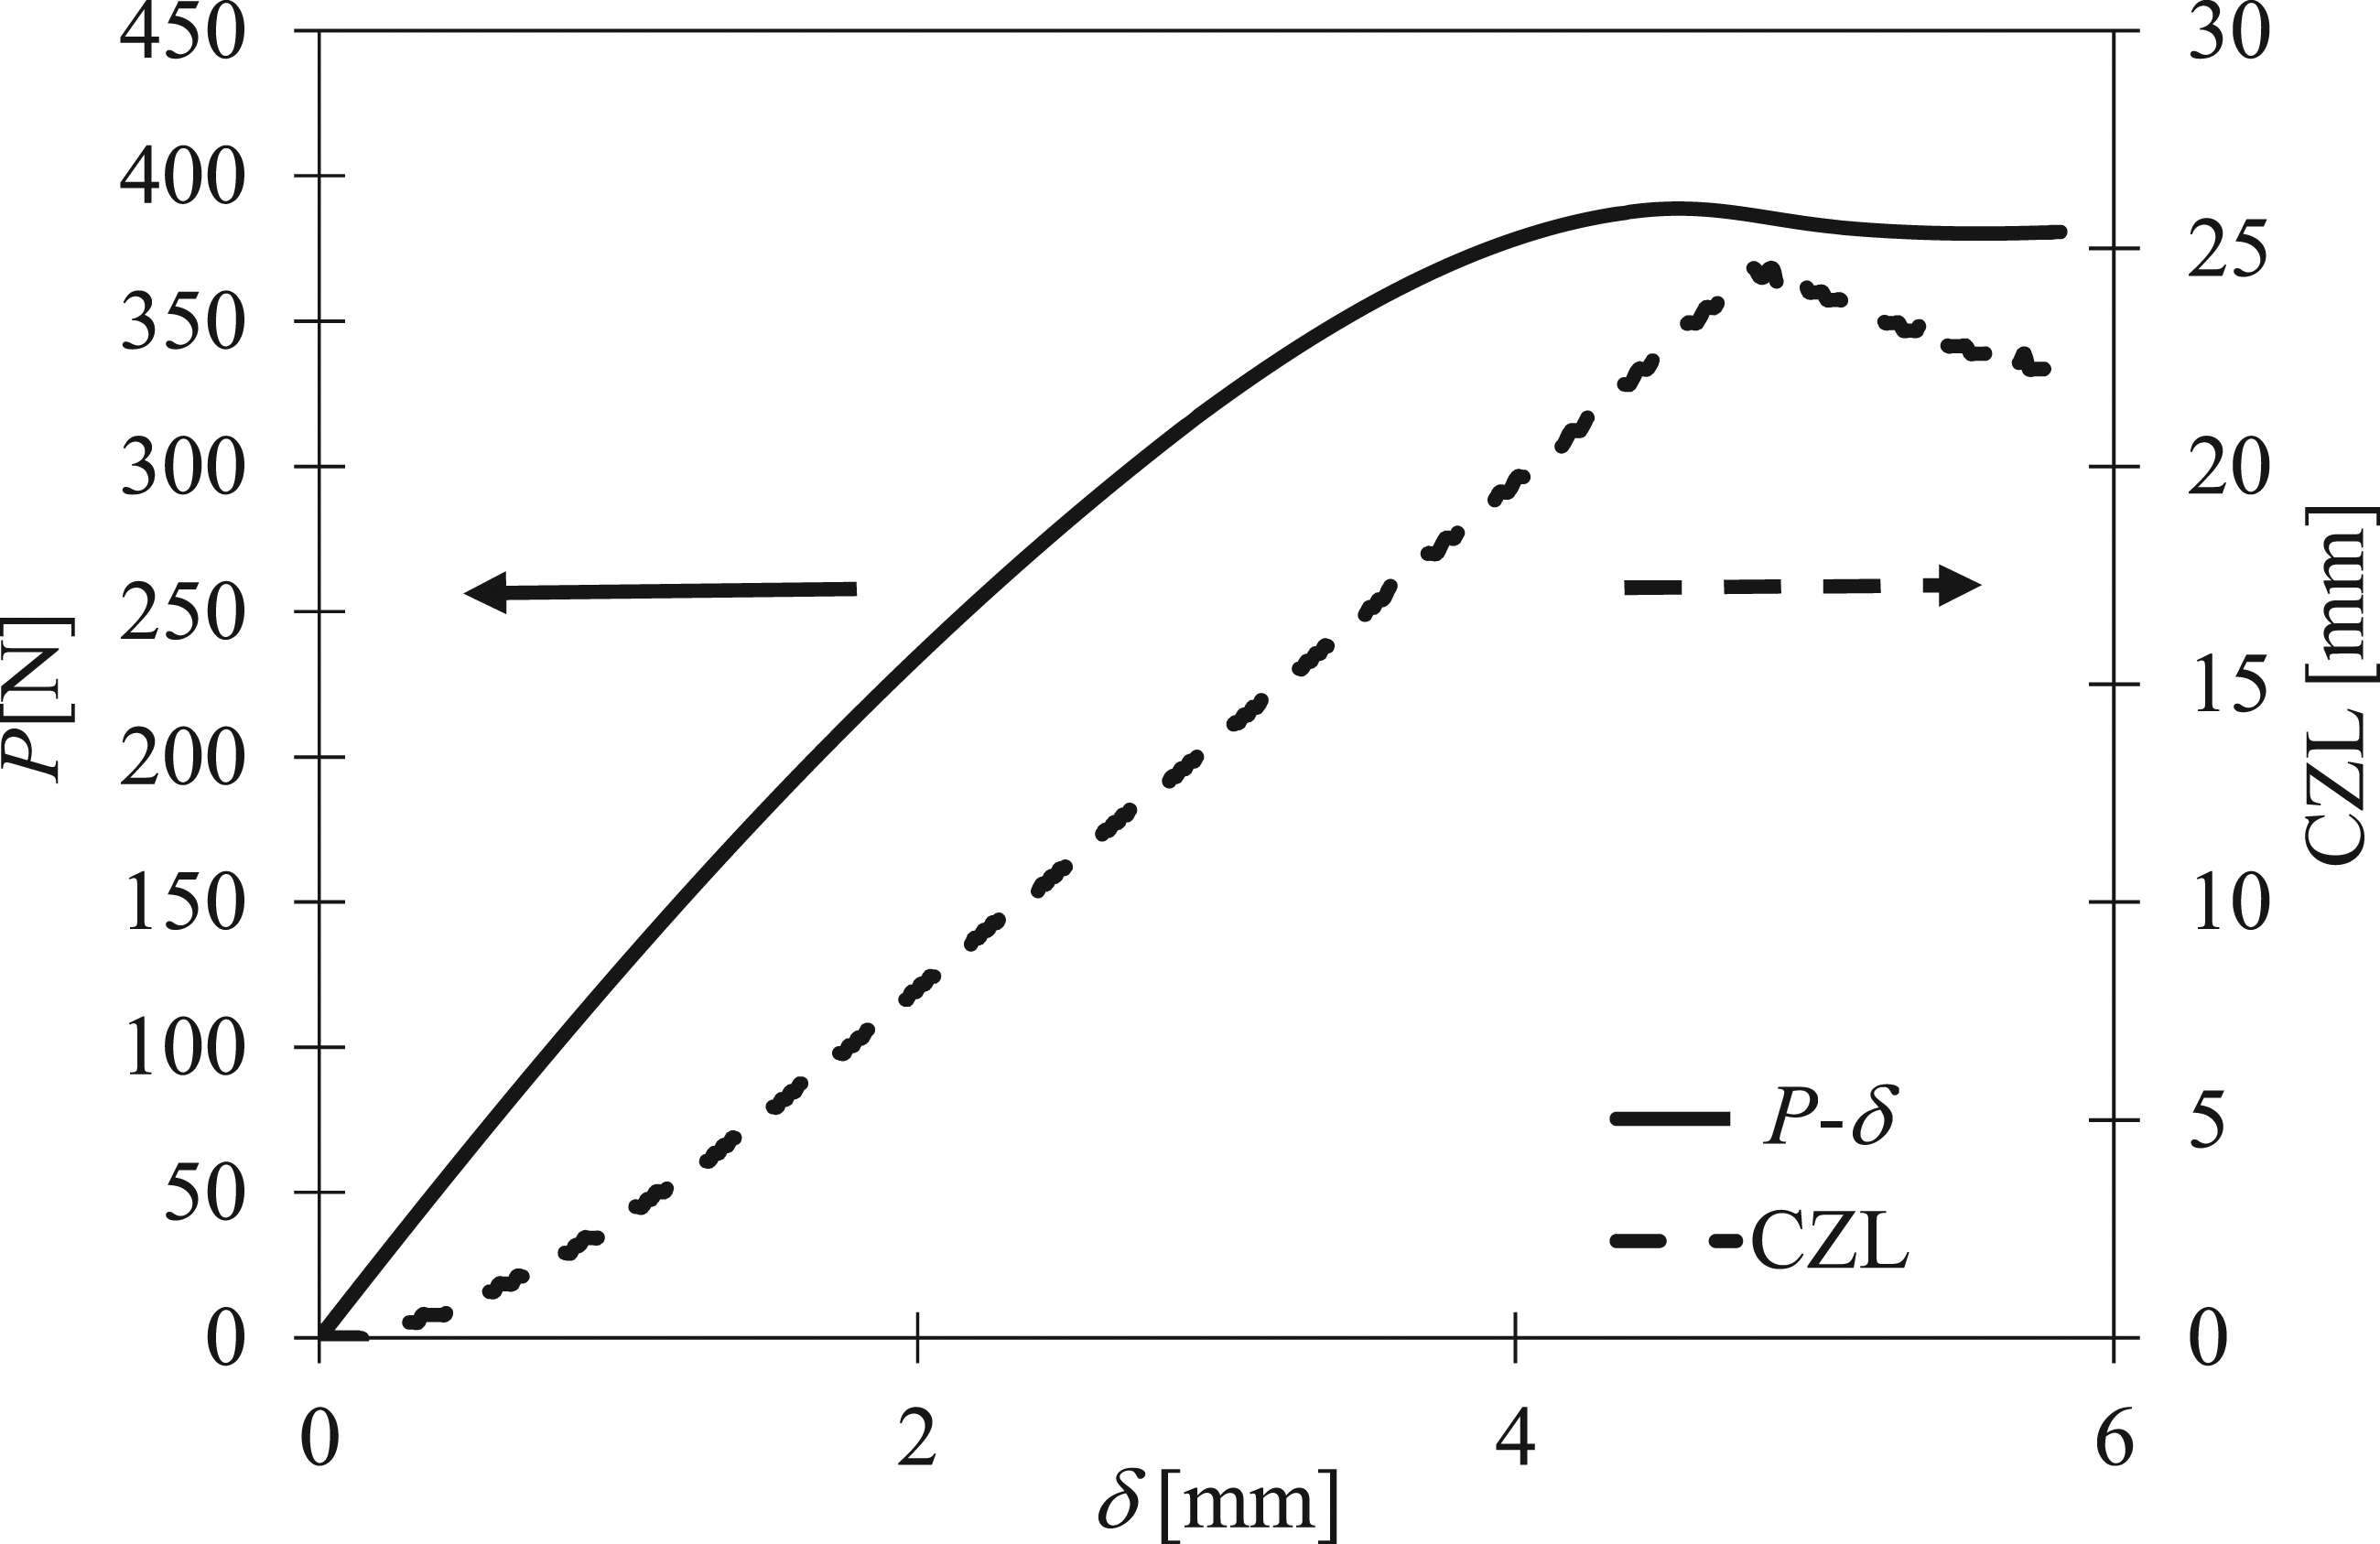
Conclusions
The Asymmetric End-Notched Flexure (AENF) test was employed to obtain the fracture energy of a honeycomb/carbon-epoxy sandwich structure under mode II loading. The experimental load-displacement (P-δ) curves resulting from fracture tests were used as the main data to get the Resistance-curves (R-curves) considering a data reduction method based on Timoshenko beam theory, specimen compliance and equivalent crack length approaches. This procedure avoids the monitoring of the crack length, which is particularly imprecise in shear fracture tests where the crack grows with their faces in close contact. This drawback is further exacerbated by the fact that a non-negligible fracture process zone develops in this case. Despite the R-curves do not reveal a plateau, an average mode II fracture energy was estimated from the experimental results considering the value corresponding to the beginning of the plateau on the P-δ curves.
A numerical analysis including a mixed-mode I+II trapezoidal cohesive zone model was used for the sake of validation of the followed procedures. Good reproducibility of the P-δ curves and R-curves was achieved, which confirms the validity and adequacy of the AENF test to determine the fracture energy in sandwich panels under mode II loading.
Footnotes
Acknowledgements
The authors acknowledge the “Fundo Europeu de Desenvolvimento Regional (FEDER)” for the financial support through the project “Soluções avançadas para materiais de impacto, reparação de aeroestruturas em compósito e sua monitorização” (MOSHO) NORTE-01-0247-FEDER-033796.
Declaration of conflicting interests
The author(s) declared no potential conflicts of interest with respect to the research, authorship, and/or publication of this article.
Funding
The author(s) disclosed receipt of the following financial support for the research, authorship, and/or publication of this article: This work was supported by the “Fundo Europeu de Desenvolvimento Regional (FEDER)” for the financial support through the project “Soluções avançadas para materiais de impacto, reparação de aeroestruturas em compósito e sua monitorização” (MOSHO) NORTE-01-0247-FEDER-033796.
Appendix