
Abstract
Composite sandwich materials provide high bending performance-to-weight ratios. However, these materials are vulnerable to impact damages which can drastically reduce their load-bearing capability. Presently there is a lack of standardised test methods for impact assessment. This study compares three different test methods for impact assessment; single skin compression after impact (CAI-SS), sandwich compression after impact (CAI-SW) and four-point bending-after-impact (BAI). The CAI-SS test method shows high compressive strength and strain at failure and the tesr is relatively easy to evaluate. For finite size plates with significant impact damage, the CAI-SS test method is recommended for post impact strength assessment. For large sandwich panels with relatively small impact damages the CAI-SW test method could be more relevant since it includes effects of panel asymmetry generated from the impact damage. The BAI test method may be recommended as an alternative to CAI but quite long specimens are required in order to assure compressive failure in the tested face-sheet, making the test both demanding and expensive. On the other hand, lower load levels are required to break the specimens and there is less need for precise machining during specimen manufacturing. A finite element model including progressive damage evolution was used to estimate the post impact strength. The simulations showed generally good agreement with the experiments.
Keywords
Introduction
Sandwich structures are widely employed as lightweight solutions in e.g. aerospace, automotive, marine and civil engineering applications. Such structures employ stiff, strong face-sheets bonded to low-density core material, since inserting a light and relatively weak core between the two stiff, strong composite face-sheets provides high flexural stiffness and strength at relatively low weight [1]. However, composite sandwich structures are susceptible to low-velocity impact damages such as runway debris or tool drops during service. Impact energy is typically dissipated in the form of fibre/matrix damage, delamination between plies, core crushing or face-sheet de-bonding [2–4]. This leads to a reduction of strength and thus the damage tolerance of the sandwich material needs to be taken into account in the design of the structure [5].
Damage tolerance is the ability of a damaged structure to withstand load, either for immediate safe abortion of a mission or to ensure continued safe operation until upcoming maintenance. While assessing the compression after impact (CAI) strength of sandwich structures, Nettles [6] found that normalizing the impact energy with the face-sheet thickness provide reasonable comparison of CAI strength results. James et al. [7] studied the effect of asymmetry, i.e. different face thicknesses, on the residual strength of composite sandwich panels. They found that impacted asymmetric specimens showed improved residual strength compared to symmetric specimens.
Significant developments have been made on damage tolerance test methodology for laminated composites. However, there is still no standardised test method for composite sandwich materials and little work can be found in this area. Although there is a specific ASTM test standard for damage resistance testing of sandwich composites [8], the extension of the test method towards damage tolerance assessment is still lacking. At present most sandwich CAI testing follows the same technique as that for laminated composites, i.e. using edge-wise compression of the complete sandwich cross-section. Using this method, there is a risk for scatter in data due to uneven load introduction. Precise machining of the specimens is crucial but still not always sufficient to ensure even load introduction. Another concern with edge-wise compression of sandwich specimens is that part of the load is carried by the intact face-sheets and reliable measurements of the residual strength of the impacted face-sheets are thus hard to extract. One possible test method for post impact compressive testing is to use a four-point bending (4PB) configuration. Such a setup does not require precise machining and failure can be achieved at lower loads, although larger test specimens are required. Nettles et al. [9] compared the CAI strength of an impacted sandwich using both 4PB and traditional edge-wise compression test methods. They concluded that the 4PB test method is a feasible alternative to edge-wise compression.
Little work can be found that brings understanding to the damage tolerance of foam-based sandwich materials with different face-sheet thicknesses. In addition, there is a lack of work on the evaluation of test methods for damage tolerance assessment. In this study, a detailed evaluation of methods for damage tolerance testing was conducted using three different test methods: edge-wise compression of the complete sandwich cross-section, edge-wise compression of the impacted face-sheet alone and 4PB after impact. Both symmetric and asymmetric sandwich configurations were studied, and comparisons made between the results from the different test methods. In addition, the effect of face-sheet thickness on the damage tolerance was also assessed. A progressive damage finite element (FE) model including damage after impact was used to simulate the compression response after impact.
Experimental methodology
Material system and specimen configurations
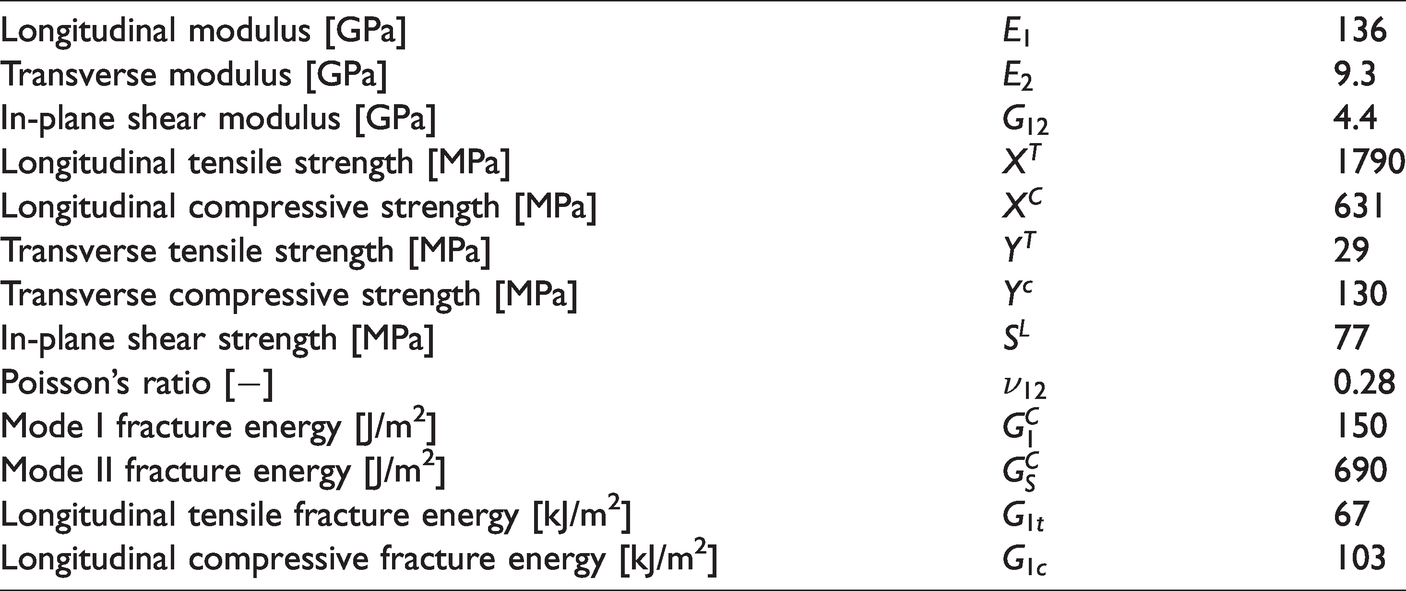
In this study, flat composite sandwich specimens with five different cross-sections were examined. The thickness of the core material was kept constant for all configurations while the face-sheet thicknesses were altered. A uni-weave carbon fibre non-crimp fabric (NCF), Porcher, HTS45 E23 Tenax®, with a density of 205 g/m2 was used in the face-sheets together with a Huntsman Araldite LY556/Aradur HY917 epoxy. The aerospace grade Polymethacrylimide (PMI) closed cell foam Rocacell 200 Hero, supplied by Evonic AG, was used as core material. Each face-sheet consisted of a quasi-isotropic lay-up with a [0/45/90/-45] n stacking sequence, where n drives the thickness of the face-sheet. The material properties of both the NCF composite face sheet and foam material are presented in Tables 1 and 2 and are taken from [4,10].
Material properties of NCF composite face-sheets [10].
Material properties of Rohacell 200 Hero core material.
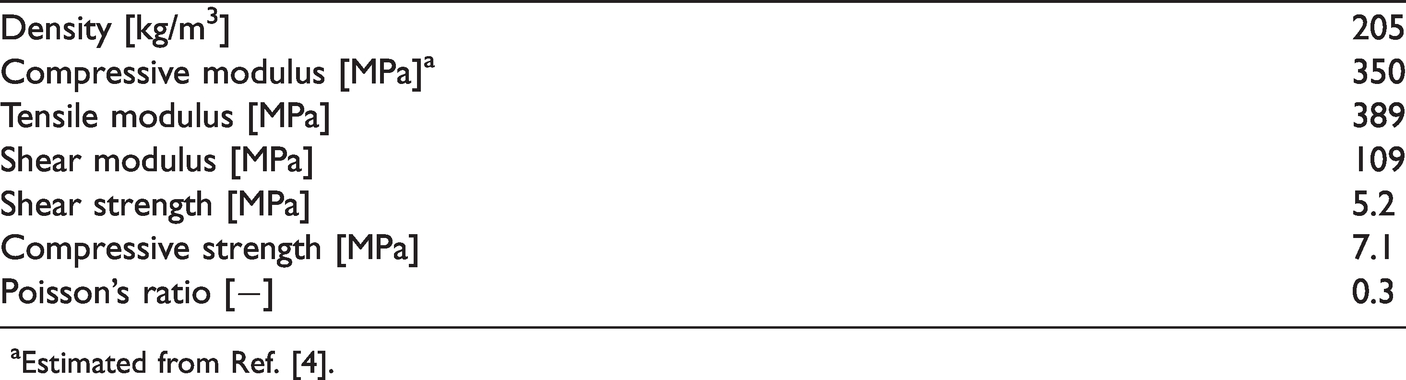
aEstimated from Ref. [4].
Sandwich plates, 900 mm by 420 mm, were manufactured by infusing the epoxy resin using a vacuum-assisted process. Due to the high viscosity of the epoxy and considering the size of the sandwich plate, the resin was first pre-heated to 40 °C for 30 minutes and then infused into the reinforcement to obtain a homogeneous, uniform distribution over the sandwich plate. The infusion was carried out in a controlled environment where the temperature was kept at 40 °C during infusion and then increased to 80 °C for 7 hours after infusion in order to cure the resin. A subsequent post-curing was performed at 120 °C for another 8 hours. Figure 1 shows one of the vacuum-infused sandwich plates inside the oven (left) and the finished plate after post-curing (right). The fibre volume fraction achieved was about 55% which gave final face-sheet thicknesses of 1.6, 2.4 and 3.1 mm for 16, 24 and 32 plies, respectively. As aforementioned the core thickness was kept constant, 9 mm, for all sandwich configurations which are further detailed in Table 3. The sandwich plates were cut into specimens that were first subjected to low velocity impact and then assessed in damage tolerance tests.
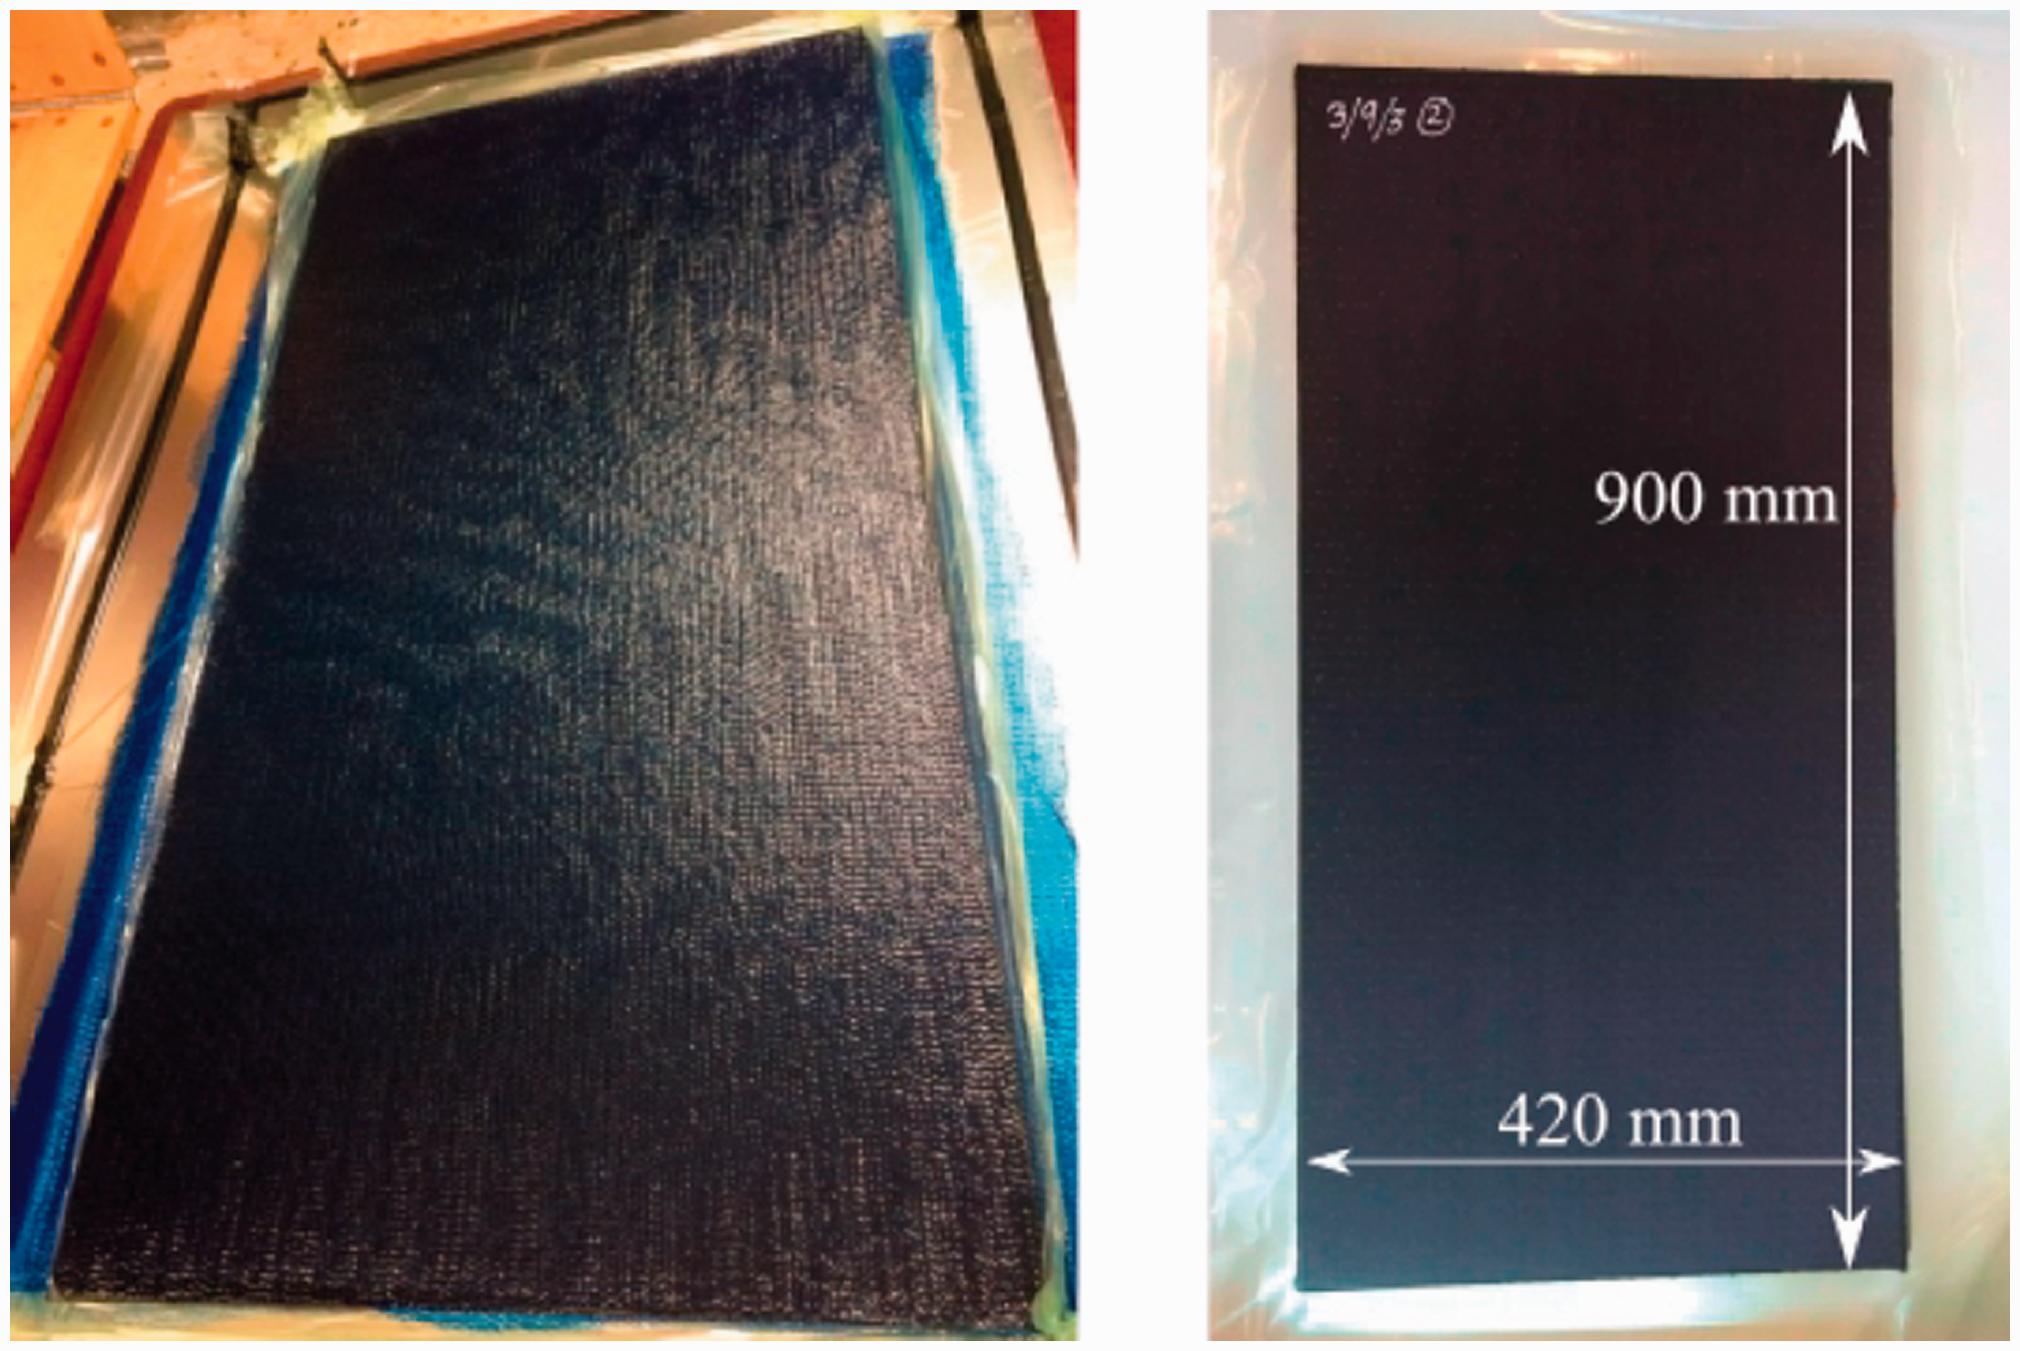
Sandwich plate during vacuum infusion (left) and finished plate after post-curing (right).
Plate configurations.
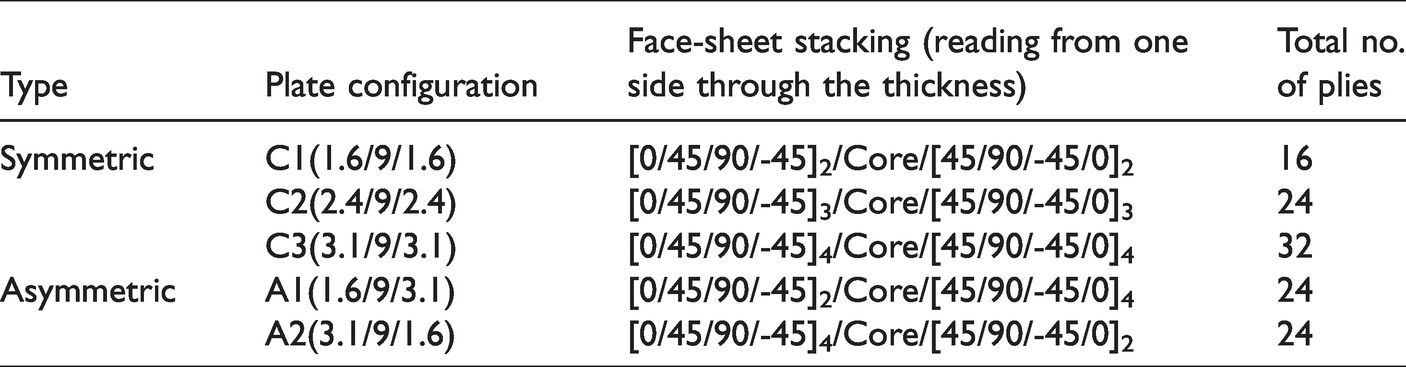
The abbreviation for each plate configuration refers to the thickness of the sandwich constituents; 1st face-sheet, core and 2nd face-sheet. The first three plate configurations, C1(1.6/9/1.6), C2(2.4/9/2.4) and C3(3.1/9/3.1) were made symmetric with 1.6, 2.4 and 3.1 mm face-sheet thicknesses, respectively. The other two plate configurations A1(1.6/9/3.1) and A2(3.1/9/1.6) were made asymmetric with different face-sheet thicknesses on the two opposing sides of the plate. Since the two asymmetric plates were impacted on different sides they are considered as different configurations, although they were geometrically equal. This will be further discussed in the following section. It should be noted that all face-sheets in the study were asymmetric with respect to their local through-thickness direction.
A smaller piece of the finished plate was cut, polished and inspected in a light microscope for possible presence of voids or dry spots, in order to ensure the quality of the plate [11]. All the manufactured plates were cut down using a diamond blade saw, to a standard size of 150 mm × 100 mm for the CAI tests, and to 450 mm × 100 mm for the BAI tests.
Low-velocity impact testing
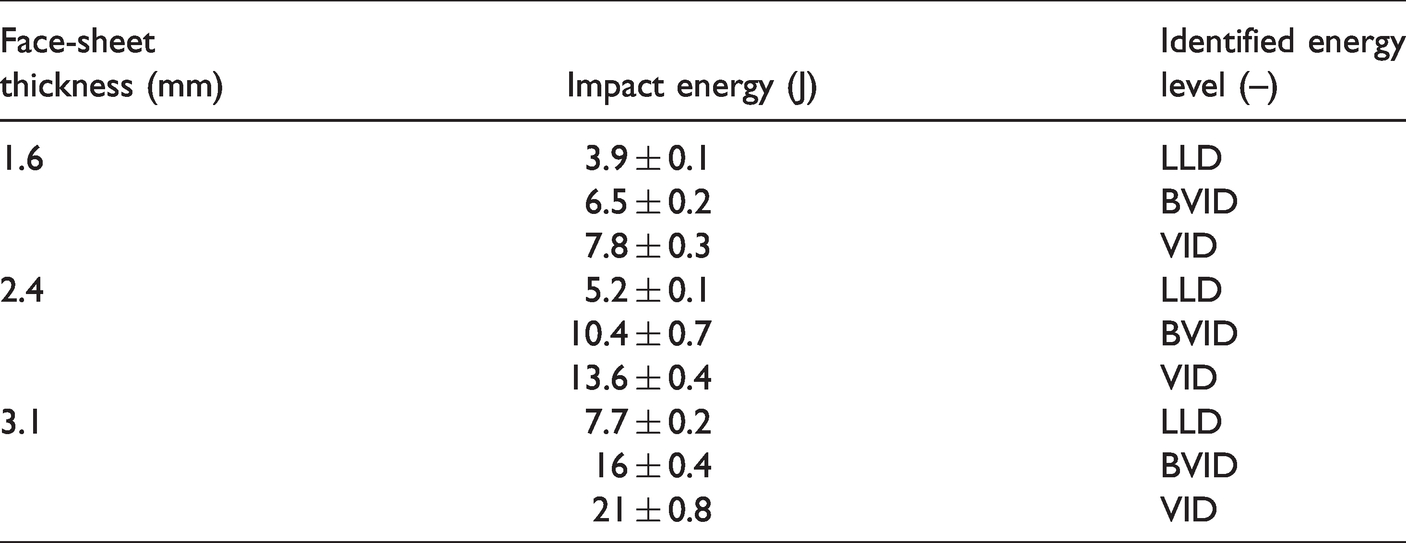
An extensive experimental characterisation of NCF-based composite sandwich material subjected to low-velocity impact was performed by the authors in a separate study [11], including the identification of low level impact damage (LLD), barely visible impact damage (BVID) and visible impact damage (VID). In order to comply with aircraft airworthiness requirements, an aircraft component must be damage tolerant even with BVID or VID impact damage [12,13]. In aerospace applications, BVID impact damage is equivalent to the impact energy of e.g., a tool drop during servicing of an aircraft component, or impact of runway debris during landing or take-off. According to the ISO standard [14] a permanent dent of 0.3 mm depth defines BVID damage. For the current study VID damage defined by twice the depth, i.e. 0.6 mm, and LLD damage defined by half of the BVID dent, i.e. 0.15 mm, are also considered [11]. The identified impact energy levels for the three face-sheet thicknesses are presented in Table 4. All impact testing was performed in a novel, state-of-the-art, patented instrumented impact testing apparatus designed in-house [15], which was able to successfully capture the true impact response, virtually without adulteration by mechanical noise or low frequency oscillations from the test rig [16].
Identified impact energy levels from low-velocity impact testing of NCF-based composite sandwich specimens [11].
In the present study, additional impact tests were performed on the asymmetric plates, i.e. A1 and A2, as they were not covered in the previous study [11]. For the A1 plate, a low-velocity impact event corresponding to BVID energy level was performed on the thin (1.6 mm) face-sheet, whereas for the A2 plate a BVID impact event was performed on the thickest (3.1 mm) face-sheet. This addition to the study was incorporated in order to examine the effect of symmetry on the residual strength of the sandwich specimens after impact.
Damage tolerance testing
A thorough experimental campaign was conducted for the damage tolerance assessment of impacted sandwich specimens. Specimens with three different face-sheet thicknesses were impacted and their damage tolerance was assessed with three different test methods. The aim was to separate out the effect of face-sheet thickness from that of specimen asymmetry that comes with different face-sheets being used on the same specimen. Since three different test methods were used, they could also to a certain extent be compared and validated.
Compression-after-impact of sandwich specimens
In this study two types of CAI test setups were used. The first called CAI-sandwich (CAI-SW) is commonly used in damage tolerance research studies, e.g. [5,7,17,18]. In the CAI-SW experiment quasi-static, uniform, in-plane displacement is applied on the complete cross-section of the sandwich specimen, including both face-sheets and core, as shown in Figure 2.
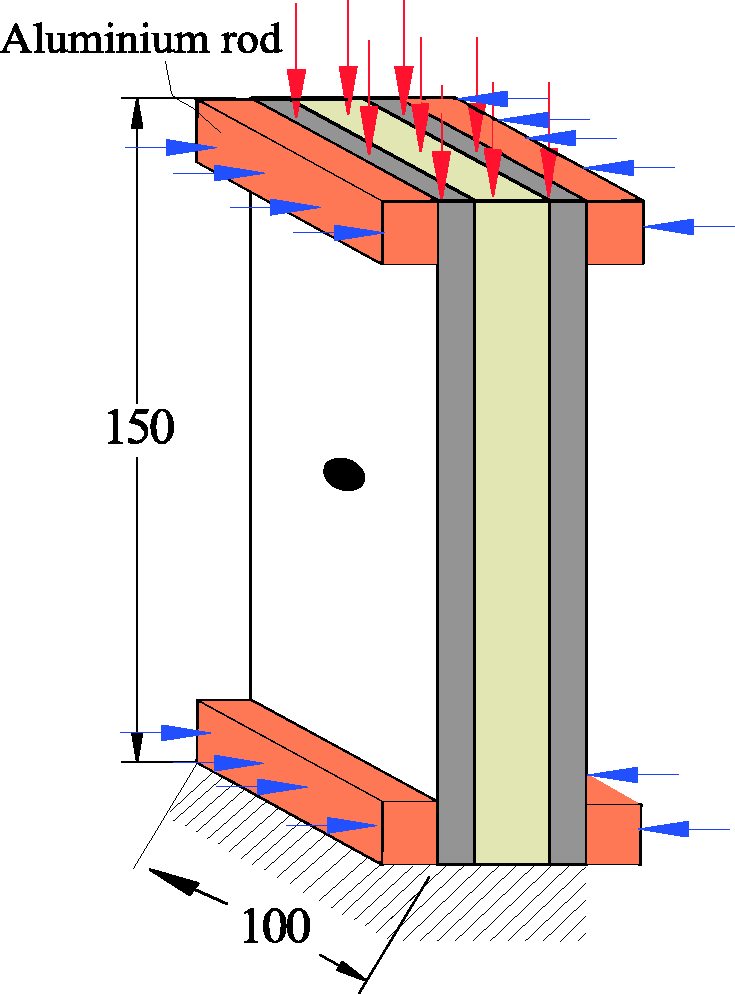
CAI sandwich test setup schematic (a) (measures in mm).
In this work, CAI-SW experiments were performed using a servo-hydraulic test machine with a maximum load level of 250 kN. The machine was run with computerised control and data acquisition systems. The size of the specimens for the CAI-SW test was 150×100 mm, in agreement with an Airbus test standard [19]. In order to minimise non-uniform stress on the loaded surfaces due to uneven load introduction, the loaded surfaces were fine-cut with a precision 5-axis CNC milling machine and the load plates were meticulously aligned parallel to the loaded surfaces. The sample was placed between the load-plates and constant cross-head displacement was applied with a 1 mm/min deformation rate. In order to avoid local crushing of the loaded face-sheet edges, they were transversely supported by clamping a pair of aluminium rods with 25 mm by 25 mm square cross section, along the loaded edges of the specimens. The clamping force was low enough to avoid local crushing of the foam-core underneath the face-sheets but still believed to suppress premature failure at the loaded edges.
In order to measure strains on the impacted side of the face-sheet, a high-speed camera system, supplied by LaVision GmbH was used, with a maximum frame rate of 16.6 kHz. A 3 D camera setup was used by positioning two high speed camera units for stereoscopic vision on a separate test stand, in order to enable measurements of out-of-plane deformation. Initial calibration of the two camera units was performed in order to assure that both units were synchronised and captured the same target image. A digital image correlation (DIC) analysis was performed by carefully applying a speckle pattern onto the observed area, enabling the high-speed system to precisely track the movement of the surface. The camera images were analysed using the DaVis 8.3 software, also supplied by LaVision GmbH, in order to process the captured images and to extract the load synchronised with the strain and deformation data.
Compression-after-impact of single skin specimens
In a CAI sandwich test setup, it is clear that part of the compressive load is transferred through the non-impacted face-sheet, which may lead to overestimation of the residual strength of the impacted face-sheet. In addition, applying a uniform load on the full cross-section is a challenge, since an uneven surface or even a slight load plate misalignment can cause non-uniform stress distribution and thus affect the accuracy of the post-impact strength measurement, resulting in significant scatter in the test results. In order to address these issues, a second type of CAI test setup was used in this study, entitled CAI single skin (CAI-SS). The specimens for this type of test setup were made by cutting off both the core and the non-impacted face sheet adjacent to the loaded edges after impact, as illustrated in Figure 3(a). The remaining core was left to provide lateral support with the intention to suppress global buckling without significantly affecting the load-bearing capacity. The in-plane size of the impacted face-sheet was the same as that for the CAI-SW specimens i.e. 150×100 mm. The face-sheet was loaded by two grippers that were closer together than the load-plates in the CAI-SW test case, thus reducing the reference length in the global strain measures. This was however not believed to influence the results. The 50 mm cut-outs were sufficient to give room for the grippers, without cutting any material that was damaged by the impact.
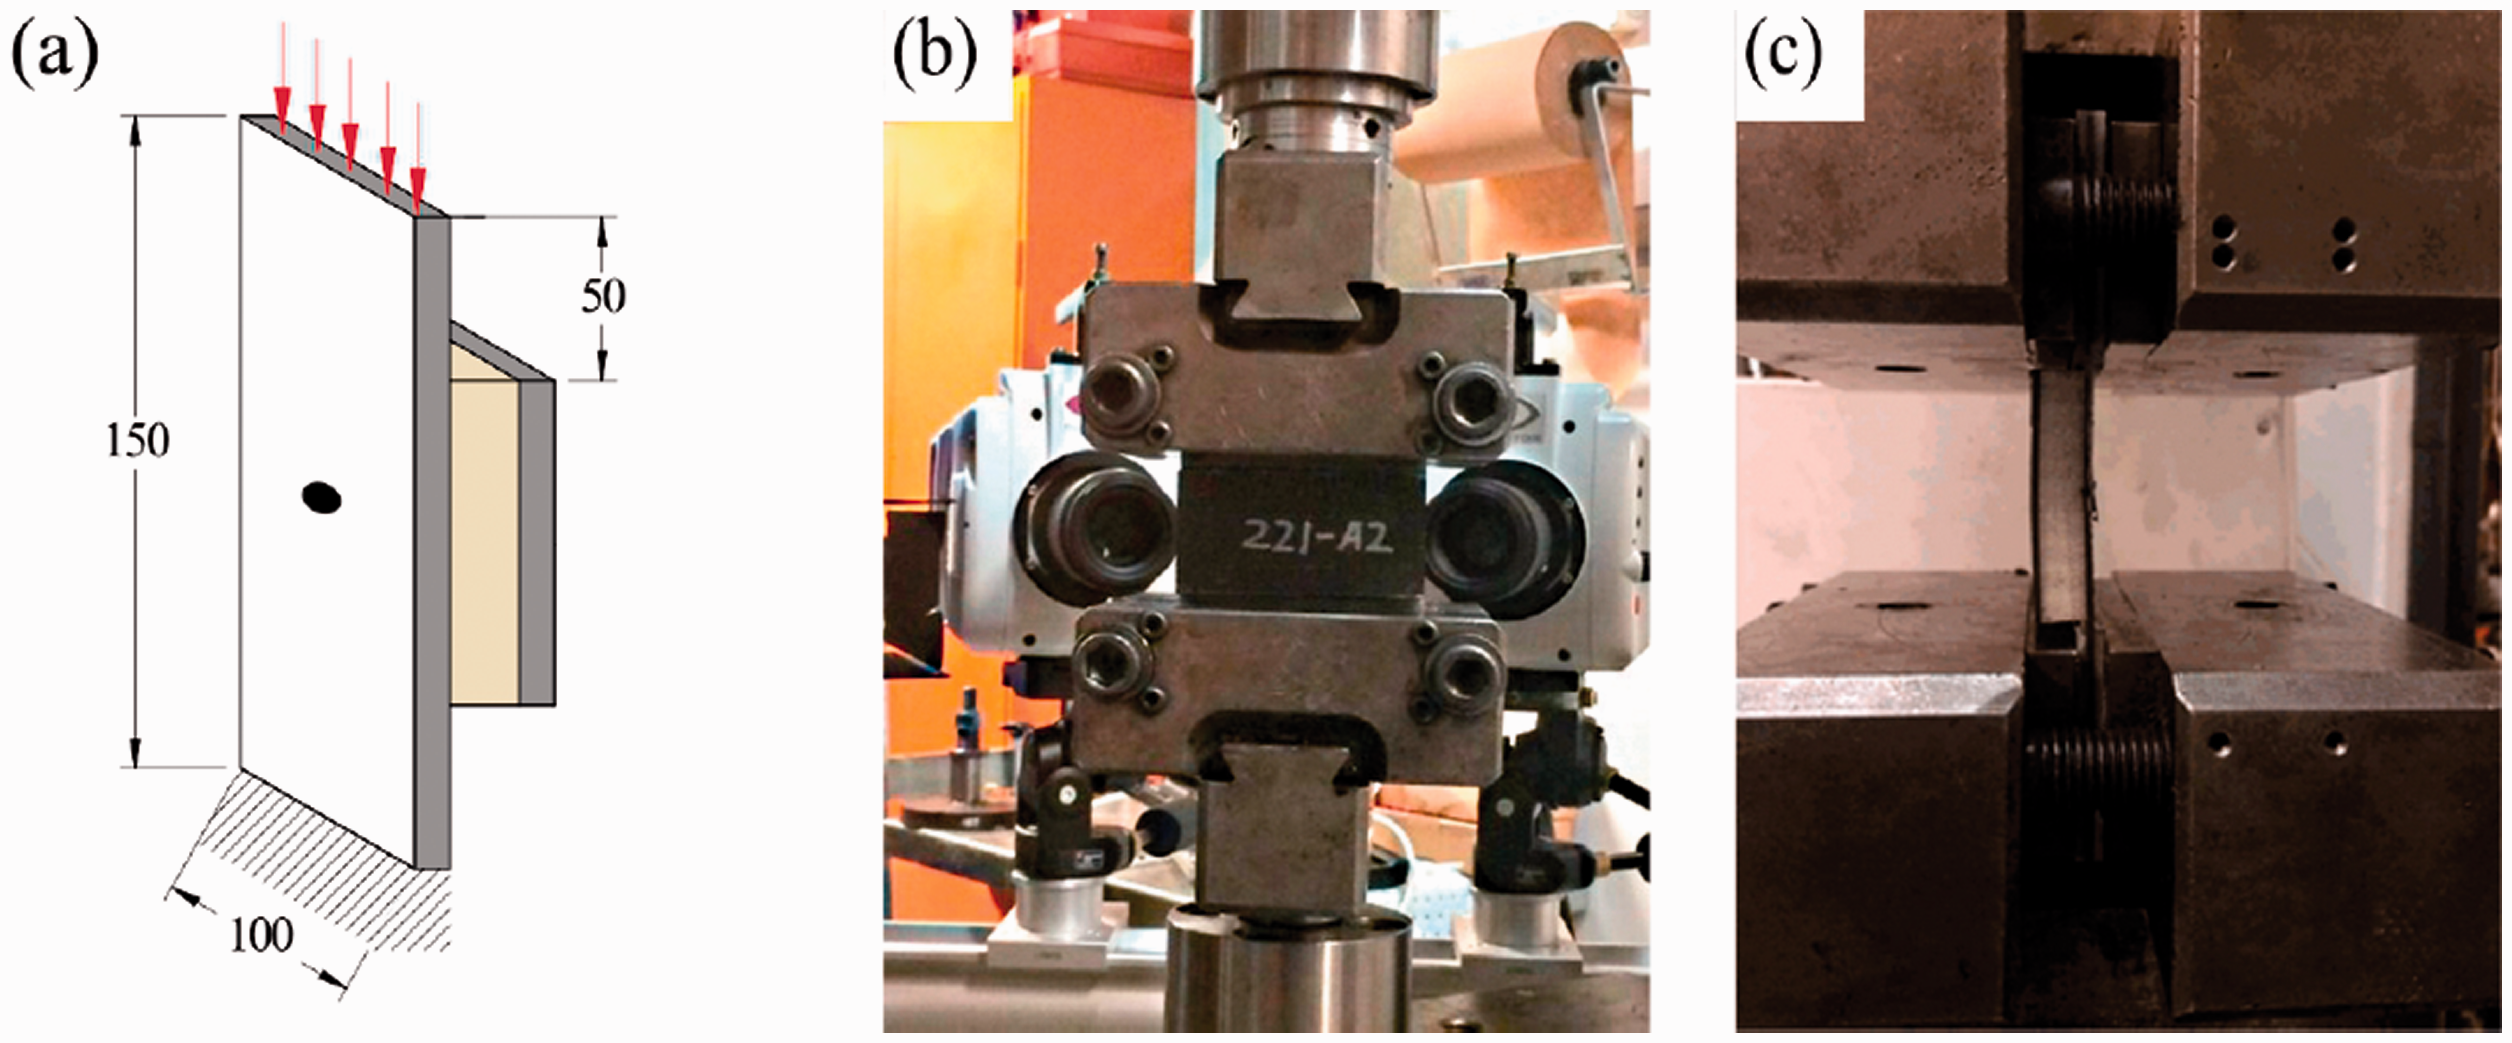
CAI single skin test setup schematic (a), and back view (b) and side view (c) pictures from the test (measures in mm).
In order to prevent local fibre crushing and failure near the loaded ends, glass-epoxy tabs were applied to the edges of the single skin face-sheet using an epoxy adhesive, Araldite 2015 A. The tabbed edges were clamped between rigid steel grippers attached to the cross-head of the hydraulic machine, and a constant cross-head displacement was applied at a rate of 1 mm/min. The test setup is shown in Figure 3(b) and (c). Similarly as in the CAI-SW testing, a speckle pattern was applied onto the observed area and strains were extracted from processing of high-speed camera images.
Bending-after-impact
The third test method for estimating post-impact residual compressive strength uses a 4PB test rig to generate in-plane compression of the impacted face-sheets. The method is referred to as bending after impact (BAI). The BAI specimens were designed so that compressive failure of the impacted face-sheet was expected, thus avoiding core crushing, core shear or face-sheet-core interface failure. That was done by fitting the support distances in the 4PB test setup to avoid core shear failure. A recommendation for the major support span length is provided by the ASTM D7249 test standard [20] as
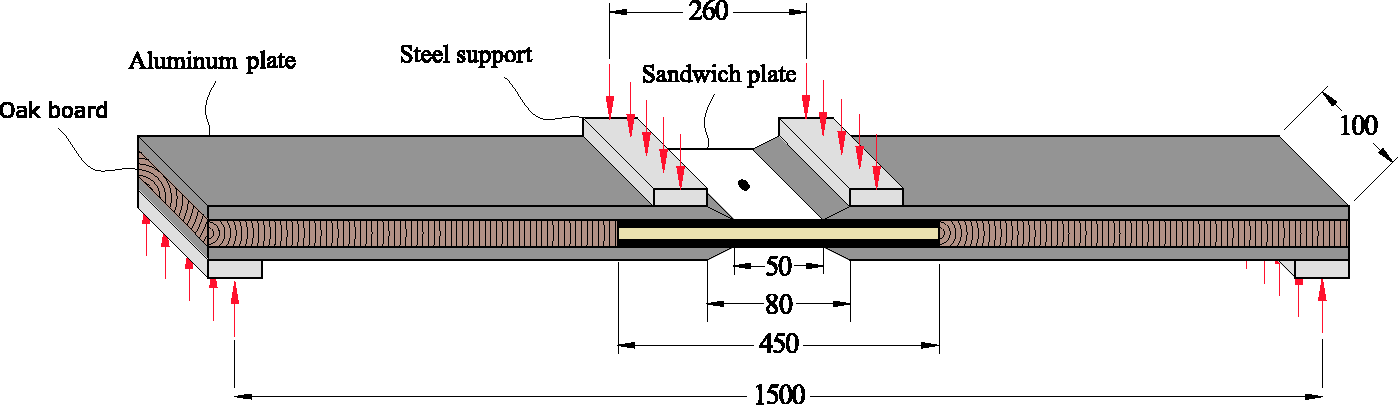
Schematic of the BAI test specimens (all dimensions in mm).
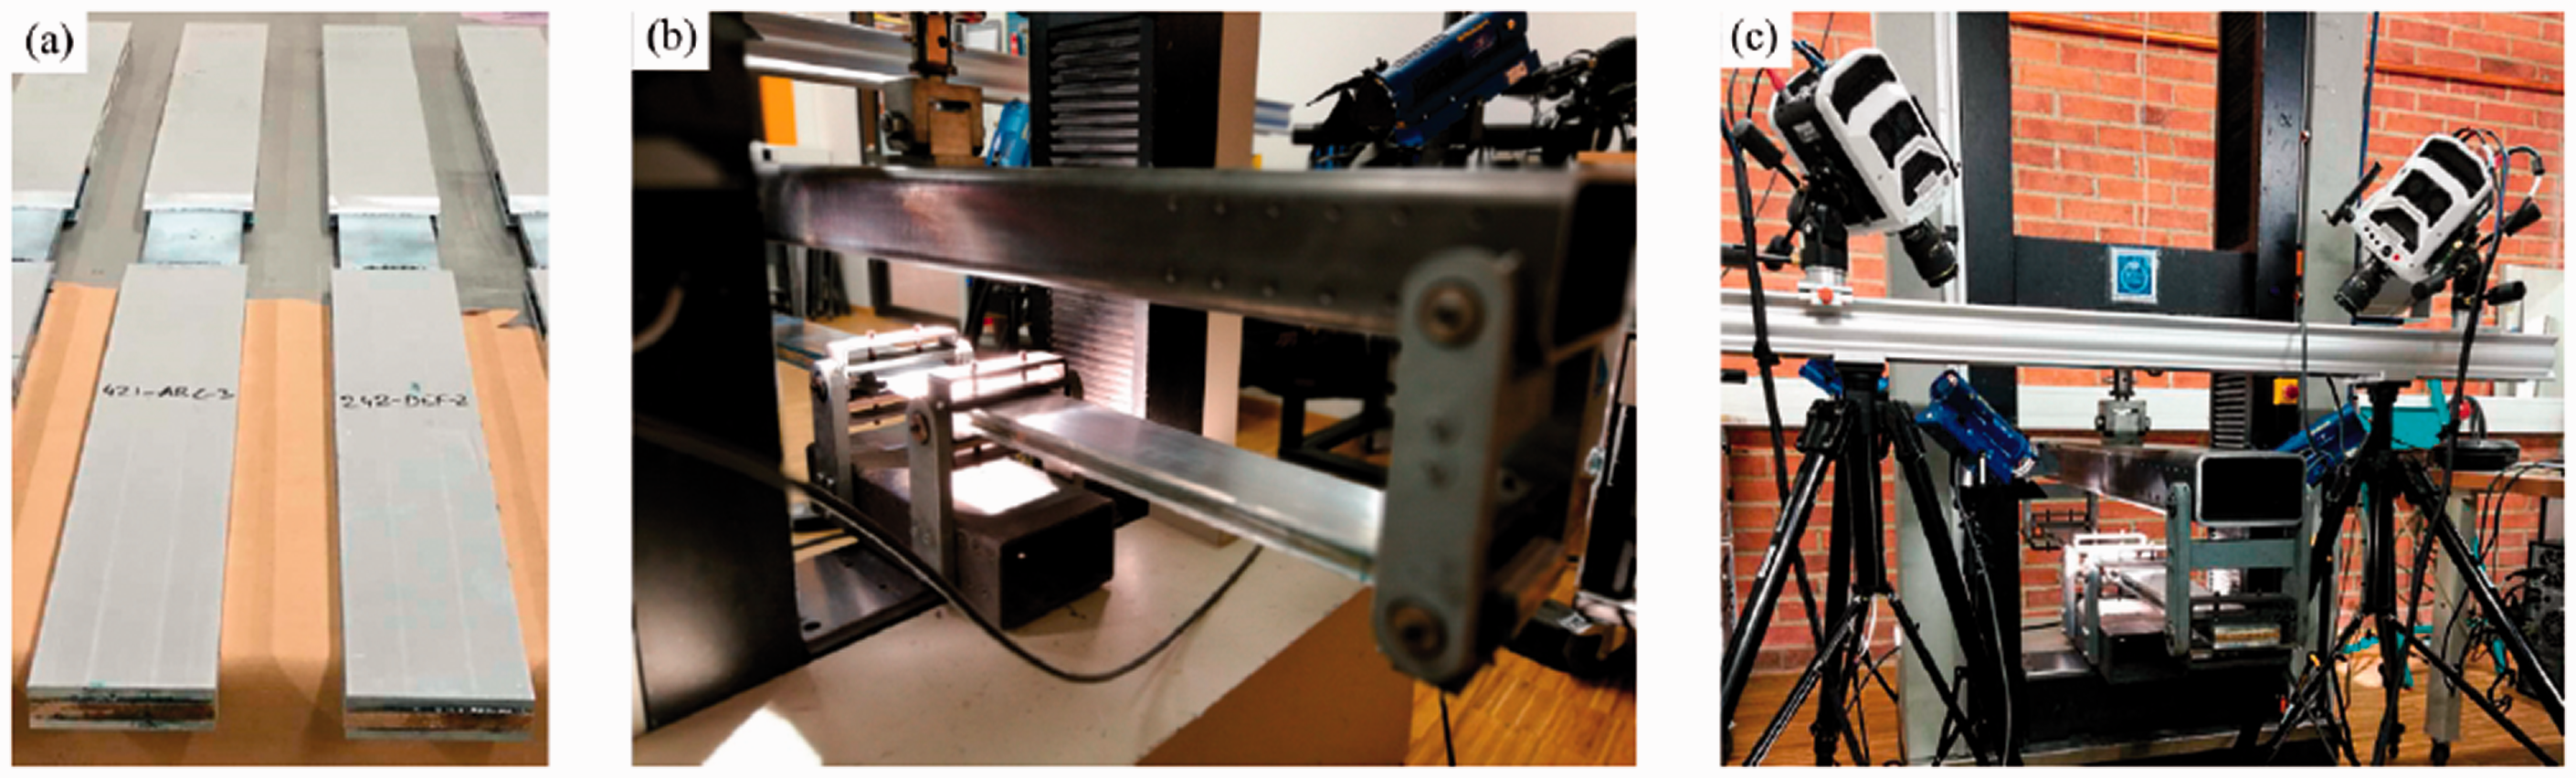
BAI test specimens (a), BAI test fixture (b), and BAI test setup with high speed camera system (c).
All BAI tests were performed in a screw-driven universal test machine (Instron 4505) with a 100 kN load cell. The crosshead, controlling the displacement of the outer supports, was moving at a constant displacement rate of 10 mm/min during the tests. The strains near the impacted area were extracted from the two high-speed cameras. All tests were performed at 23
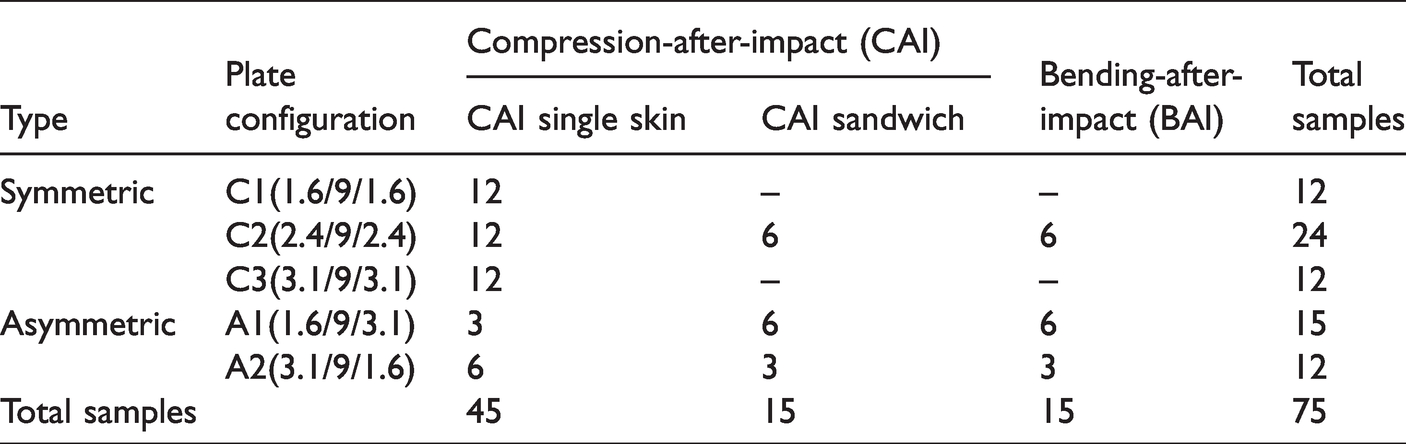
Damage tolerance test matrix
Damage tolerance testing was performed using the presented test methods, following the test matrix presented in Table 5. A total of 75 samples were tested, of which the main part was performed using CAI single skin tests (45 samples). The CAI-SW tests (15 samples) and BAI tests (15 samples) were used for comparison, either for studying the effect of geometrical parameters or the test methods as such. Impact damages corresponding to LLD, BVID and VID, specific for each face-sheet thickness, were examined in the study. A flow chart is presented in Figure 6, indicating how the tests were organised. Only the symmetric specimen configurations, i.e. C1, C2 and C3, were exposed to all three impact energy levels, whereas the rest of the configurations, i.e. A1 and A2 were only tested with BVID. In a previous study by the authors dealing with characterisation of low-velocity impact damage [11], significant damage was observed at BVID and thus it was decided to use that impact energy level as a baseline for the study.
Number of specimens in the post-impact tests.
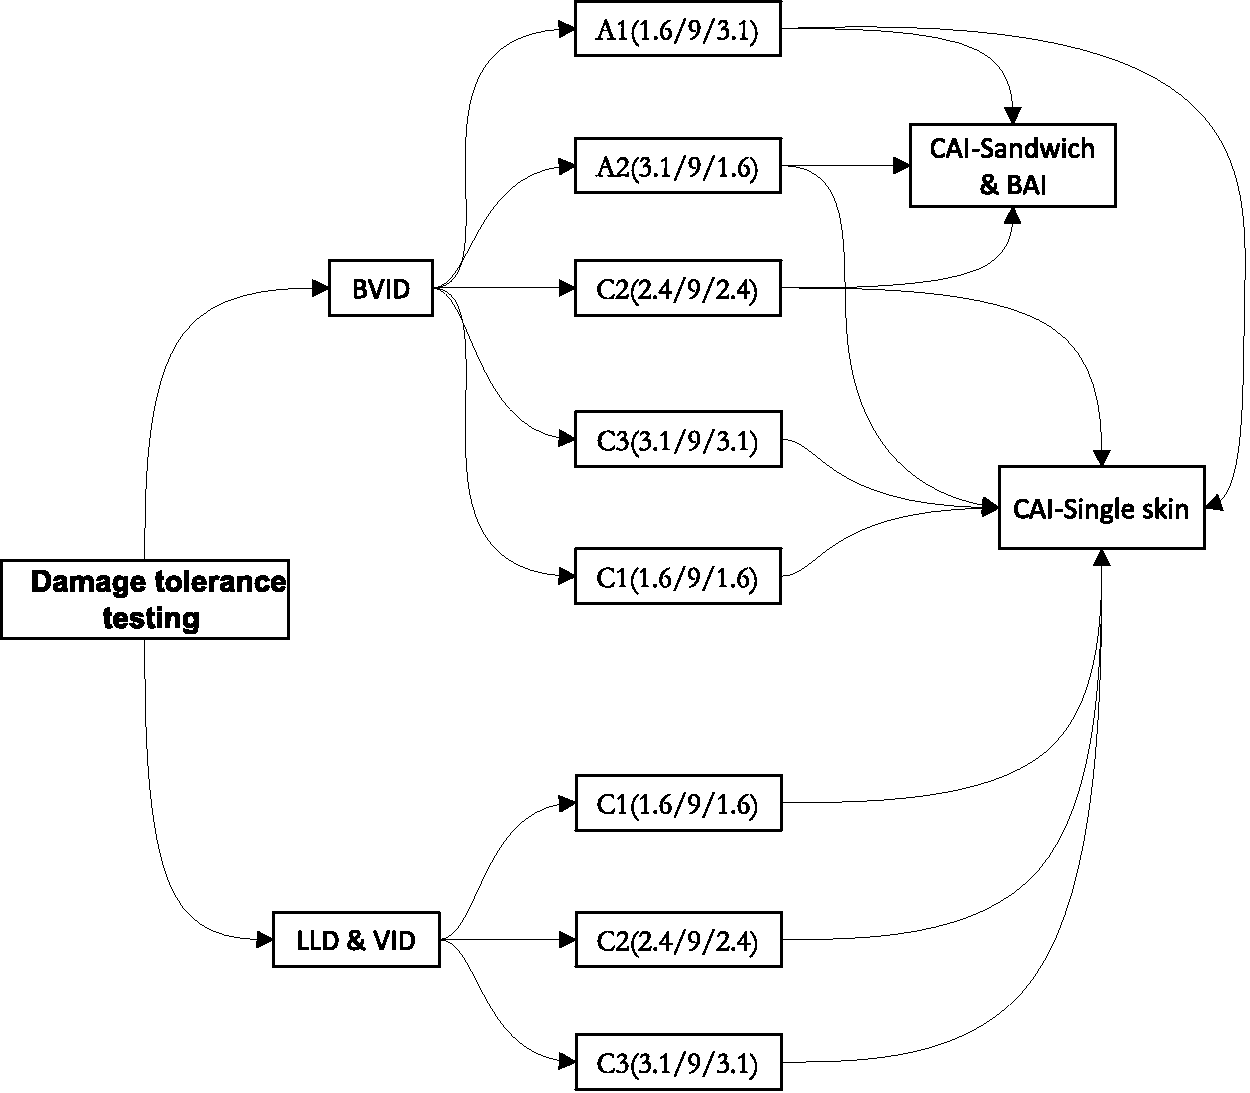
Post-impact experimental test scheme.
Finite element modelling
The simulation of the low-velocity impact event and the associated damage was performed as described in a previous work by the authors [11], and the reader is here referred to the previous paper for brevity. An extension of the FE simulation of the low-velocity impact was then performed to model the compression-after-impact response in this study. An explicit/dynamic FE model was developed in Abaqus/CAE for the CAI-SW and CAI-SS test methods. The face-sheets were modelled with continuum shell elements (SC8R) with one element per ply in the thickness direction, and the core was modelled using 3 D stress elements (C3D8R). Cohesive surface elements were used to model delamination between plies and a Hashin damage model was used to predict intra-laminar failure. The irreversible deformation in the foam was modelled using a crushable foam material model. For more details about the modelling and boundary conditions of the low-velocity impact testing the reader is referred to [11].
After completion of the impact step, the boundary conditions were redefined to comply with the CAI-SW and CAI-SS test setups. The degrees of freedom on one side of the specimen were constrained in the x direction, over the entire width, and a rigid plate was modelled to apply an in-plane compressive load on the opposite side of the impacted specimen. Both the CAI-SW and CAI-SS FE models are shown in Figure 7. All relevant material properties used in the FE models are presented in Tables 1 and 2. The CAI-SS model was used to estimate the residual strength for the symmetric plate configurations at LLD, BVID and VID impact energy levels. The CAI-SW model was used to predict both the bypass load effect and the overall residual strength of the impacted specimens.
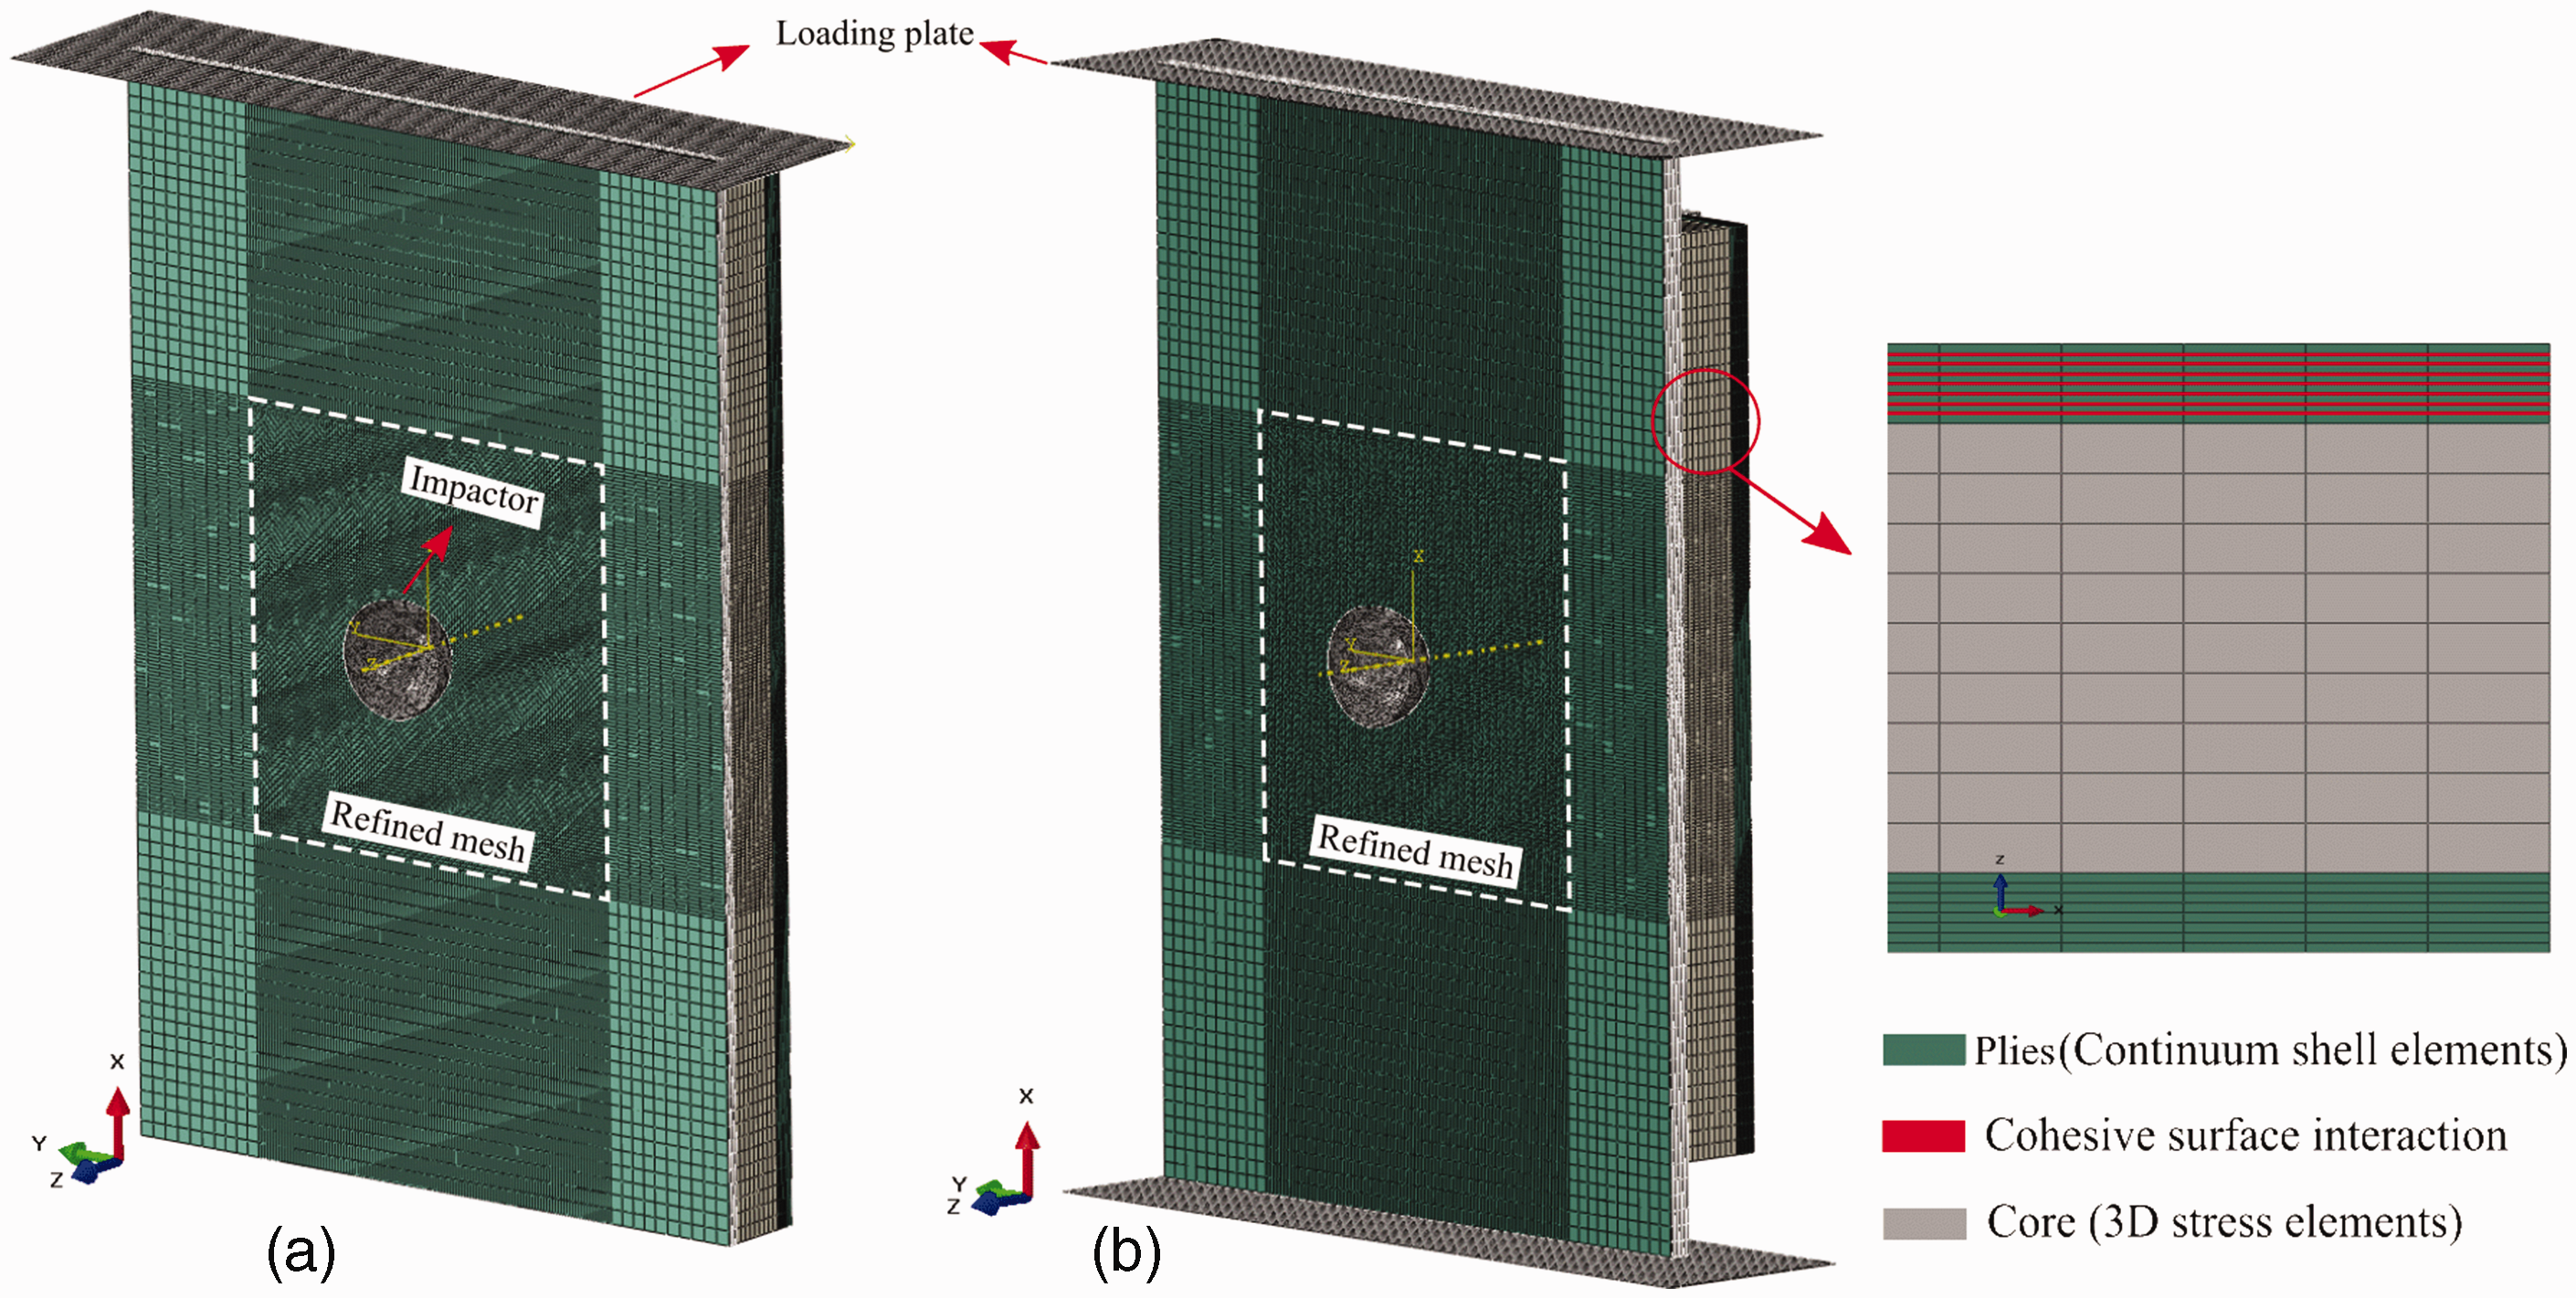
CAI-SW (a) and CAI-SS (b) finite element models.
Results and discussion – Method by method
CAI sandwich
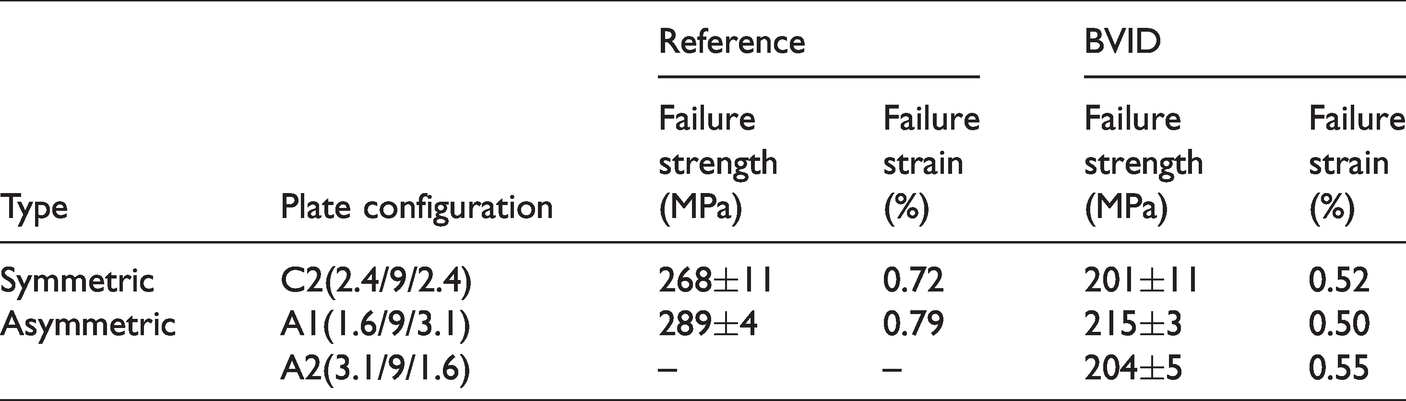
The CAI-SW test results are presented in Table 6 for both symmetric and asymmetric specimen configurations. The average CAI-SW compressive strength was calculated by dividing the failure load by the total cross-sectional area of the two face-sheets. CAI-SW testing was performed only on BVID-impacted specimens and undamaged specimens for reference. Asymmetric sandwich specimens were included to study the by-pass load effect on the compressive strength estimate of the impacted specimens. The results show that the relative loss of residual strength for BVID-impacted specimens is about 28% for symmetric and 25% for asymmetric specimens. Both the symmetric and asymmetric specimens failed at about 0.5% global average strain. For the asymmetric cases (A1 and A2) the average strength for the reference and impacted specimens, respectively, was the same, although the impacted face-sheets had different thickness. This is believed to be related to the by-pass load effect and is discussed in more detail in a later section.
CAI-SW test results.
aGlobal average strain, i.e. global displacement divided by specimen length.
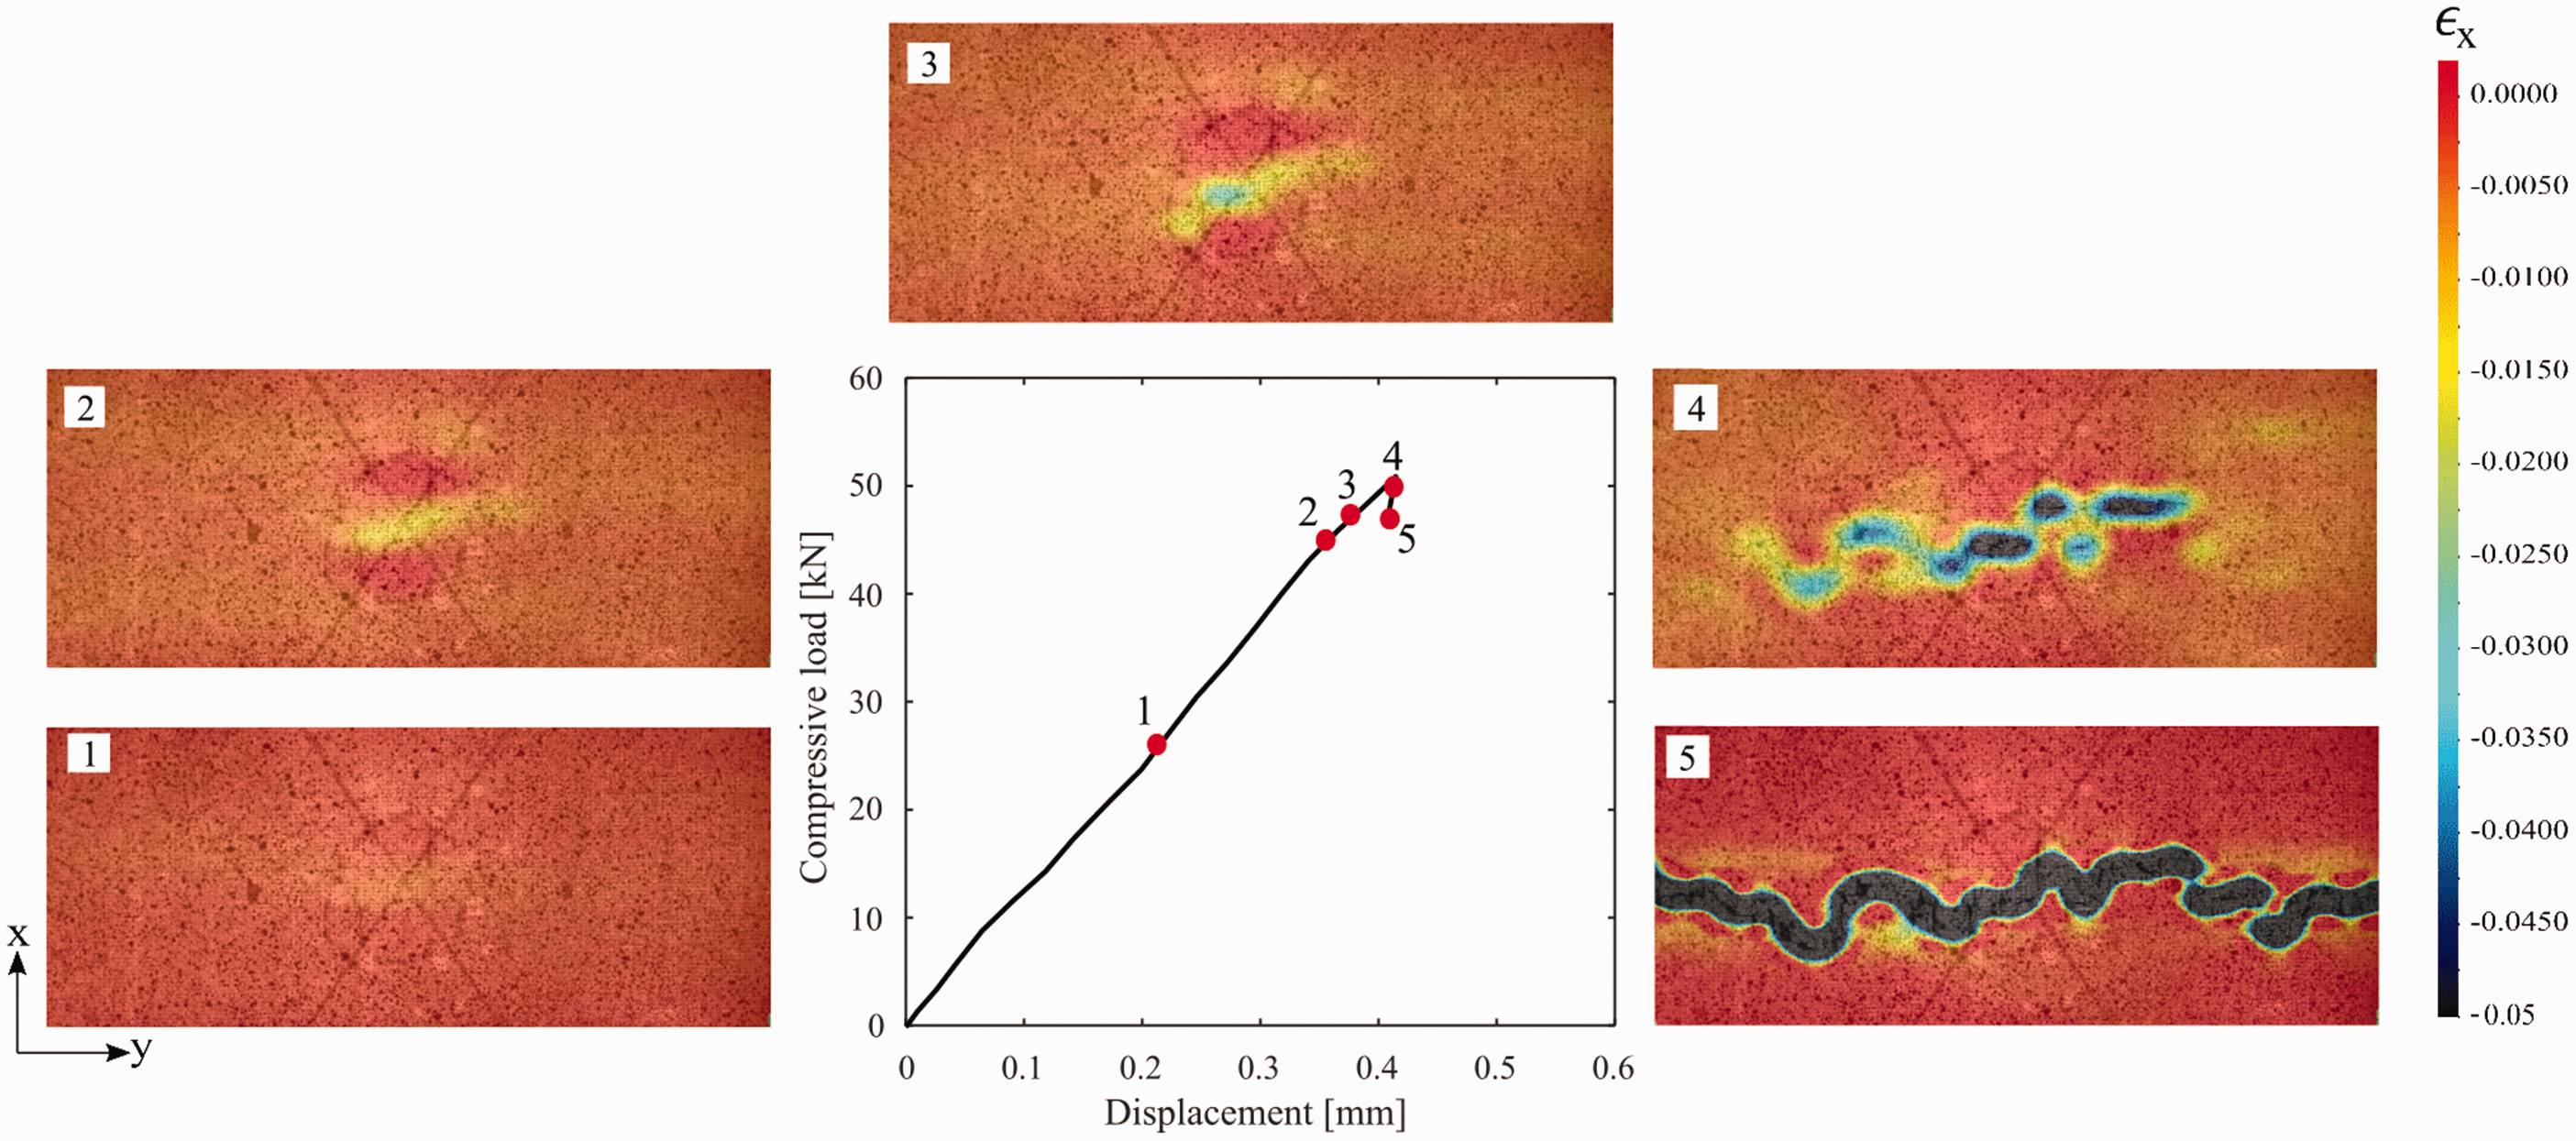
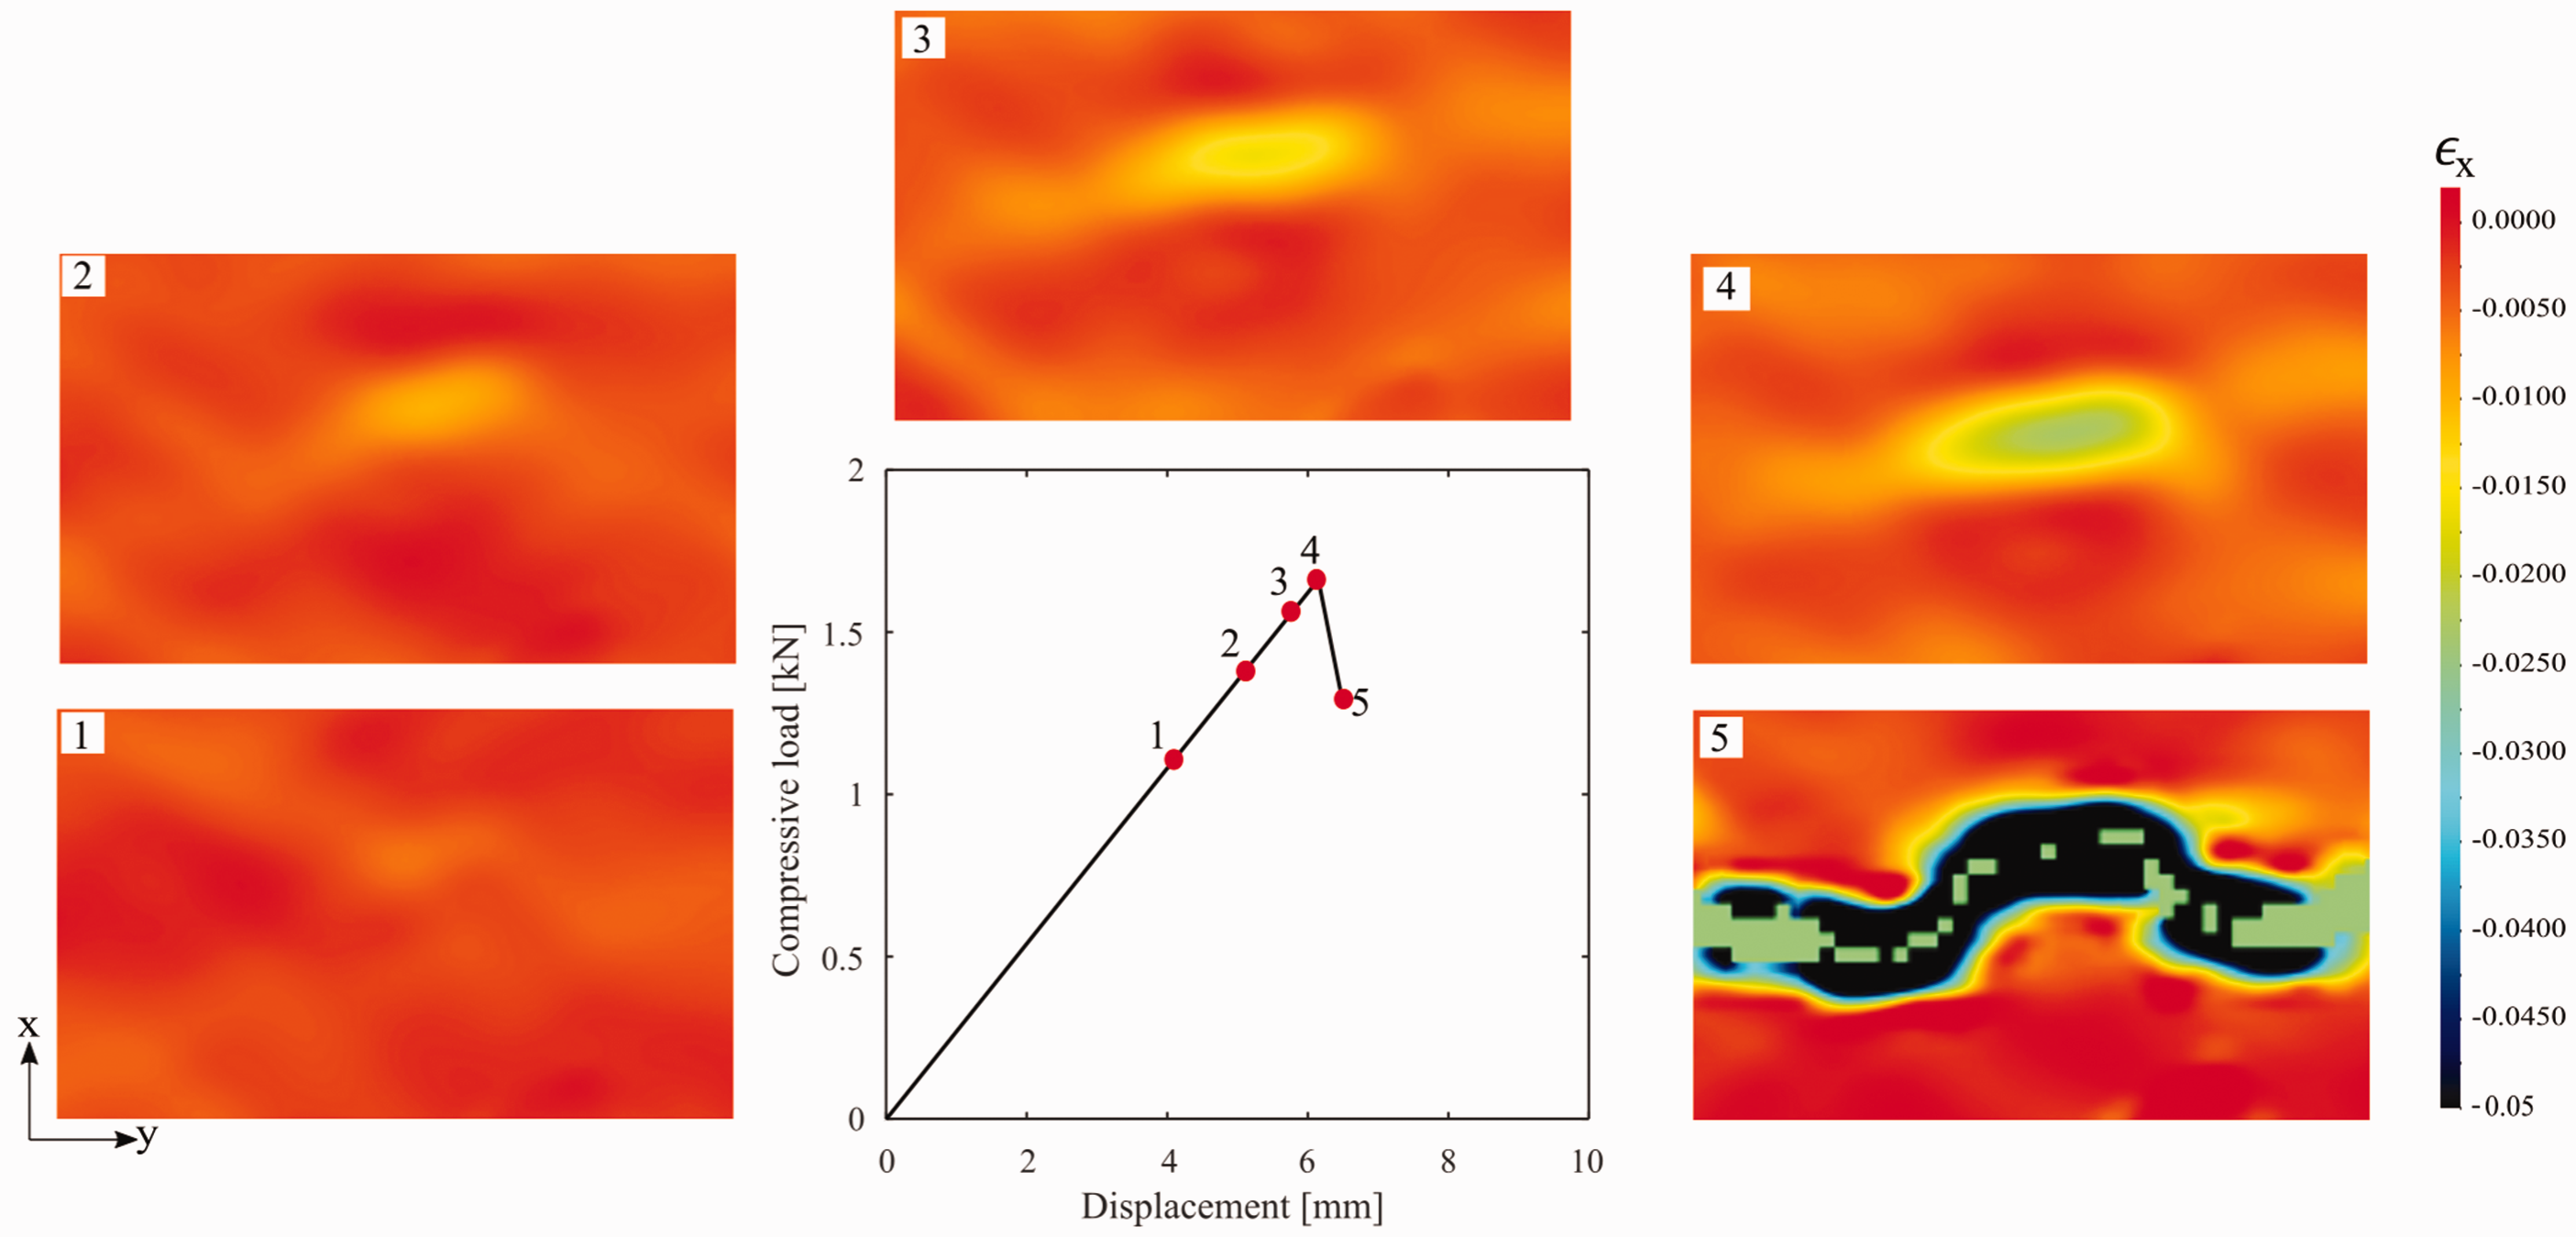
All CAI-SW samples failed in face-sheet compression and no global buckling deformation was visible in the DIC results from the tests. The reference specimens without impact damage failed near the supported ends, whereas failure in the impacted specimens was initiated in the vicinity of the impact dent, with a crack then growing across the width of the specimen, perpendicular to the direction of loading. A strain (
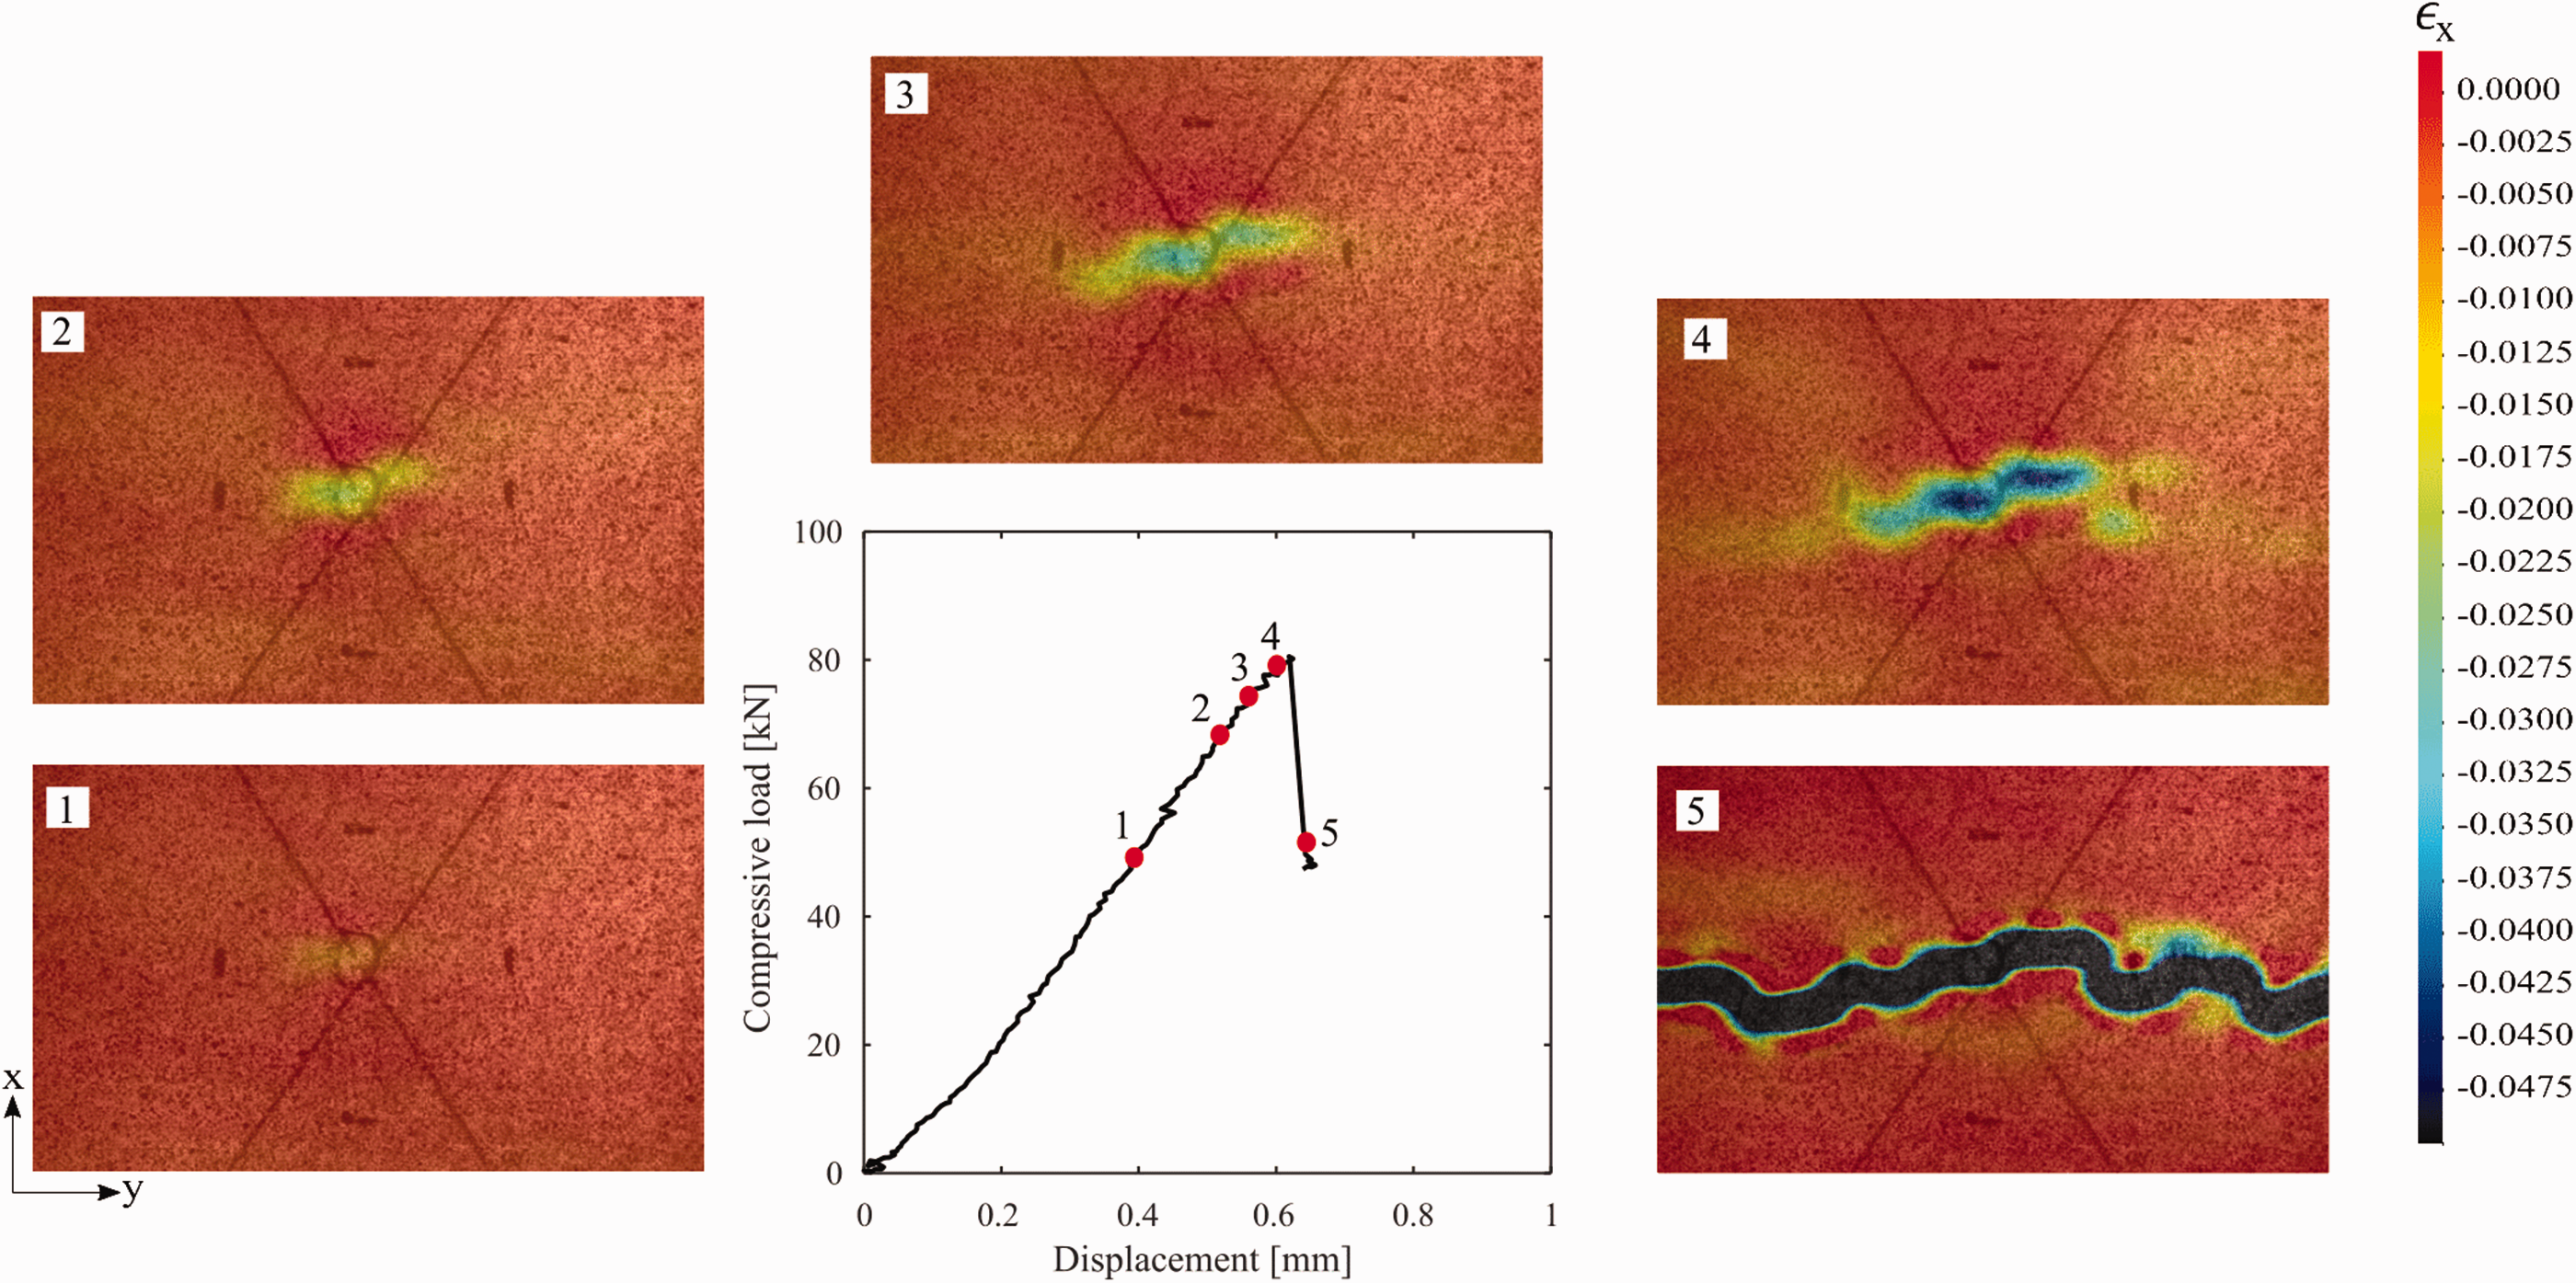
Strain maps from an impacted C2(2.4/9/2.4) CAI-SW specimen during testing.
CAI single skin
The post-impact residual strength from CAI-SS tests for symmetric and asymmetric plate configurations are presented together with results from reference specimens in Table 7. The average compressive strength was calculated by dividing the compressive load by the cross-section area of the tested face-sheet. Post-impact CAI-SS testing was performed for all three impact energy levels, i.e. LLD, BVID and VID, along with undamaged specimens for reference (see Figure 6). Asymmetric sandwich specimens were also included in order to check for any effect from the intact face-sheet on the residual strength measurements of the impacted specimens. Similarly, as for the CAI-SW test results, the CAI-SS results also show failure initiating close to the impact dent that grow across the width of the specimen. A strain map is presented in Figure 9.
Compressive strength of CAI-SS specimens.
Strain maps from an impacted C2(2.4/9/2.4) CAI-SS specimen during testing.
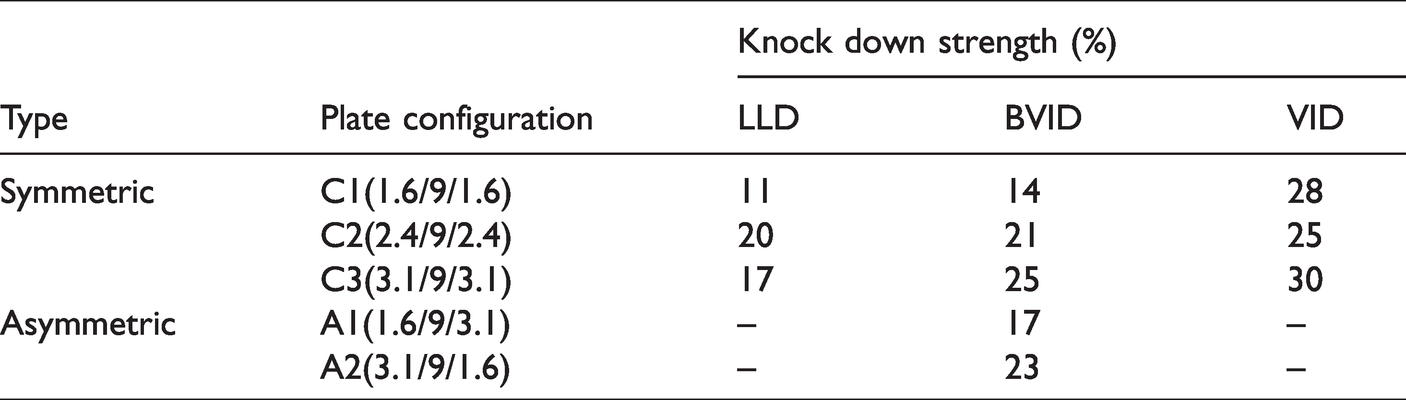
In Figure 10 the strength is plotted against the impact energies corresponding to LLD, BVID and VID for the symmetric configurations C1, C2 and C3, respectively. The compressive strength of the undamaged specimens is also plotted for each configuration. It can be seen that the reference strength increases with increasing face-sheet thickness for the C-configurations. This is believed to be due to the fact that the face-sheets are asymmetric and after locally removing the core and the back face-sheet the specimen loses the symmetry that the full sandwich configuration possesses. The asymmetry, described by non-zero coefficients in the
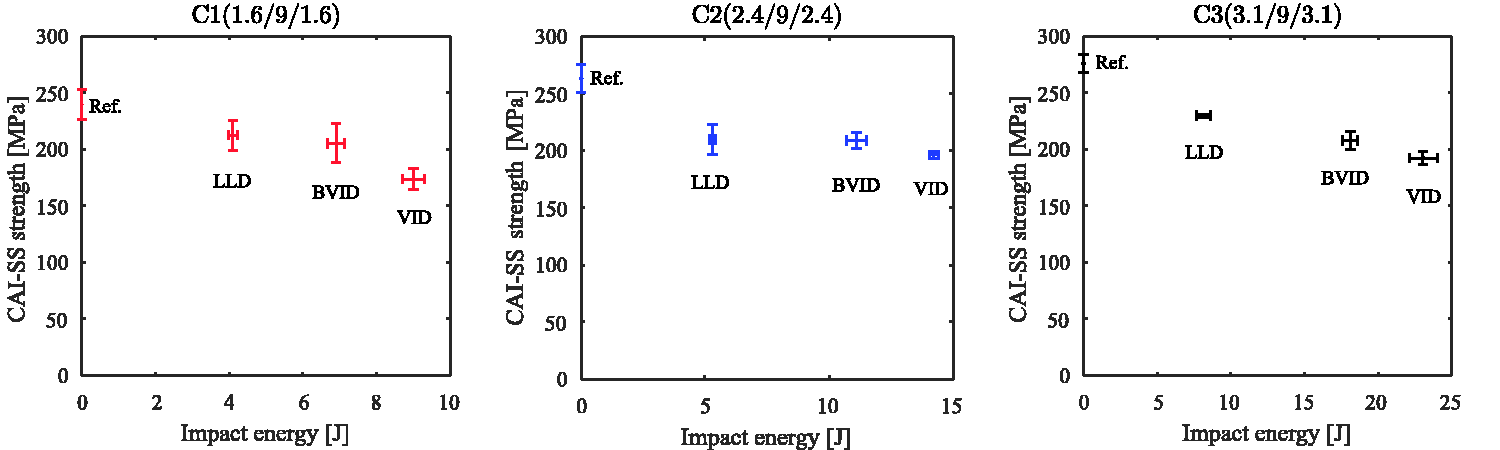
CAI-SS residual strength for the C1, C2 and C3 plate configurations.
Strength knock-down for CAI-SS specimens.
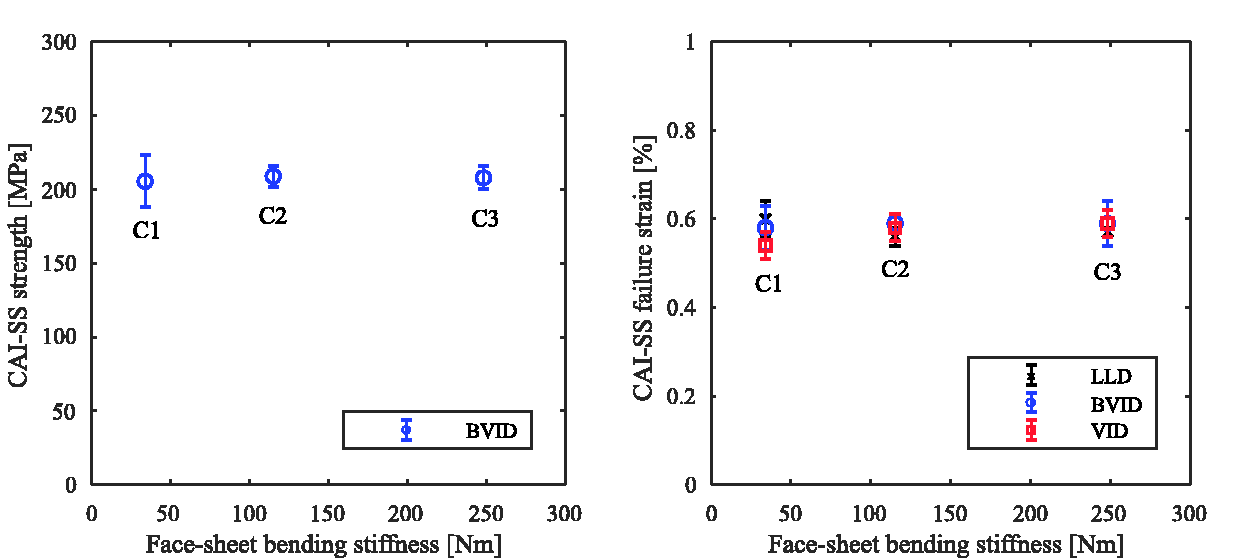
Variation of CAI-SS residual strength (left) and CAI-SS failure strain (right) with respect to face-sheet bending stiffness.
A similar trend can be seen in the effect of varying face-sheet thickness on the failure strain, presented in Figure 11 (right) and Table 9 for the different impact damages. Apparently, all impacted specimens failed at about 0.57% compressive strain, regardless of face-sheet thickness.
Failure strain of CAI-SS specimens.
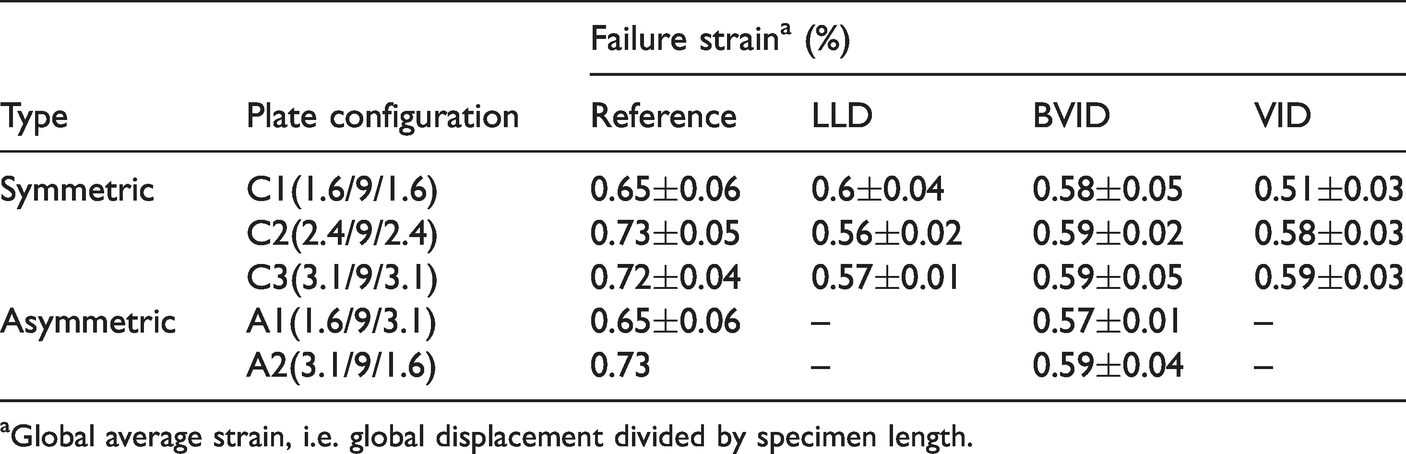
Global average strain, i.e. global displacement divided by specimen length.
In order to study the effect of impact energy on the residual strength of the impacted specimens, a graph with the normalised residual strength versus impact energy is presented in Figure 12 for the symmetric plate configurations, i.e. C1-C3. Each specimen configuration is normalised by its reference (non-impacted) specimen strength. The residual strength can be represented by a linear regression curve, given by
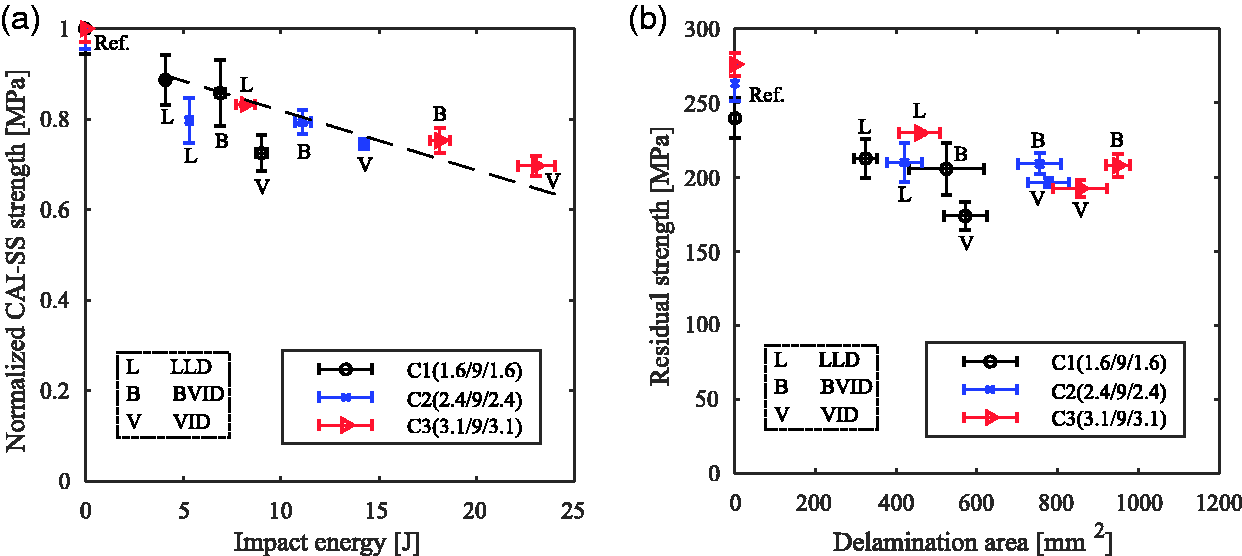
Normalised CAI-SS strength versus impact energy (a) (a linear trend-line is added for the discussion), and CAI-SS compressive strength versus delamination area (b).
Numerical results
FE models including progressive damage were used to predict the residual strength of the CAI-SS specimens with LLD, BVID and VID. As already mentioned, results from low velocity impact simulations were earlier reported in [11]. The residual strength results are presented in Figure 13 for the symmetric (C1-C3) configurations. In general, the finite element models predict the residual strength with a good level of accuracy for all three specimen configurations. For the reference specimens, the FE models also predict the increase in strength with respect to the thickness observed in the experiments. The FE simulations show damage growth just before failure, through fibre damage and delaminations propagating across the width of the specimen, perpendicular to the loading direction, as shown in Figure 14. The damage evolution resembles the failure observed in the CAI-SS experiments, see Figure 9.
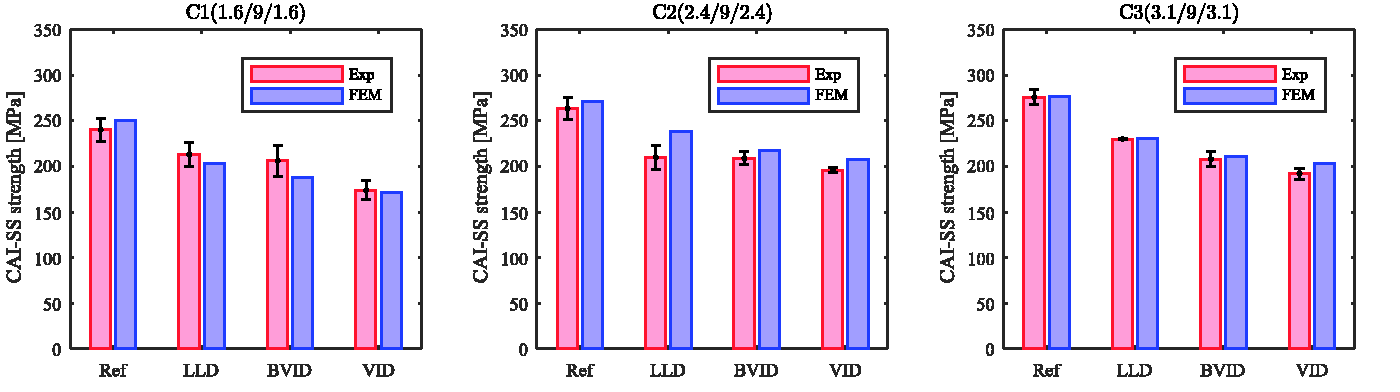
Comparison of experimental and numerical results for the CAI-SS case at different energy levels.
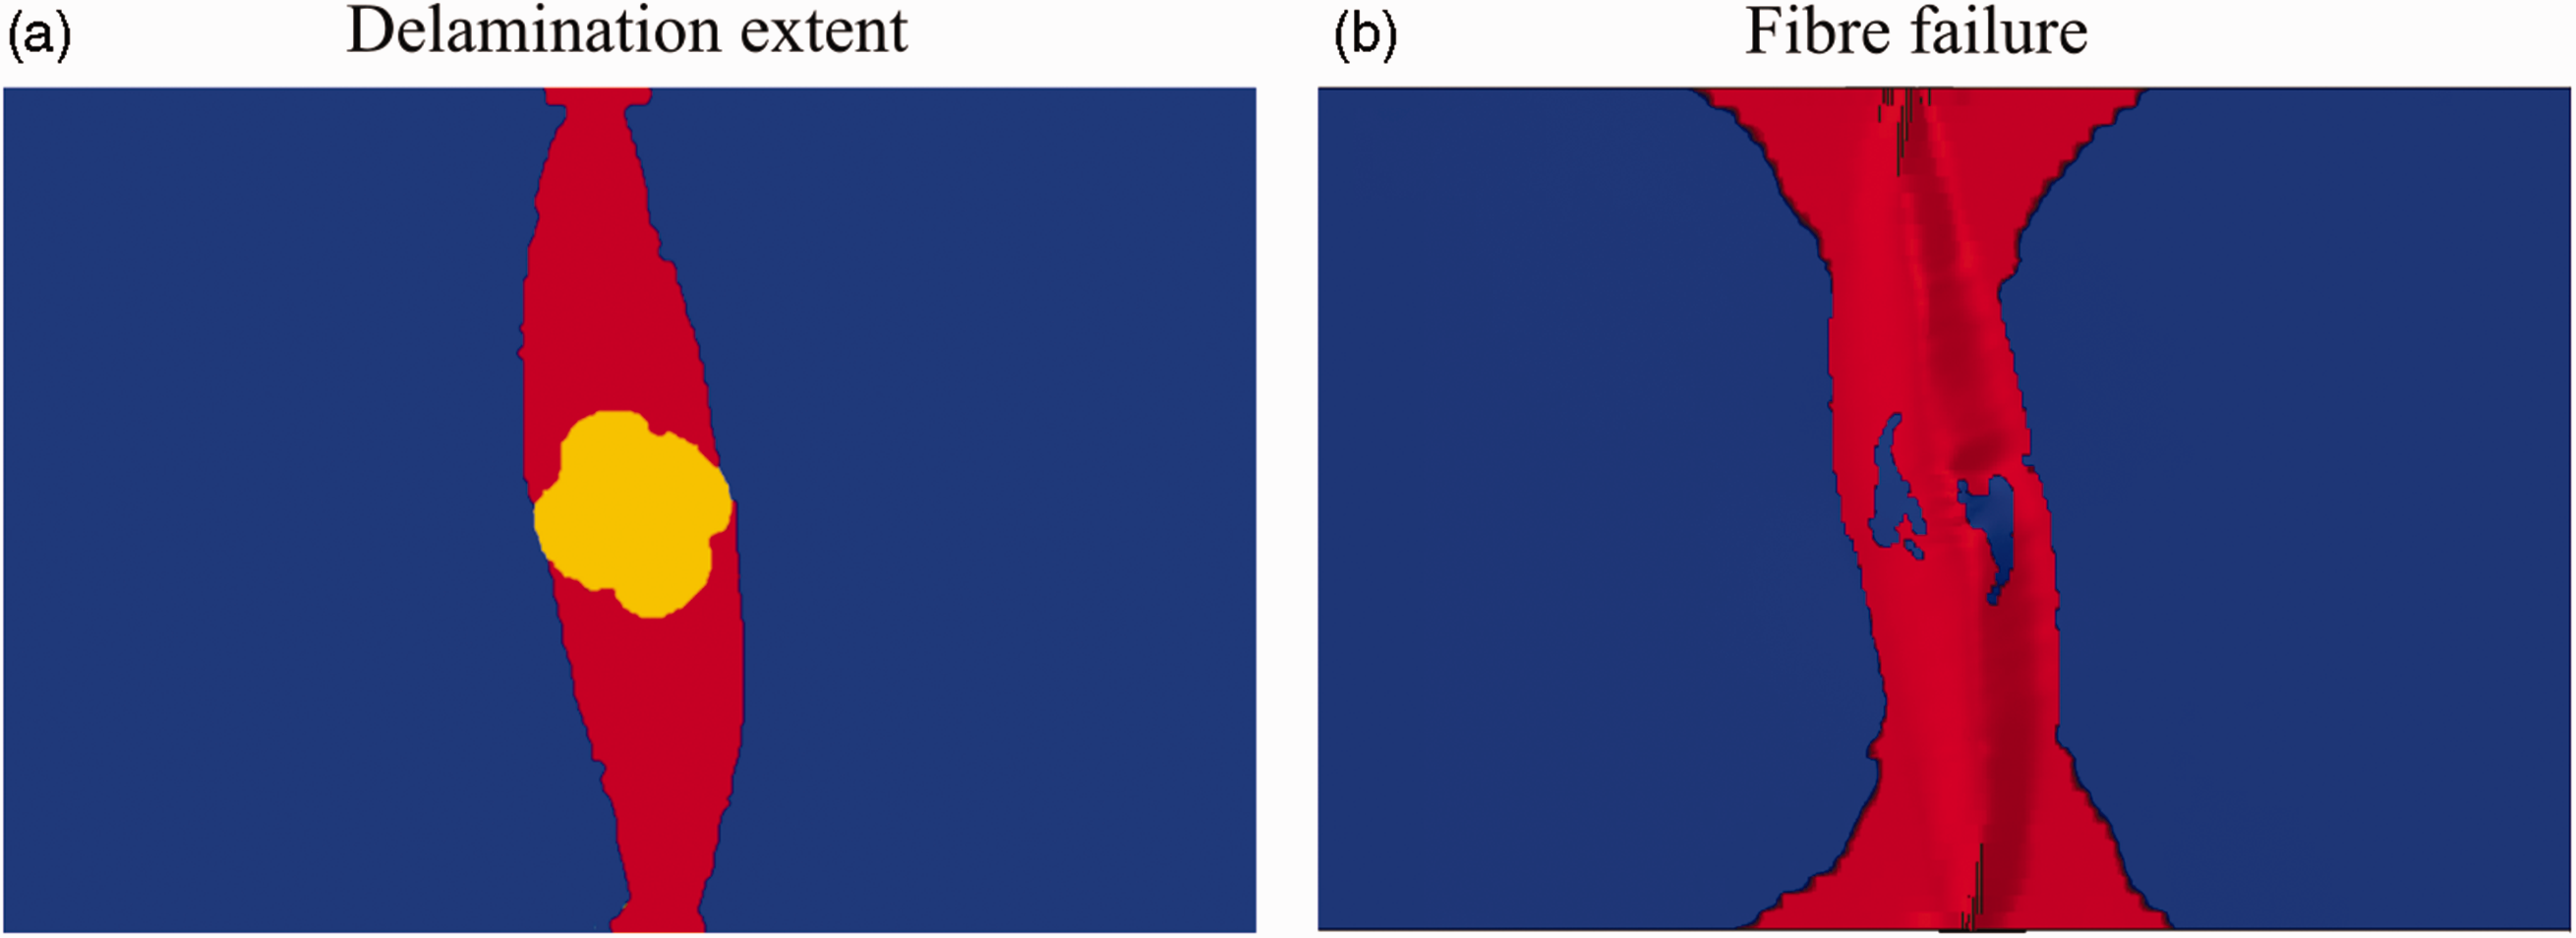
Delamination extent in CAI-SS specimens after low velocity impact (in yellow) and after post impact simulation (in red) (a), and fibre failure after post impact simulation (b).
Bending-after-impact (BAI)
The stress in the mid-plane of the top face-sheet for the BAI test specimens is estimated from [9] and given by:

Where

The bending-after-impact (BAI) test results for the symmetric and asymmetric specimen configurations are presented in Table 10. BAI testing was performed on the BVID-impacted specimens only, along with undamaged specimens for reference. Asymmetric sandwich specimens were included in order to study the stress gradient through the thickness during bending, which partly depends on the core thickness but also on the thickness of the back face-sheet, since that also affects the location of the neutral axis (plane). Different back face-sheet thicknesses might alter the response and affect the residual strength after impact. The loss of residual strength for the specimens with BVID was about 25% for symmetric and 26% for asymmetric specimens. All BAI-tested specimens failed in face-sheet compression and none of the samples showed any core shear failure. A compressive strain (
Compressive strength for BAI specimens at the mid plane of the compressed face-sheet.
Strain maps from a C2(2.4/9/2.4) BAI specimen during testing.
Overall discussion and comparison of test methods
Comparison between CAI-SS and CAI-SW results
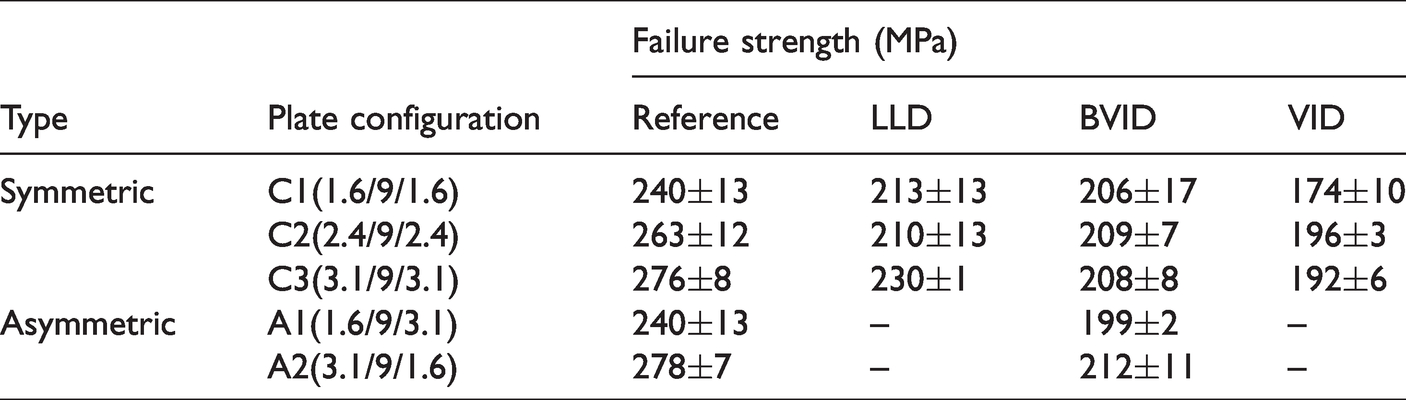
The CAI-SS and CAI-SW test results are compared in Table 11 for both symmetric and asymmetric specimen configurations. Since the strength of the impacted face-sheets cannot be unambiguously determined from the tests, the failure loads and strains are presented and used as basis for the discussion. For the reference case of the symmetric C2 specimens, the failure load from CAI-SW is slightly lower than double the CAI-SS failure load. Since two face-sheets are compressed in parallel in the CAI-SW specimens, that is an indication of the CAI-SW test failing to reach the true strength of the face sheets. For the A1 and A2 reference cases the CAI-SW strength is closer to the sum of the corresponding CAI-SS results but it should be remembered that also CAI-SS seemed to underestimate the compressive strength for the thinner face sheets. For the impacted (BVID) C2 specimens, CAI-SW also shows a higher failure load compared to the CAI-SS result, indicating that a part of the load in CAI-SW is carried by the intact face-sheet. It is thus clear that some means to separate the load in the impacted face-sheet from the bypass load in the intact face-sheet is needed for the assessment.
Comparison between CAI-SS and CAI-SW test results for reference and BVID specimens.
The bypass load effect could be seen for the asymmetric configurations as well. The CAI-SW failure load for the reference case is close to the sum of the CAI-SS reference loads of the A1 and A2 specimens. For the BVID specimens, the CAI-SW failure load for the asymmetric cases (A1 and A2) was also higher than the CAI-SS results and the CAI-SW load appears to scale with the thickness of the intact face-sheet. For the A1 configuration, the intact face-sheet thickness is twice that of the impacted face-sheet, and vice versa for the A2 configuration. An analytical expression is here suggested for estimation of the ultimate load for the impacted CAI-SW specimens, assuming linear elastic and parallel uniform displacement of the two face-sheets. The assumption allows for superposition of the individual failure loads from the CAI-SS case but taking into account that the strain level in the intact face sheet is sub-critical. The total CAI-SW failure load can then be expressed as
The failure load of the impacted face-sheet 
The indices imp & int indicate impacted and intact, respectively, for better clarity. Using the above equations, the estimated bypass load for the CAI-SW specimens is presented in Table 12.
Split of CAI-SW failure load between individual face-sheets.
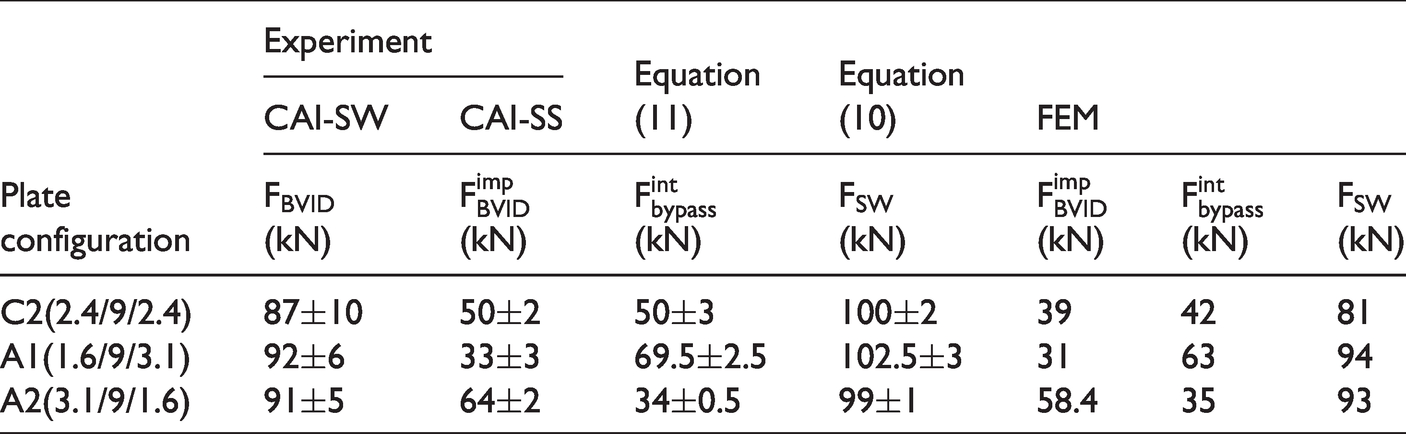
In addition, the FE models for CAI-SW were also used to estimate the failure load levels of the individual face-sheets. The results from the FE simulations are also presented in Table 12. Both FE and analytical results show good agreement with the experimental results of the total failure load (
A comparison of the failure strain from the CAI-SS and CAI-SW tests can also be made (Table 11). The failure strain tends to come out lower in CAI-SW than in CAI-SS for the reference cases and even more for the impacted cases. It thus appears like the CAI-SW test method is more sensitive to impact damages than the CAI-SS method. The lower strain at failure could come from a loss of global stiffness in the impacted face sheet that induces instability during the test. The DIC evaluation confirms slightly more bending of the impacted face-sheets in CAI-SW than in CAI-SS, however still quite little (in the order of 0.1 mm transverse displacement between the loaded edges, or less) and not considered sufficient to support that failure initiates due to global instability. It is more likely that the loss of stiffness in the impacted face-sheet causes a slightly different distribution of load between the two face-sheets, which is not taken into account in the estimations.
Another study was performed to investigate the influence of the back (intact) face-sheet on the residual strength from the CAI-SS test case. For this purpose, two asymmetric plate configurations with variable intact face-sheet thicknesses were tested. Both configurations were tested with BVID only, with the thinnest face-sheet impacted for the A1 configuration and the thickest for the A2 configuration. The CAI-SS strength results are found in Table 7. A comparison between CAI-SS symmetric (C1 & C3) and asymmetric (A1 & A2) residual strength results is presented in Figure 16. There is no statistically significant difference in the residual strength for the cases studied. It thus seems fair to conclude that there is no effect from the back face-sheet on the residual strength results using the CAI-SS method. It is however believed that the back face-sheet, together with the core material, provides some lateral support to the front face-sheet, impeding global buckling. The FE analysis confirms that the stresses in the back face-sheet are insignificant and the DIC results show very little bending of the specimens during the tests (in the order of 0.05 mm transverse displacement between the loaded edges or less).
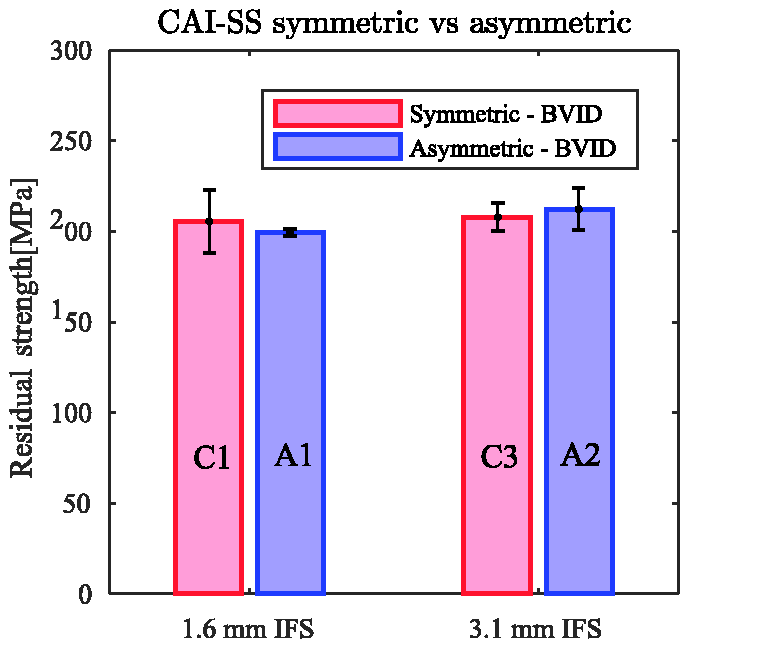
Comparison of residual strength for CAI-SS, symmetric and asymmetric cases. IFS stands for impacted face-sheet.
Comparison between CAI-SS and BAI results
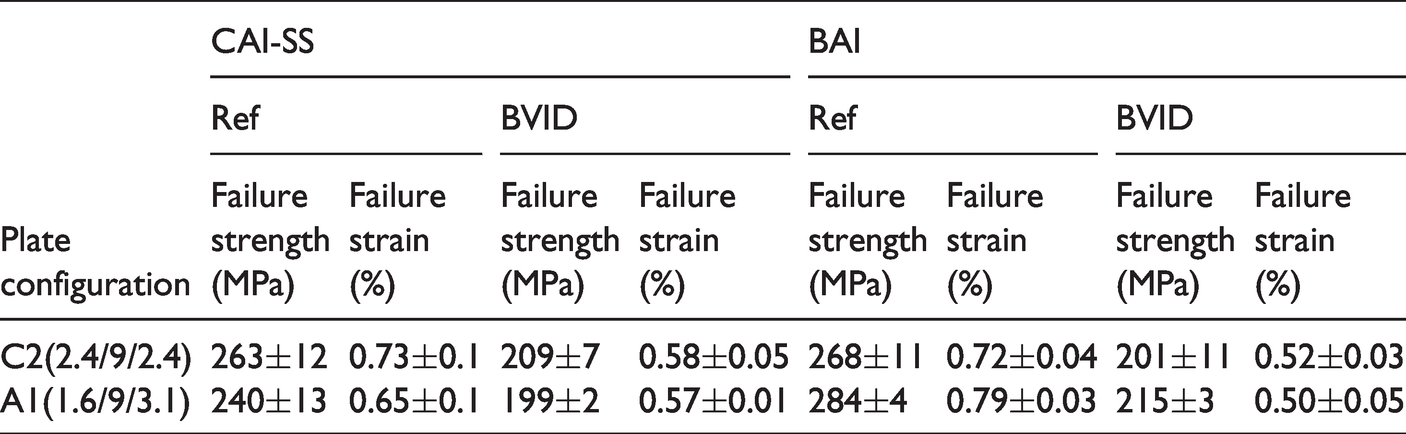
A comparison between CAI-SS and BAI test results, both for reference and BVID specimens, is presented in Table 13. The strength of the compressed face-sheets in the BAI specimens is calculated from equation (4), assuming homogenised face-sheet properties from CLT. Results are presented both for a symmetric (C2) and an asymmetric (A1) configuration. In the symmetric configuration, both the estimated strength and strain at failure are reasonably similar from the two test methods. However, in the asymmetric case, the BAI test method indicates a higher strength than the CAI-SS test. It should be noted that this is a result for the thinnest face-sheet for which it is suspected that the CAI-SS test underestimates the strength. The result from the thinner face-sheets in the BAI test is actually at par with the strength of the thickest face-sheet as given by the CAI-SS test. The strain at failure of the reference A1 configuration in the BAI test is also substantially higher than for other cases. However, just as in the CAI-SW tests, the strain at failure for impacted (BVID) specimens is lower in the BAI tests than in the CAI-SS tests. Similarly as in the CAI-SW tests, the strength estimates do not take any loss of stiffness in the impacted face-sheets into account, which might explain the apparent inconsistency between estimated strengths and measured strains at failure. For the C2 configuration no statistically sound differences could be seen but for the A1 configuration the BAI tests showed substantially higher values of the compressive strength than the CAI-SS tests.
Comparison between CAI-SS and BAI test results for reference and BVID specimens.
Conclusions
The CAI-SS test method generally shows high compressive strength and strain at failure and is relatively easy to evaluate. It thus appears to be most suitable for post-impact damage tolerance assessment of the sandwich panels at hand. However, the choice of test method should also depend on the application. For finite plates with significant impact damage, the CAI-SS test method is definitely recommended for post impact strength assessment. For damage assessment of large sandwich panels with relatively small impact damages, the residual strength obtained from the CAI-SW test method might however be more relevant since it includes effects of panel asymmetry generated from the impact damage.
In all three test methods, the impacted sandwich specimens failed in compression, with fibre fracture and delaminations being the prominent damage mechanisms. The failures initiated in the vicinity of the impact damage and grew across the width of the impacted face-sheet, perpendicular to the loading direction, until final failure.
The CAI-SW test method showed a bypass load effect due to compression of the intact back face-sheets, whereas the CAI-SS test method could more directly measure the true residual strength of the impacted face-sheets. There were no indications of significant induced bending in any of the CAI tests from the DIC recordings.
The CAI-SS test method was used to study the effect of face-sheet thickness on the residual strength of sandwich panels, containing three different levels of impact damage in three different face-sheet thicknesses. The post-impact strength from the CAI-SS tests decreased quite consistently with increasing impact energy and a linear trend-curve provides a fair indication of the residual strength for all tested configurations.
The BAI test results showed similar strength for the C2 configuration and higher for the A1 configuration, when compared to the CAI-SS results. The BAI test method may thus be recommended as an alternative to CAI for damage tolerance assessment. However, quite long specimens are required in order to assure compressive failure in the tested face-sheet, making the tests both demanding and expensive. On the other hand, lower load levels are required to break the specimens and in addition, there is less need for precise machining of BAI specimens and results with low scatter can be obtained with less effort in that respect.
A finite element model, including progressive damage mechanisms, was used to simulate the post impact residual strength from the CAI-SS and CAI-SW tests for the different configurations. The numerical model predicted both the post impact strength and the failure modes with good accuracy. The model also predicted the by-pass load effect very well for the CAI-SW specimens and gave support for the proposed analytical expression for by-pass load estimates.
Footnotes
Declaration of conflicting interests
The author(s) declared no potential conflicts of interest with respect to the research, authorship, and/or publication of this article.
Funding
The author(s) disclosed receipt of the following financial support for the research, authorship, and/or publication of this article: This work has been performed with support from VINNOVA (Swedish Governmental Agency for Innovation Systems) under the 6th National Aeronautical Research Program (NFFP6) project DAMTISS, coordinated by GKN Aerospace, Sweden.