
Abstract
Although several studies have been performed, the compression after impact (CAI) failure of CFRP is still not entirely understood. It is still unclear what sequence of events determines the onset of failure in CAI tests and how the different damage modes are involved in this process. To experimentally investigate this matter, the present work relies on acoustic emission (AE) monitoring and advanced acoustic signal analysis. A series of preliminary tests was conducted to correlate damage modes with recorded acoustic waveforms. Four types of waveforms were separated and associated to different damage modes. Following the preliminary tests, AE was monitored in actual CAI tests. A damage accumulation study was conducted combining three indicators, namely wavelet packet components, sentry function and energy b-value. The results evidence different phases in the damage accumulation process that were not shown in previous literature. In all specimens, the onset of the unstable damage accumulation appeared to be triggered by an intermediate frequency acoustic event associated to a combination of matrix cracking and fiber-matrix debonding, occurring at 80% of failure displacement.
Introduction
Thanks to their high specific stiffness and strength, carbon fiber reinforced polymers (CFRP) have been massively introduced in aircraft design over the past decades. However, persisting knowledge gaps concerning the residual strength after impact force the manufacturers to include expensive testing campaigns in the certification process. In addition to that, in situ assessment of the impact damage severity for non-tested scenarios is extremely difficult.
Every airplane will eventually face impacts of various magnitudes during its operational life. For this reason, the impact damage tolerant design of all the exposed surfaces is a necessary condition for safety.
Laminates of unidirectional CFRP plies are often preferred to metal alloys due to their enhanced in-plane specific strength, but are also known to behave poorly if subjected to out of plane dynamic loading. Low velocity impacts (LVI) in particular, can produce a complex damage envelope, marked on the surface by a small dent, and internally by matrix cracks, delamination and possibly fiber fracture.1,2 This scenario, referred to as barely visible impact damage (BVID), is the most concerning for design and maintenance, combining low detectability with a substantial compressive strength degradation.
Having identified this criticality, previous research targeted the experimental investigation of the compression after impact (CAI) failure in the presence of BVID.3–6 Thanks to these valuable contributions, it was possible to observe the two predominant failure modes present in CAI: namely unstable delamination propagation triggered by local buckling of sub laminates5,6 and fiber kinking in areas of stress concentration. 3 A common obstacle to all the tests was the difficulty to observe the damage state, which progresses internally to the structure and, close to final failure, very rapidly. Because of this challenge, two major knowledge gaps still exist.
The first knowledge gap concerns the damage accumulation process. As the applied compression stress is increased, local stress concentrates at the geometrical discontinuities introduced by BVID, potentially leading to the propagation of the preexisting impact damage. Arumugam et al. 7 observed acoustic emission (AE) activity associated with the formation of damage from a relatively low stress in CAI tests. Bull et al. 6 stopped a CAI test at near failure stress and, by performing computed tomography scans, observed that consistent delamination propagation already took place. These observations all indicate that damage propagation indeed starts before the stress level we currently define as ‘CAI ultimate strength’. It is still unclear however, which damage modes are active during this first phase, what is the interaction between them and what is their effect on the strength degradation.
The second knowledge gap concerns final failure. Once the critical load is reached, damage propagates extremely fast in the form of unstable delamination propagation and fiber kinking. Although the two predominant failure modes are known, there is no consensus about which one determines the onset of the final failure. 8 It is also unclear how the interaction between them is regulated by the pre-existing impact damage geometry (see, e.g. ref. 9) or by the properties of the resin. 10
To experimentally investigate this matter it is imperative to rely on a monitoring technology capable of detecting the different damage modes as soon as they occur during the test. Over the past decades, AE monitoring emerged as a promising passive, non-destructive, structural health monitoring (SHM) technique. When a sudden stress redistribution takes place inside a material, like in case of the propagation of a crack, acoustic waves are generated. Acoustic activity can be monitored using piezo-electric sensors, which convert surface oscillations of the material into voltage signals.
Different source mechanisms result in different acoustic signals. Hence signal analysis is potentially capable of separating the different damage modes. AE signals in CFRP usually appear in the form of a burst of duration <1 ms, releasing power in a frequency band between 10–1000 kHz. To characterize AE signals, time domain descriptors like peak amplitude, rise time, counts and duration, and frequency domain descriptors like peak frequency, centroid frequency, weighted peak and partial power have often been used. 11 Modeling of acoustic wave propagation in CFRP 12 suggests that frequency parameters are less sensitive to the source to sensor distance. For this reason, they are preferable for damage mode identification. 13 Once features are extracted, separation of damage modes can be performed using unsupervised or supervised machine learning algorithms. 11 Unsupervised clustering provides an optimal number of clusters without requiring a priori knowledge about the damage modes. Supervised classification instead requires a series of tests to establish an empirical relationship between damage modes and recorded waveforms. Different clustering and classification algorithms have been applied to separate damage modes in CFRP in case of double cantilever beam (DCB) tests,14,15 tensile tests, 16 buckling tests, 17 bending tests 16 and indentation tests. 18 More recently wavelet packet transform (WPT) has been adopted for damage mechanism identification in case of LVI. 19
Despite the numerous studies concerning damage mode separation in CFRP, only little attention has been given to CAI tests. Experiments have been conducted to separate damage mode in glass fiber reinforced polymers (GFRP). 20 Arumugan et al. 7 performed CAI tests on cross ply CFRP and provided a damage mode separation purely based on peak frequency. More recently Saeedifaar et al. 21 compared different unsupervised clustering algorithms to separate damage modes in CAI of woven CFRP using peak frequency as feature. The above mentioned studies dealt with woven and cross-ply CFRP, hence the damage modes may differ from layups of unidirectional plies of CFRP. There is a lack of literature regarding the study of damage accumulation and final failure in CAI tests in laminates of unidirectional plies of CFRP. The few existing studies, did not target the separation of damage modes.
The aim of the present research was to apply advanced acoustic signal processing techniques to gain a better understanding of the processes of damage accumulation and final failure in CAI loading. In particular, the goal was to identify the relative contribution of different damage modes during different stages of the process.
First we conducted a series of preliminary tests to correlate damage modes to AE waveforms. Following those, we conducted three CAI tests to study damage accumulation and the repartition of damage modes.
In the preliminary tests, three damage modes were isolated, namely pure matrix cracking, fiber matrix debonding and fiber failure. The damage accumulation study was conducted combining three indicators, namely wavelet packet components, sentry function and energy b-value.
Since the preliminary tests showed that damage modes occupy distinct frequency bands, wavelet packet components were used to quantify the occurrence of damage modes during CAI tests. The sentry function was used to relate the applied work with the energy dissipated via AE. Energy b-value was selected as an indicator of the occurrence of high versus low acoustic energy events throughout the test.
By combining information from the three indicators, it was possible to identify and explain phases of damage accumulation and final failure that were not identified in previous experiments.
Experiments
Materials and manufacturing
Toray M30SC – Deltapreg DT120-200-36 UD was manually laid-up in
Impact test
Impact testing was conducted using a drop-weight tower according to ASTM D7136.
22
The test set up is shown in Figure 1(a). The support fixture has a cut-out of 125 ± 1 mm in the length direction and 75 ± 1 mm in the width direction. To prevent the occurrence of multiple impacts, the impact tower was equipped with a catcher triggered by optical sensors. A hemi-spherical impactor with a diameter of 16 mm and a mass of 4.8 kg was used. A target impact energy of 34 J was used in all the impacts. This condition can be classified as LVI and produced a dent depth <2 mm (BVID). After the impact, the size of delamination was measured by ultrasound inspection. (a) Impact test setup with catcher to avoid bounce-back of the impactor; (b) ‘Front’ view showing two DIC cameras pointed at the CAI setup; (c) ‘Back-side’ view of the CAI setup with the two AE sensors positioned inside their holders.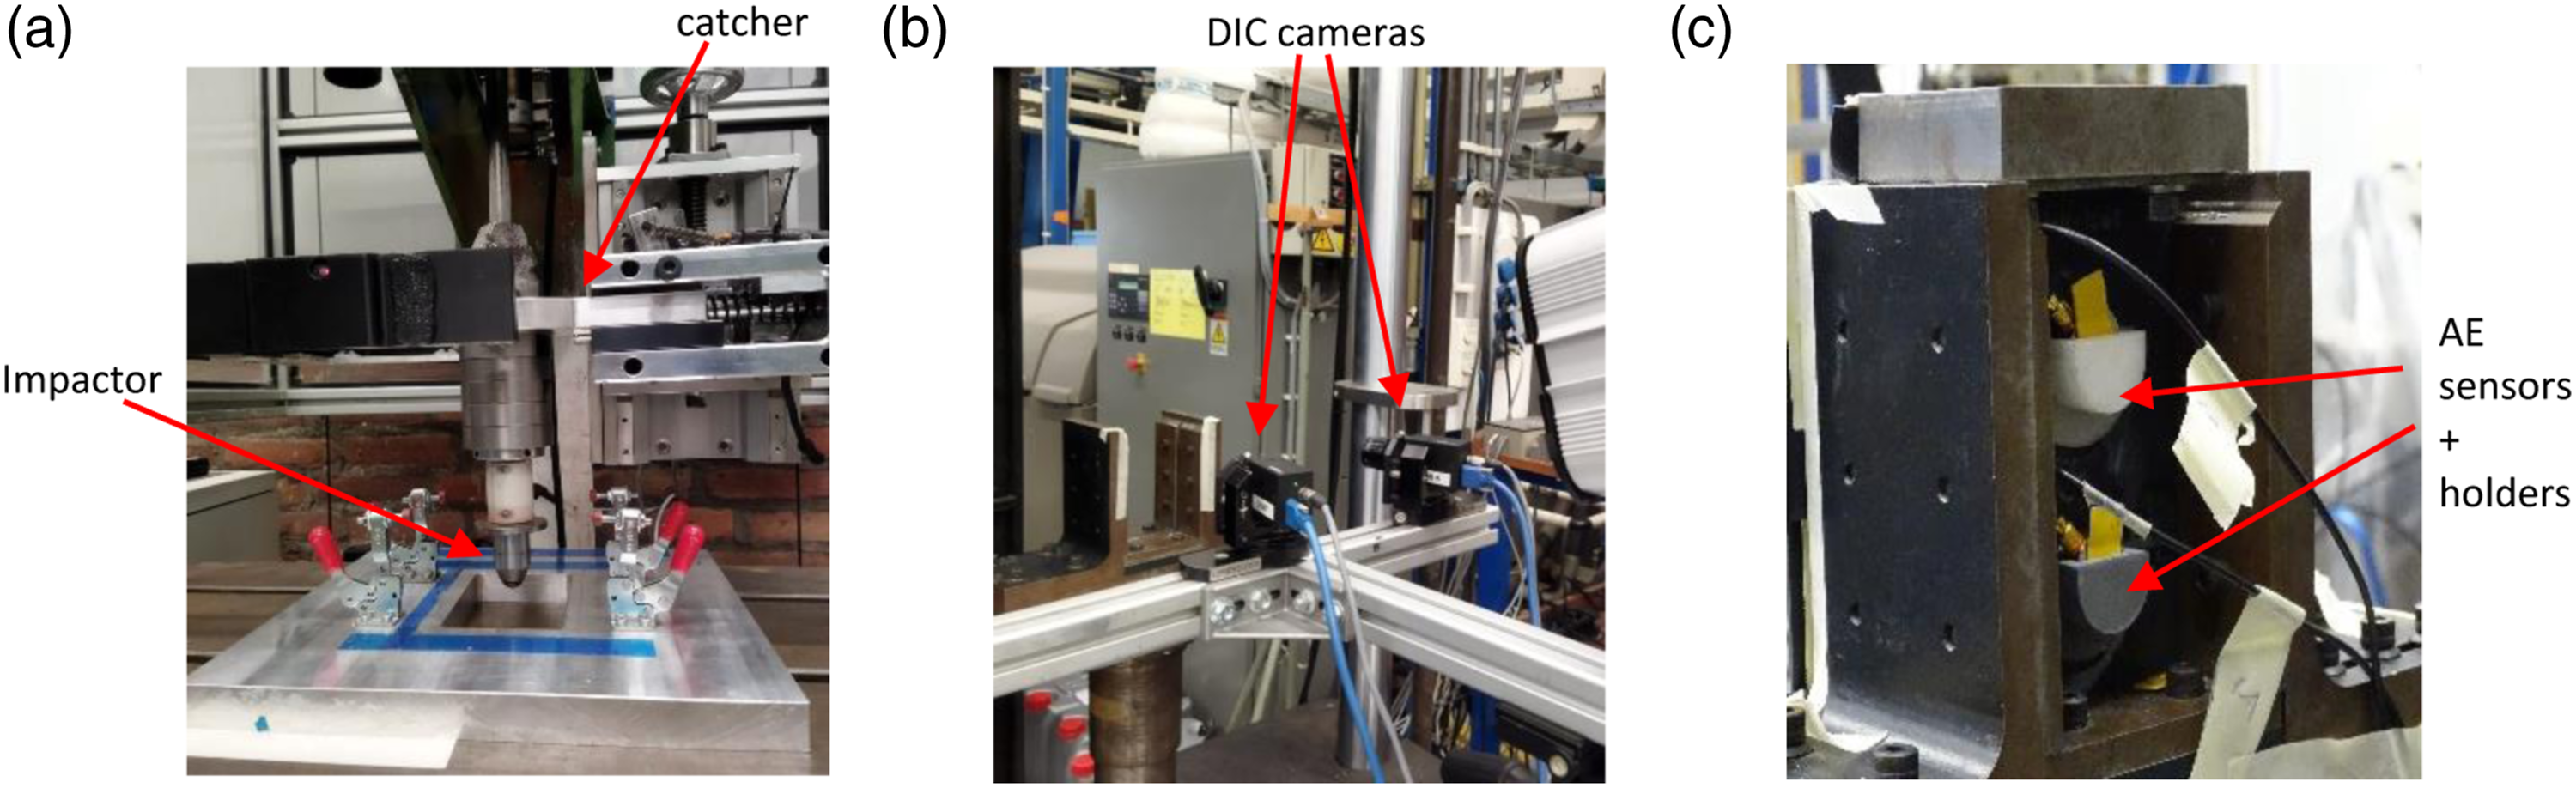
Compression after impact
CAI testing was conducted according to ASTM D7137. 23 The test set up is shown in Figures 1(b) and (c). Specimens were loaded in compression, in a displacement-controlled mode, with a cross head displacement of 1 mm/min. The crosshead displacement and the applied force were recorded using a 250 kN load-cell MTS hydraulic testing machine. Digital image correlation (DIC) was used on the impacted side of the specimen while the AE sensors (Acoustic Emission) were placed on the back side.
Digital image correlation
To verify the absence of global buckling in the CAI tests, a three-dimensional DIC system was used. The system consisted of two nine MP “Point Grey” cameras with ‘Tamron’ 25 mm lenses. The speckle pattern images were captured by ViC-Gauge 3D software with an acquisition rate of one frame per second (fps). Afterwards the images were processed using ‘ViC-3D 8’ software. Since the DIC was only used to verify the absence of global buckling, the results won’t be shown in this paper, to preserve space.
Acoustic emission
The AE events of specimens during the CAI tests were recorded by using two AE sensors placed on the back side of the specimen. The used AE sensor was the AE1045SVS900M, a broadband single-crystal piezoelectric transducer with operational frequency range of 100–900 kHz supplied by Vallen Systeme GmbH. In addition, an external 34 dB pre-amplifier was used to amplify the recorded signals. To reduce noise, an acquisition threshold was set to 45 dB. The AE data was collected with a sampling frequency of 2 MHz by the AMSY-6 Vallen, 4-channel AE system. Ultrasound gel was applied to improve the coupling between the AE sensor and the specimen’s surface. The two sensors were kept in position using plastic sensor holders glued to the non-impacted surface of the specimen. The performance of the AE system was validated before each test by conducting a standard pencil lead break procedure.
Acoustic emission analysis
In the following sections aspects of the AE analysis are covered. First, an introduction concerning continuous wavelets and wavelet packets is provided to the reader. Then the strategy used to filter damage AEs from noise and friction is described. Next, the preliminary tests for damage mode separation are discussed. Finally, the strategy used for the damage accumulation study in quasi-static CAI is introduced.
Wavelets
AE signals have the form of bursts releasing power in specific frequency bands. A simple time domain analysis doesn’t show the predominant frequencies, while the Fourier transform fails to capture the transient nature of the phenomenon, since all the time information is lost. For this reason, a time-frequency analysis method is the preferred tool to characterize AE signals.
In the present work, the Morlet continuous wavelet transform was applied to study different damage modes during the preliminary tests and obtain the maximum time-frequency information. Then Daubechies wavelet packet transform was used to analyze CAI data in order to reduce the computational costs. More details about the theory of wavelets can be found in the appendix and in Ref. 24.
Noise and friction cancellation
Acoustic signals recorded during tests are always affected by noise. In addition to that, there are acoustic sources that are not related to the formation of damage, like the friction between crack surfaces or signals generated by the text fixtures. Signals coming from damage are assumed to be burst-type signals, rising and decaying in a very short time, while friction is assumed to be a more ‘continuous’ type of signal. As a consequence, if a wavelet transform is applied, signals caused by damage are expected to have high coefficients concentrated in specific time windows and frequencies. On the other hand, friction signals are expected to have lower coefficients occupying a larger time window. Finally, noise is expected to have low wavelet coefficients randomly distributed in the time-frequency domain.
Considering the above, a filtering strategy composed of three stages was adopted. First, a maximum amplitude threshold for the acquisition was set to 45 dB. This threshold was selected due to a relatively high noise level during the test. It must be considered however that adopting a 45 dB filter could cut out some micro cracking events, which could affect the reported repartition between damage modes. The analysis of the waveforms recorded with this setting, revealed a low frequency (60 kHz) continuous-type signal (Figure 2), which we associated with friction. Considering this, a high pass filter allowing only frequencies >70 kHz was applied. Then, a four level discrete wavelet packet filter was applied using Daubechies 32 wavelets, setting an hard threshold at 10% of the maximum coefficient. As can be seen in Figure 2, thanks to the application of the two consecutive filters, it was possible to effectively remove acoustic energy that was not related to damage from the recorded signals. Comparison of different filtering strategies.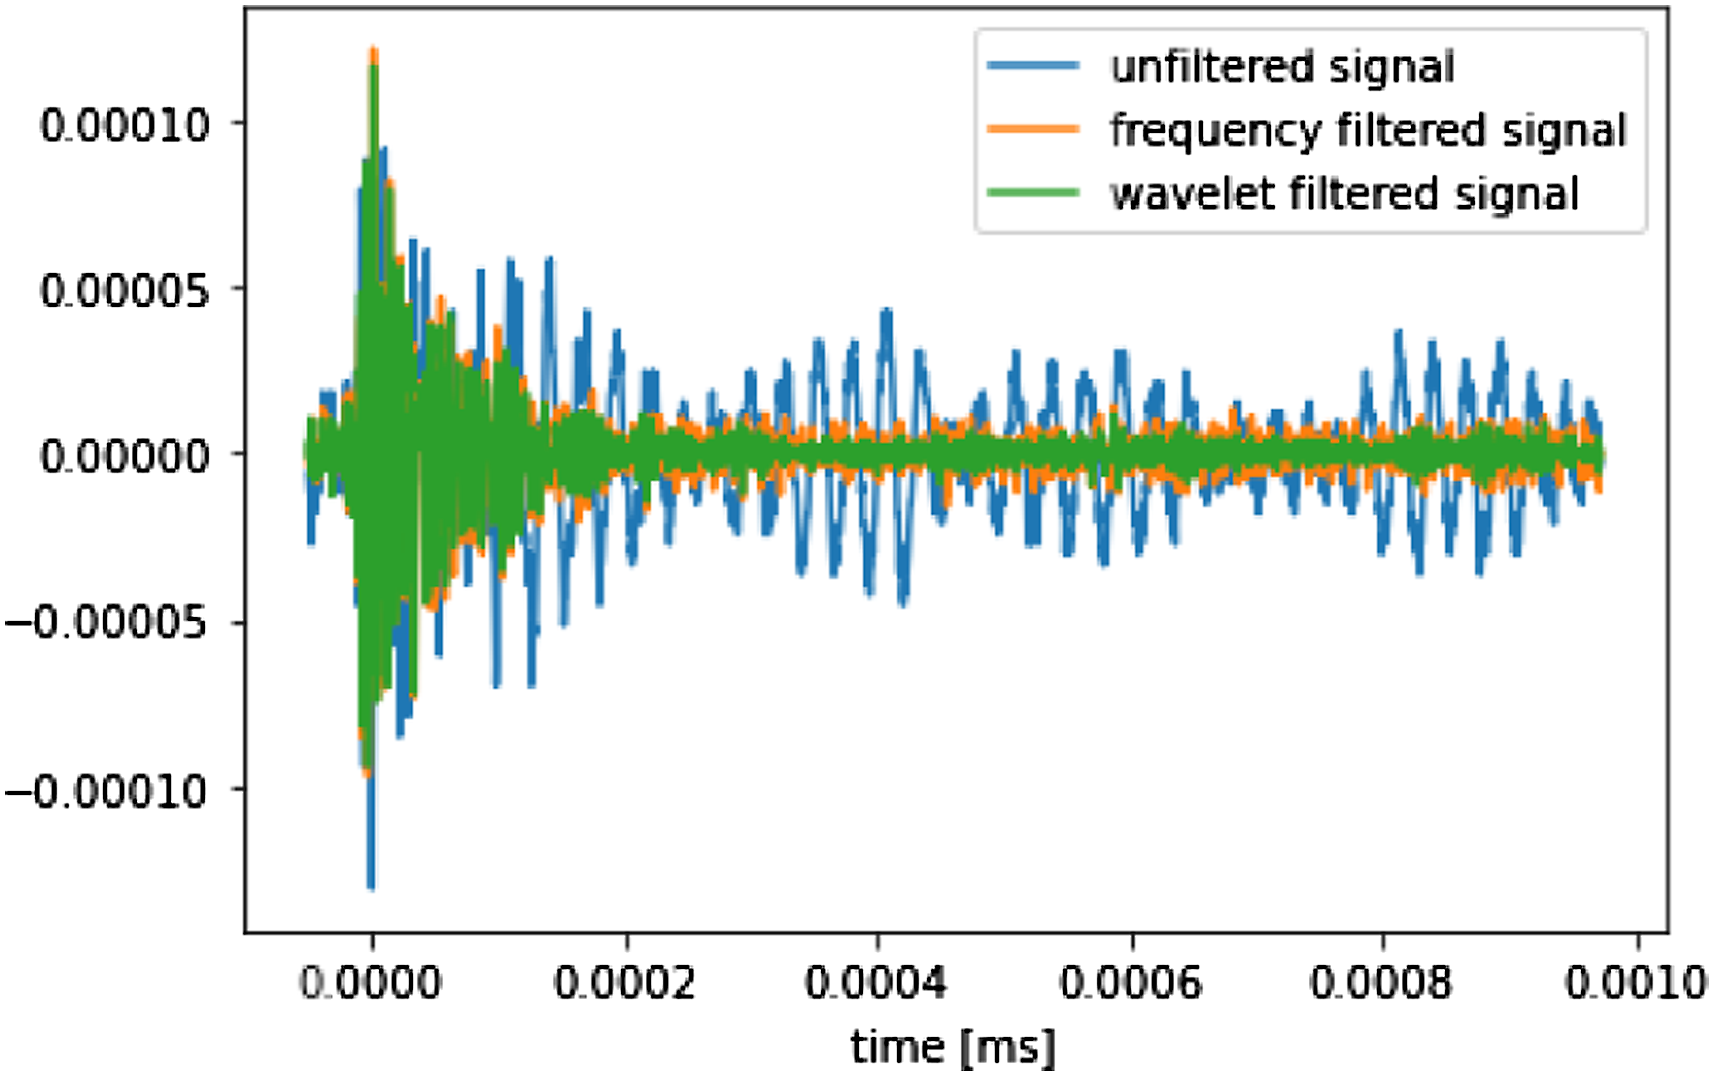
Preliminary tests and damage mode separation
The following preliminary tests were conducted to correlate acoustic waveforms to damage modes: - [90] test; a rectangular specimen of dimensions 135 × 100 × 3.8 mm and layup - [0] test; a rectangular specimen of dimensions 110 × 85 × 1.8 mm and layup - Teflon test; a rectangular specimen of dimensions 120 × 90 × 2.5 mm and layup
The recorded AE waveforms were analyzed using Morlet continuous wavelet using the tool PyWavelet.
25
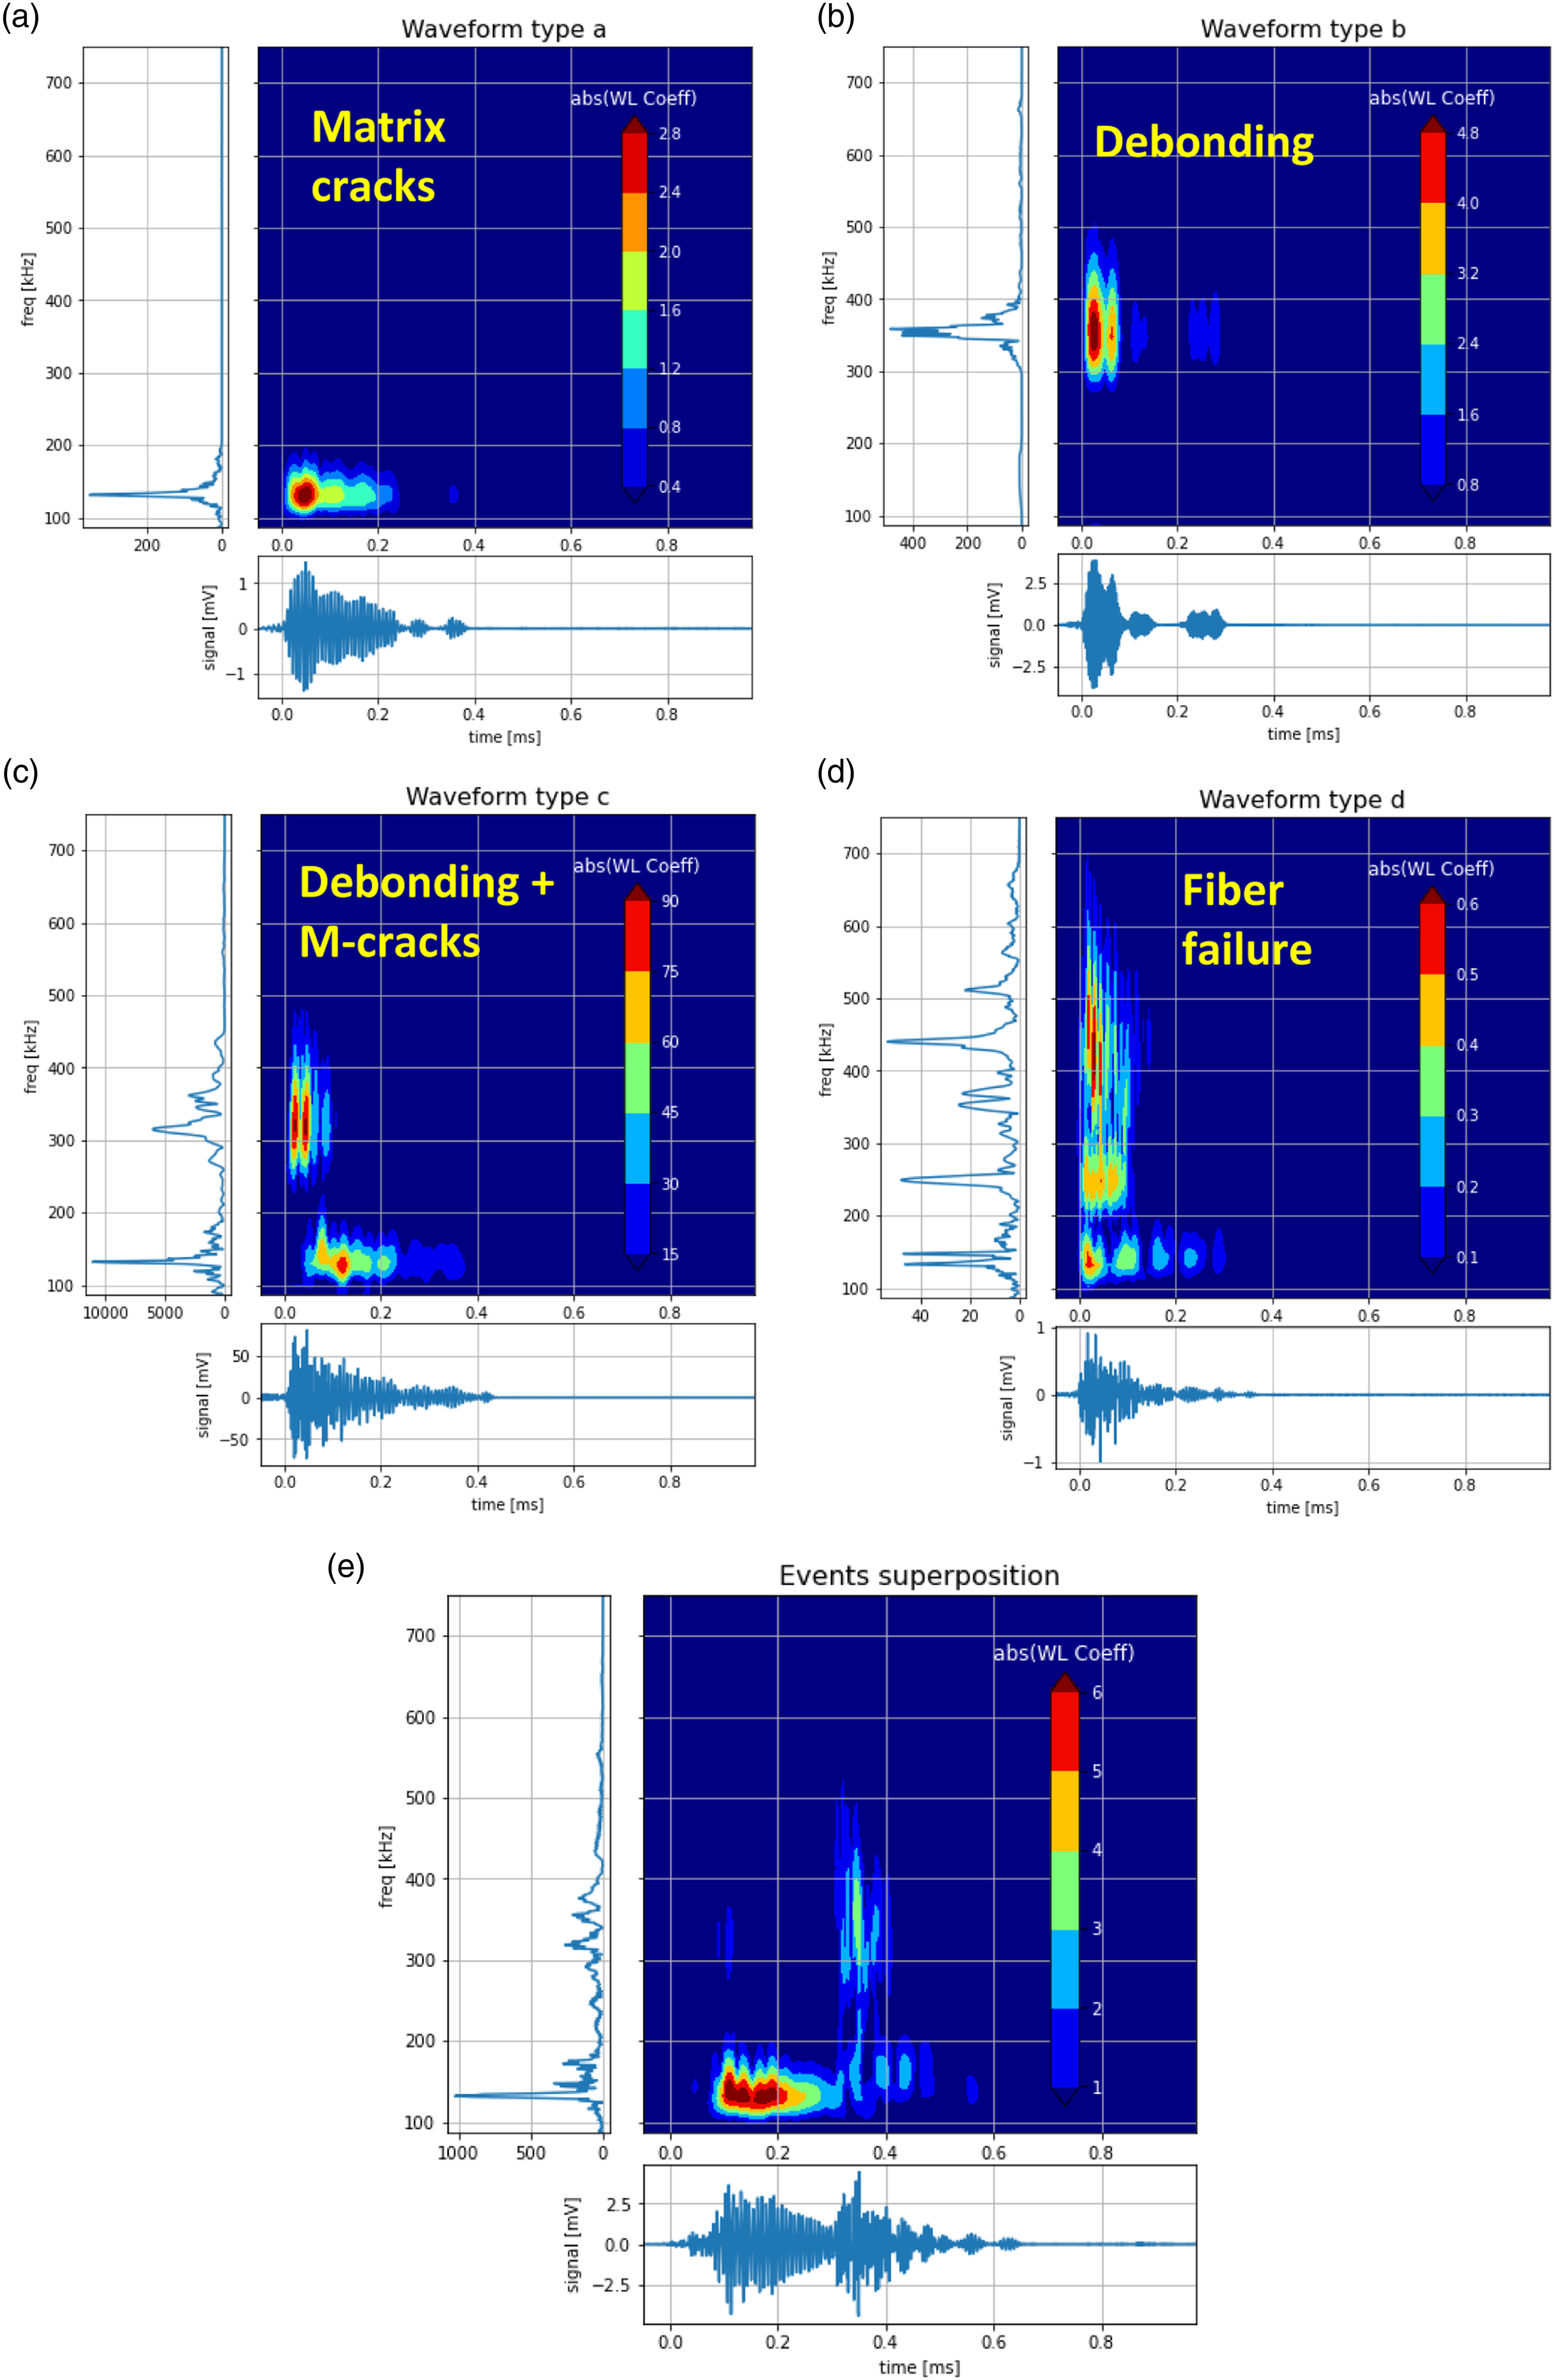
The transformed AE data was visualised using scalograms. Four main waveform types could be identified, as shown in Figure 3. - Type a) is characterized by low frequency (100–200 kHz) and long duration. It was present in tests [0], [90] and Teflon, but was predominant in [90] test. For this reason we associated this waveform with pure matrix cracking. A different tensile campaign also associated matrix cracking with low frequency events,
26
and numerical modeling of AE sources
12
confirms this assumption. - Type b) is characterized by an intermediate frequency (250–400 kHz) and by a shorter duration. This type of waveform was present in [0] test and Teflon-test and more rare, (but still present) in [90] test. Considering this, we associated this waveform to fiber matrix-debonding. In a previous experimental tensile campaign debonding was also associated with intermediate frequency events,
26
and numerical modeling of AE source
12
seems to confirm this assumption. - Type c) appears to be a combination of waveform type a and b. It was the predominant signal in [0] test and Teflon-test, especially close to final failure, and less frequent in [90] test.
We hypothesize that this waveform could be the result of a combination of debonding and matrix cracking. A possible explanation for this phenomenon could be that, in some cases, debonding triggers matrix cracking. This could explain the apparent superposition of waveforms a and b, if the two signals arrive at the sensor almost at the same time. We must stress that this is an hypothesis made by the authors and further investigation is needed to test this hypothesis. - Type d) spectrum is characterized by several local peaks, some of them at high frequencies (450–600 kHz). This waveform was totally absent in the [90] test. In [0] test and Teflon-test, it appeared only at relatively high stress. Considering this, we associated waveform type-d with fiber failure. A previous tensile campaign associated fiber failure with high frequency events,
26
and numerical modeling of AE source
12
seems to confirm this assumption. Continuum wavelet transforms of different types of waveforms ((a)-(b)-(c)-(d)) and an example of event superposition in CAI failure (e). In the colour plots, absolute value of continuous Morlet WL coefficients are plotted in time–frequency scale. Horizontal sub-plots are the original signals aligned in the time domain. Vertical sub-plots are the Fourier spectrum of the signals aligned in frequency domain.
A number of works in the literature7,18 clustered ‘delamination-type’ AE signals based on frequency or time domain descriptors. However, in the wavelet analysis performed in the current research, no new predominant waveform was observed in test Teflon at the onset of delamination propagation (evaluated from the DIC images) with respect to [0] test and [90] test, where no delamination occurred. For this reason, no specific waveform was associated to delamination propagation. This could be explained by considering that the microstructural damage modes composing delamination are still pure matrix cracking and fiber-matrix debonding, which were present also in the other tests performed.
There was good agreement between the damage modes identified in the preliminary tests and those observed in the CAI tests. In Figure 3(e) a typical signal recorded close to CAI failure is shown. It is evident that in this case, multiple burst-signals are reaching the sensor almost simultaneously. Unsupervised clustering and supervised classification of acoustic events are based on the assumption that each waveform represents a single damage mode. Figure 3(e) shows that this assumption does not hold close to final CAI failure. This makes both unsupervised clustering and supervised classification of damage modes unsuitable for separating different damage modes close to failure, which is the region we were most interested in investigating.
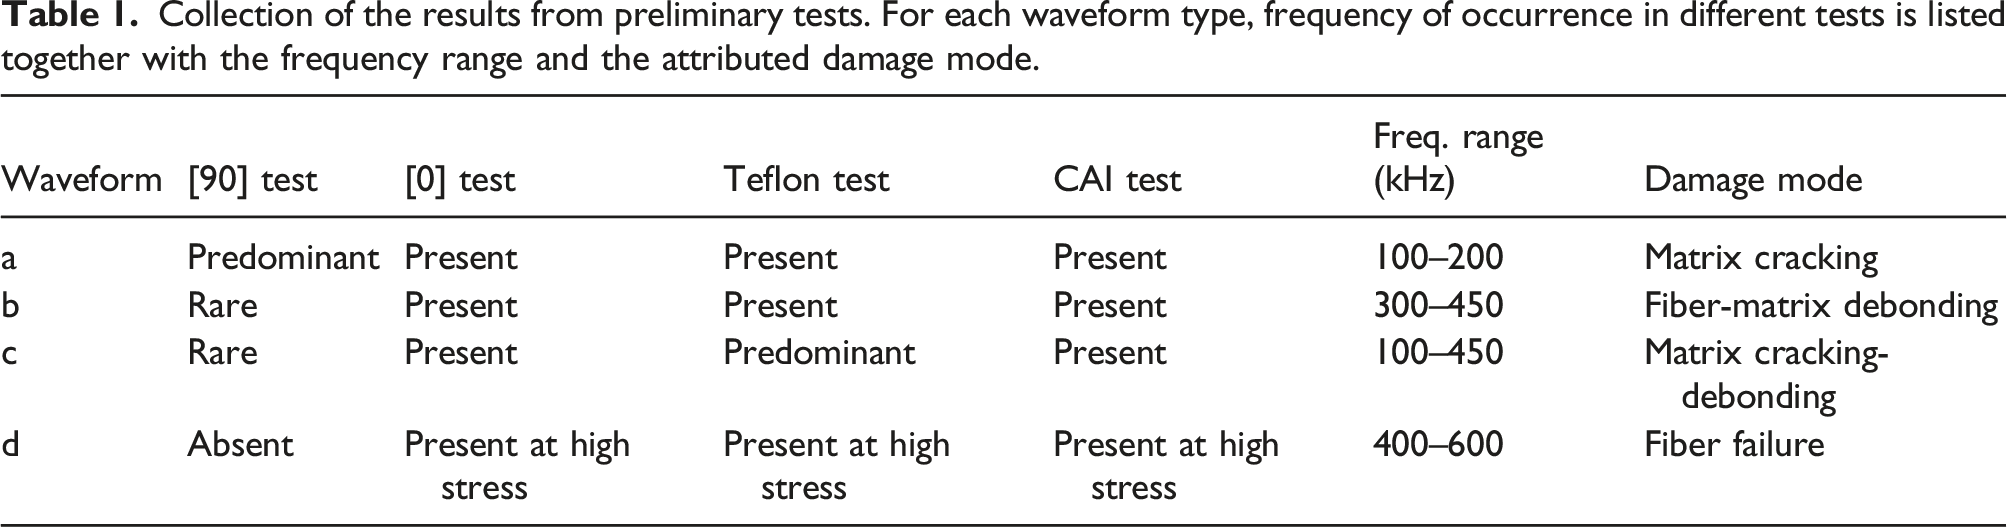
Collection of the results from preliminary tests. For each waveform type, frequency of occurrence in different tests is listed together with the frequency range and the attributed damage mode.
Damage accumulation
To study the damage accumulation process, we focused on three questions inspired by the work of Saeedifar et al.
19
: 1. How is the acoustic energy released as mechanical work is applied? Answering this question gives an indication of what fraction of applied work is being dissipated by damage formation in different stages of the test. 2. What is the relationship between high energy acoustic events and low energy acoustic events? Assuming that large scale damage generates higher energy acoustic events, analyzing question two can show how predominant the microscale and macroscale damage are throughout the test. 3. In which proportion are damage modes active during the test?
By separating the different damage modes present in the CAI test, it is possible to evaluate whether there are thresholds for their activation.
These three aspects combined provide an accurate description of the damage accumulation phase happening in CAI tests. The three questions will be individually discussed in the following subsections.
Fraction of acoustic energy release - sentry function
To answer question 1, the sentry function is used. The sentry function 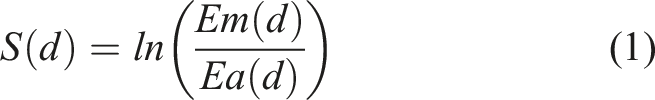
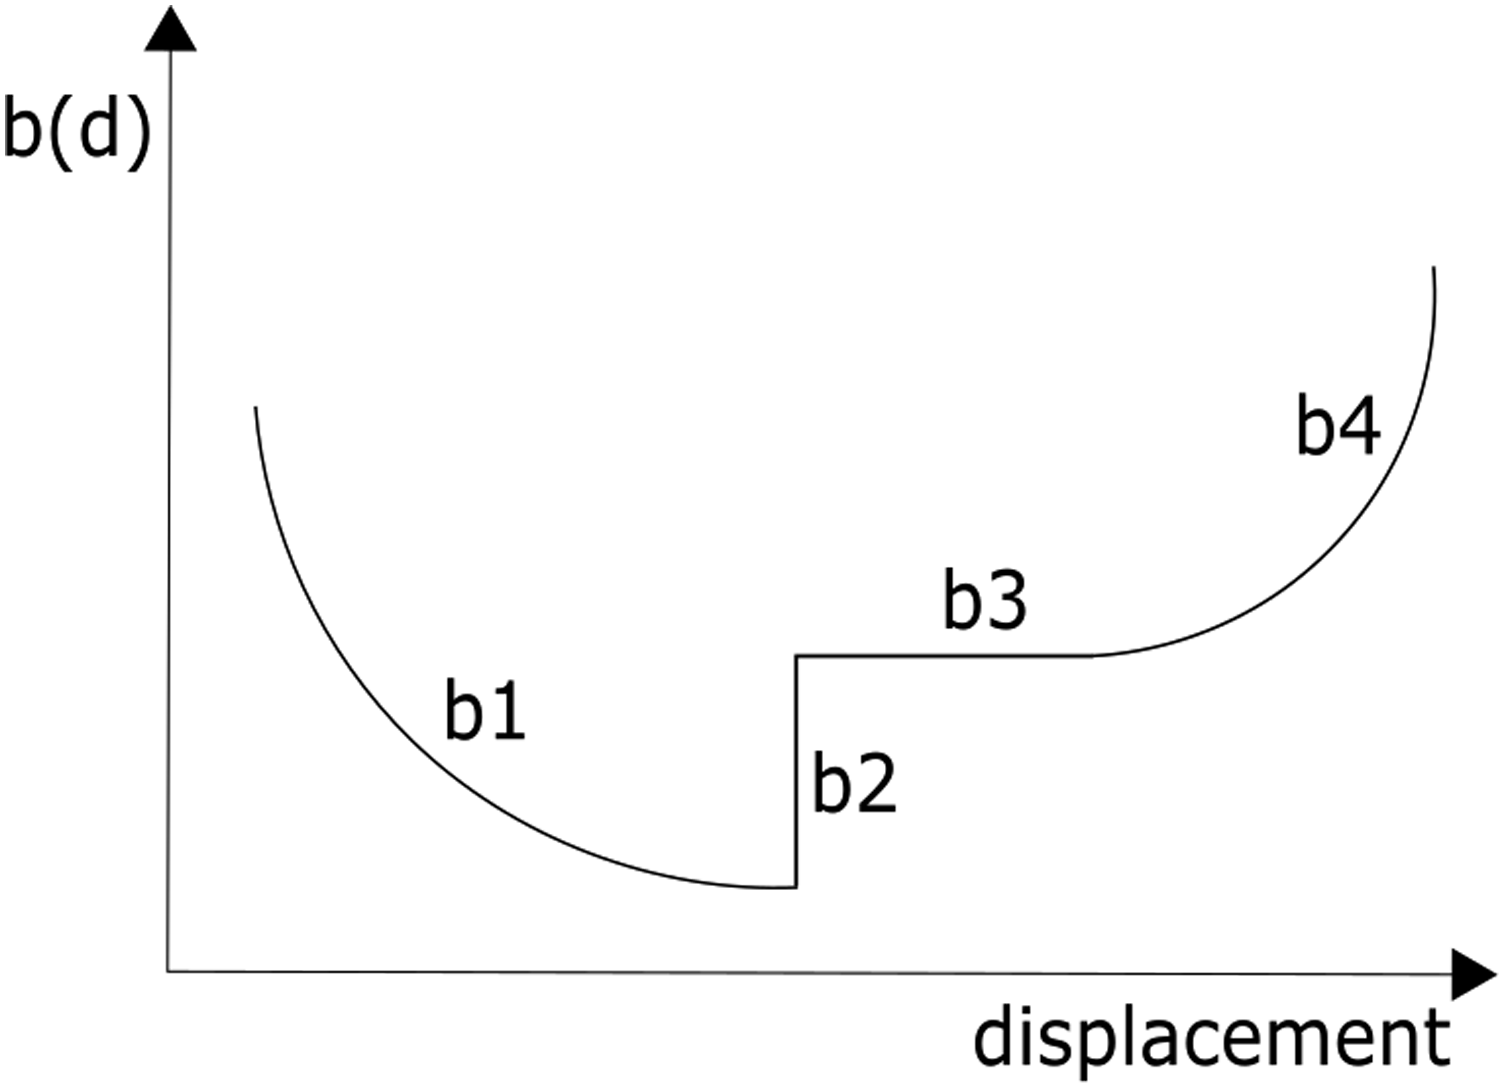
As the applied compression displacement increases linearly, different trends can be expected in the sentry function (Figure 4): increasing trend (s1) corresponds to a strain energy storing phase where mostly micro-damage is formed, this means that the capability to store strain energy is higher than the acoustic activity; sudden drop (s2) corresponds to a fast release of acoustic energy and possibly a drop in stiffness, this was associated with coalescence of micro damage leading to macro damage
19
; constant trend (s3) is a state of equilibrium between the storage of mechanical energy and the AEs activity; increasing after drop (s4) suggests that the previous event didn’t cancel the capability of the material to store mechanical energy; decreasing trend (s5) the capability to store strain energy is now less than the acoustic activity. It is important to remark that the sentry function depends both on acoustic activity and mechanical energy. For example a sudden drop (s2) could be due to an increased acoustic activity and/or a stiffness drop. Sentry function/displacement plot. The possible trends that can be found in actual test are shown.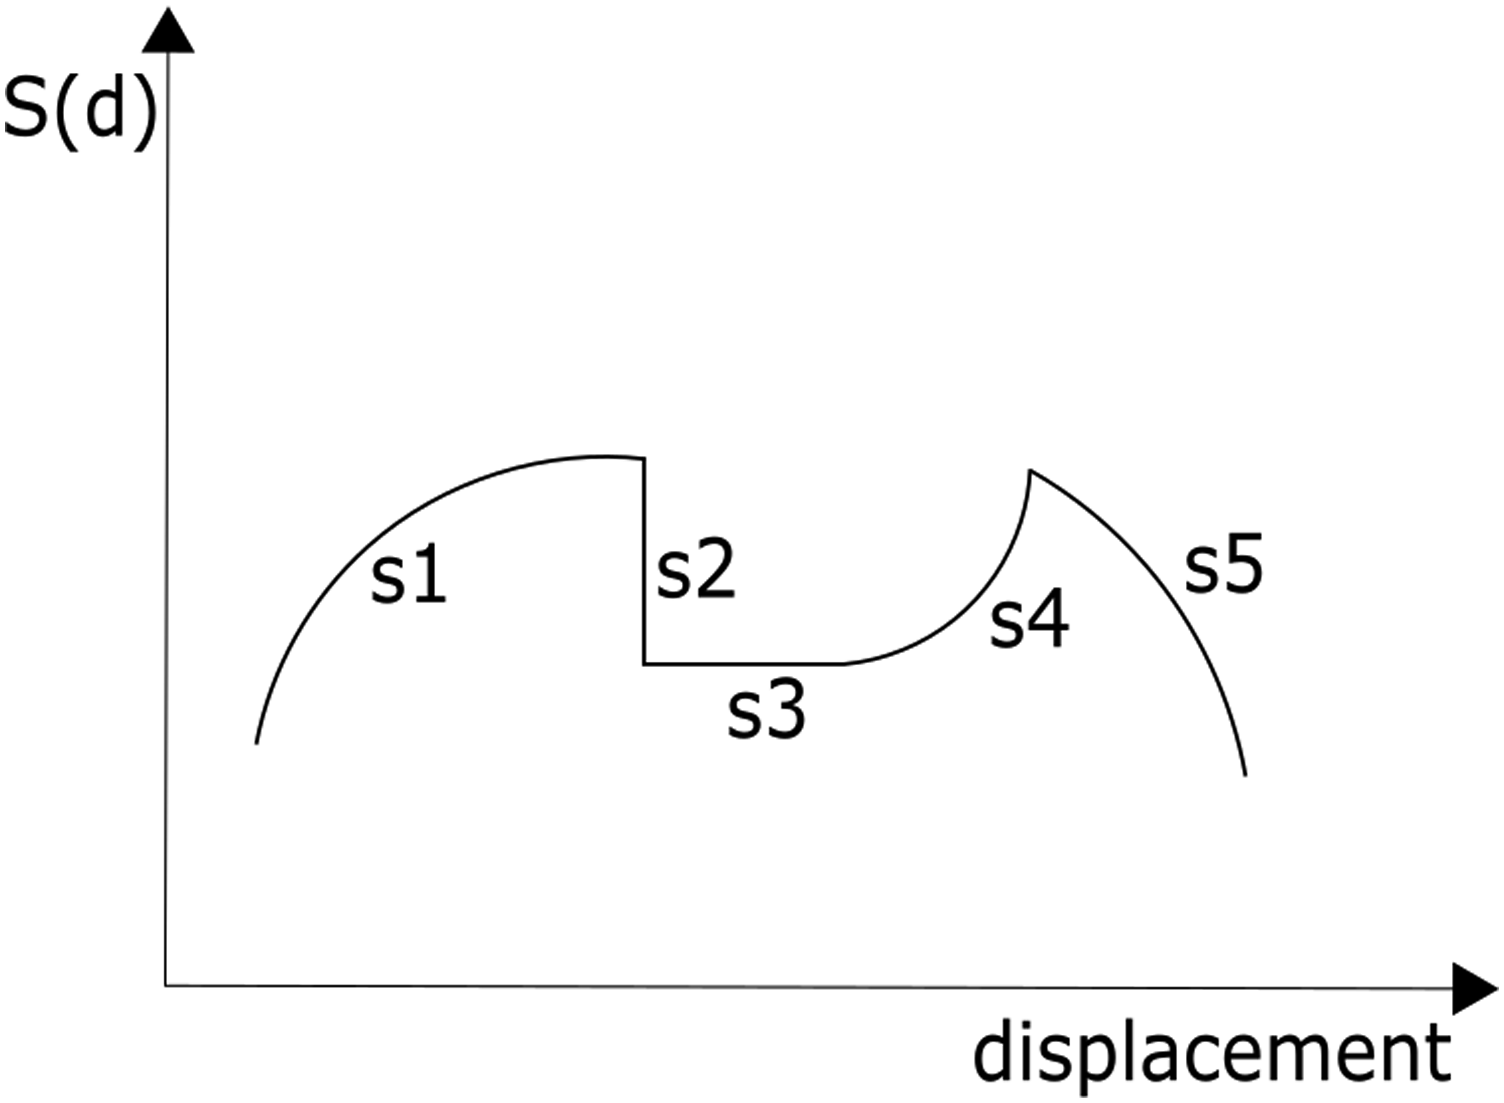
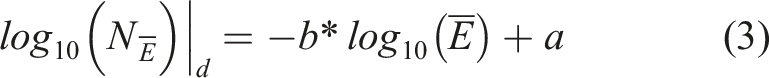
Relationship between high energy and low energy events - energy b-value
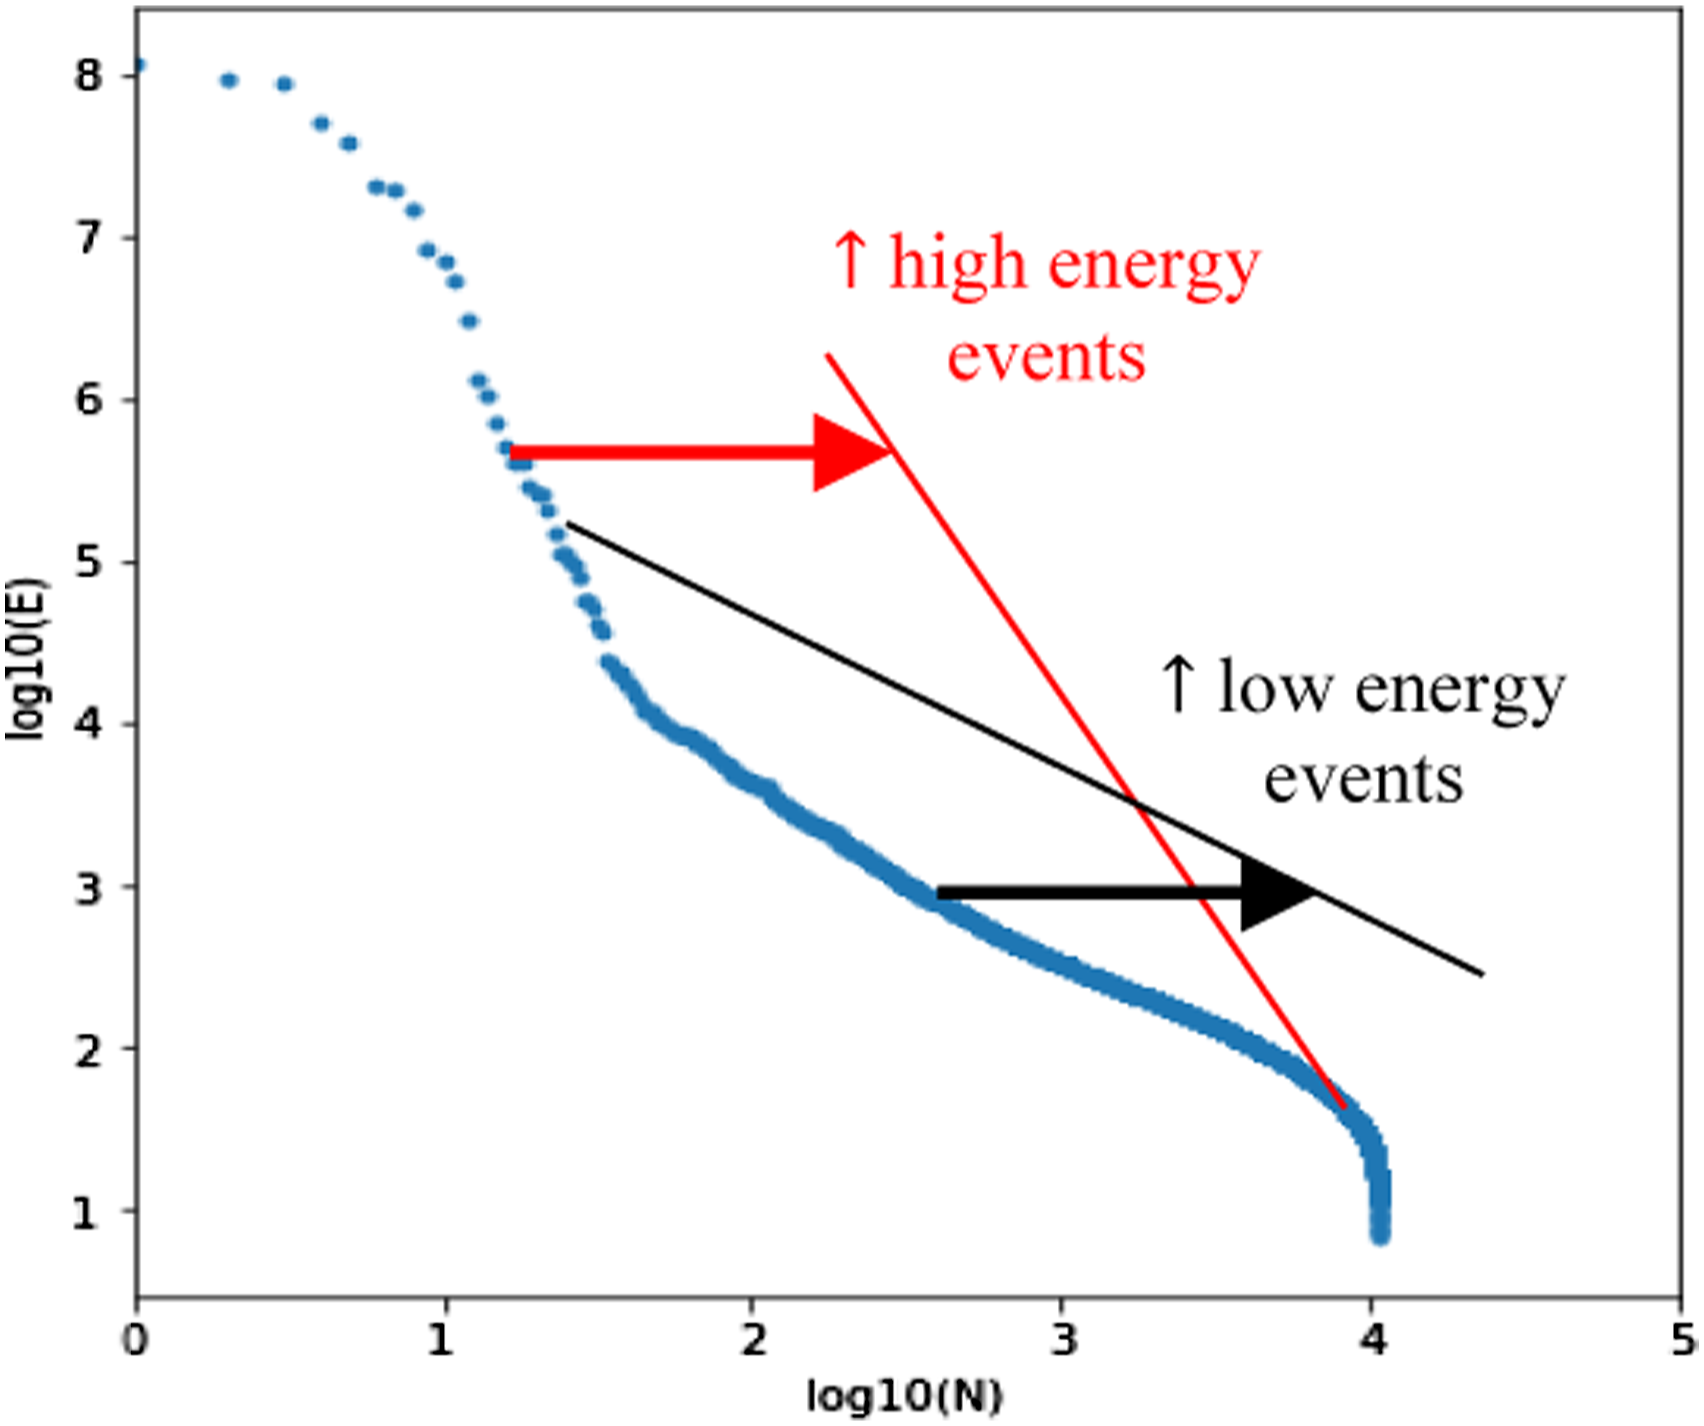
To answer question 2, a variation of the Gutenberg-Richter formula is adopted. The Gutenberg-Richter formula was introduced in seismology as the relationship between the intensity of a seismic event and its frequency of occurrence. In a logarithmic scale, this relationship is well approximated by a linear relationship. AE event occurrence versus event energy plot. In red a relative increase of high energy events is represented while in black a relative increase of low energy events is represented. b-value/displacement plot. The possible trends that can be found in actual test are shown.
Proportion of damage modes - cumulative ratio of wavelet packet components
To answer question 3, the cumulative ratio of wavelet components is proposed. As explained in the appendix, the acoustic signals can be decomposed into a number of different wavelet packets, at different levels. Now, consider the energy of the wavelet packet component n, at level j. In the compression test, waveforms are recorded at different applied values of displacement, d. For a defined level of displacement 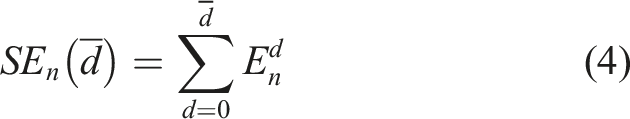
The cumulative ratio of wavelet packet components, 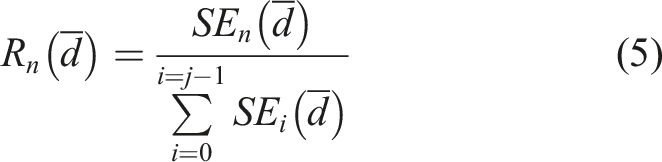
The defined cumulative ratio
The wavelet packet decomposition was performed using the code PyWavelet. 25 The selected wavelet was Daubechies 32 at decomposition level 4. In accordance to the results of the preliminary tests (Noise and Friction Cancellation), components 2–3 (62.5–187.5 kHz) were associated with matrix cracking, components 4-5-6 (187.5–375 kHz) were associated with fiber matrix debonding and components 7-8-9 (375–625 kHz) were associated with fiber failure in compression. In this way, the cumulative ratio R n could be used to quantify the relative fraction of acoustic energy associated to each damage mode. The limitation of this methodology is the partial overlap in frequencies between different damage modes as evidenced in the spectrograms (Figure 3). Regardless of this limitation, the proposed quantity expresses the relative influence of the different damage modes. In the interesting areas of the test, highlighted by the trend of the cumulative ratios, a more detailed analysis was performed using continuum wavelets to obtain a better insight of the damage mechanisms occurring in the material.
Results and discussion
Impact tests
Impact tests resulted in BVID (impact dent <2 mm) comprising multiple delaminations at different interfaces. The delamination profiles evaluated with ultrasonic C-Scan are consistent with the ones reported in the literature.
29
In Figure 7 the C-scan after impact of the three specimens is shown. As can be seen in Figure 7, a large variation in delamination size is present, especially between specimen two and the remaining specimens. Close up C-scan images of the impacted specimens, showing multiple delaminations at different depths. The images are cropped to show the full delamination; the impact contact point was always in the centre of the specimen, in accordance with ASTM D7136.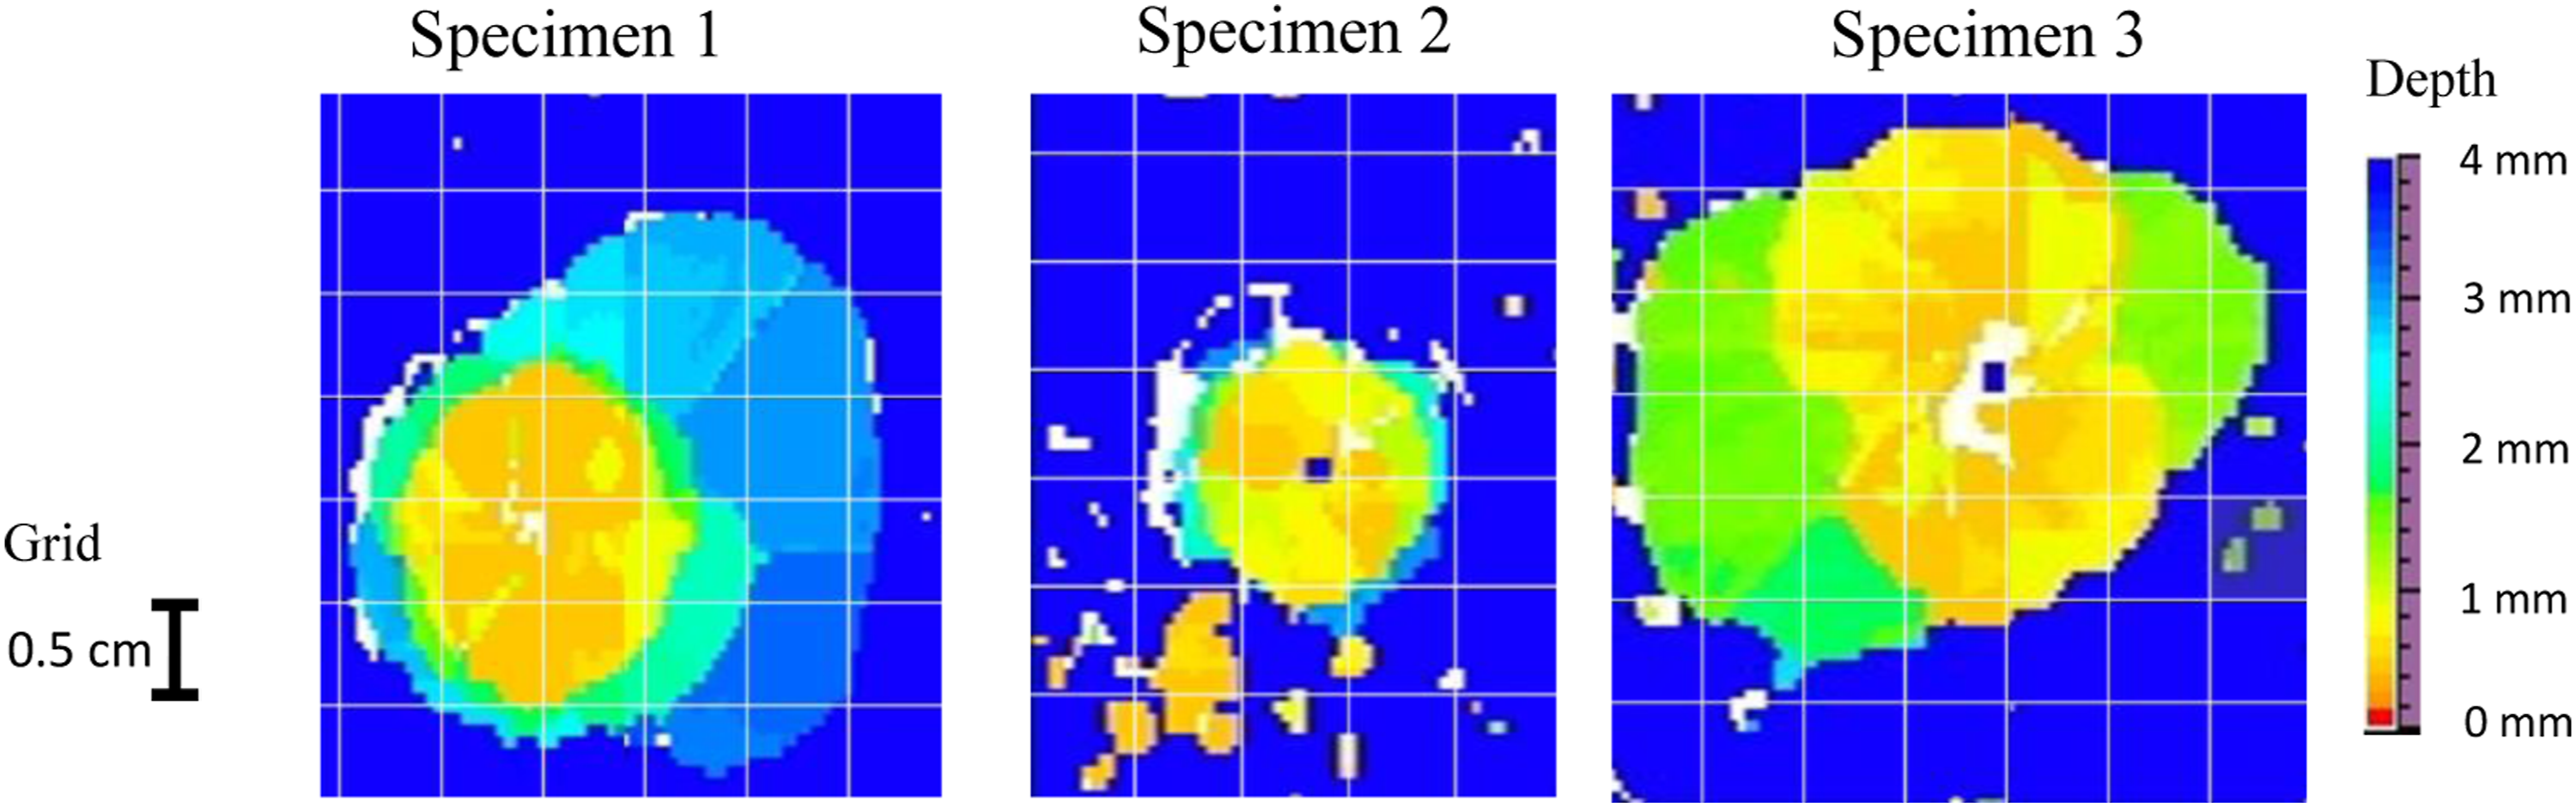
CAI tests
There is good agreement in load displacement curves between the three CAI tests (Figures 8(a1)–(a3)). The specimens showed a constant stiffness until final failure. Only in specimen two, a small drop in force is observed before failure. CAI tests of specimens 1-2-3. Images (a1)-(a2)-(a3) show the load displacement curve and the log10 of cumulative acoustic energy. Images (b1)-(b2)-(b3) show the sentry function and b-value. Images (c1)-(c2)-(c3) show damage modes repartition. The grey area indicates the stable damage accumulation zone.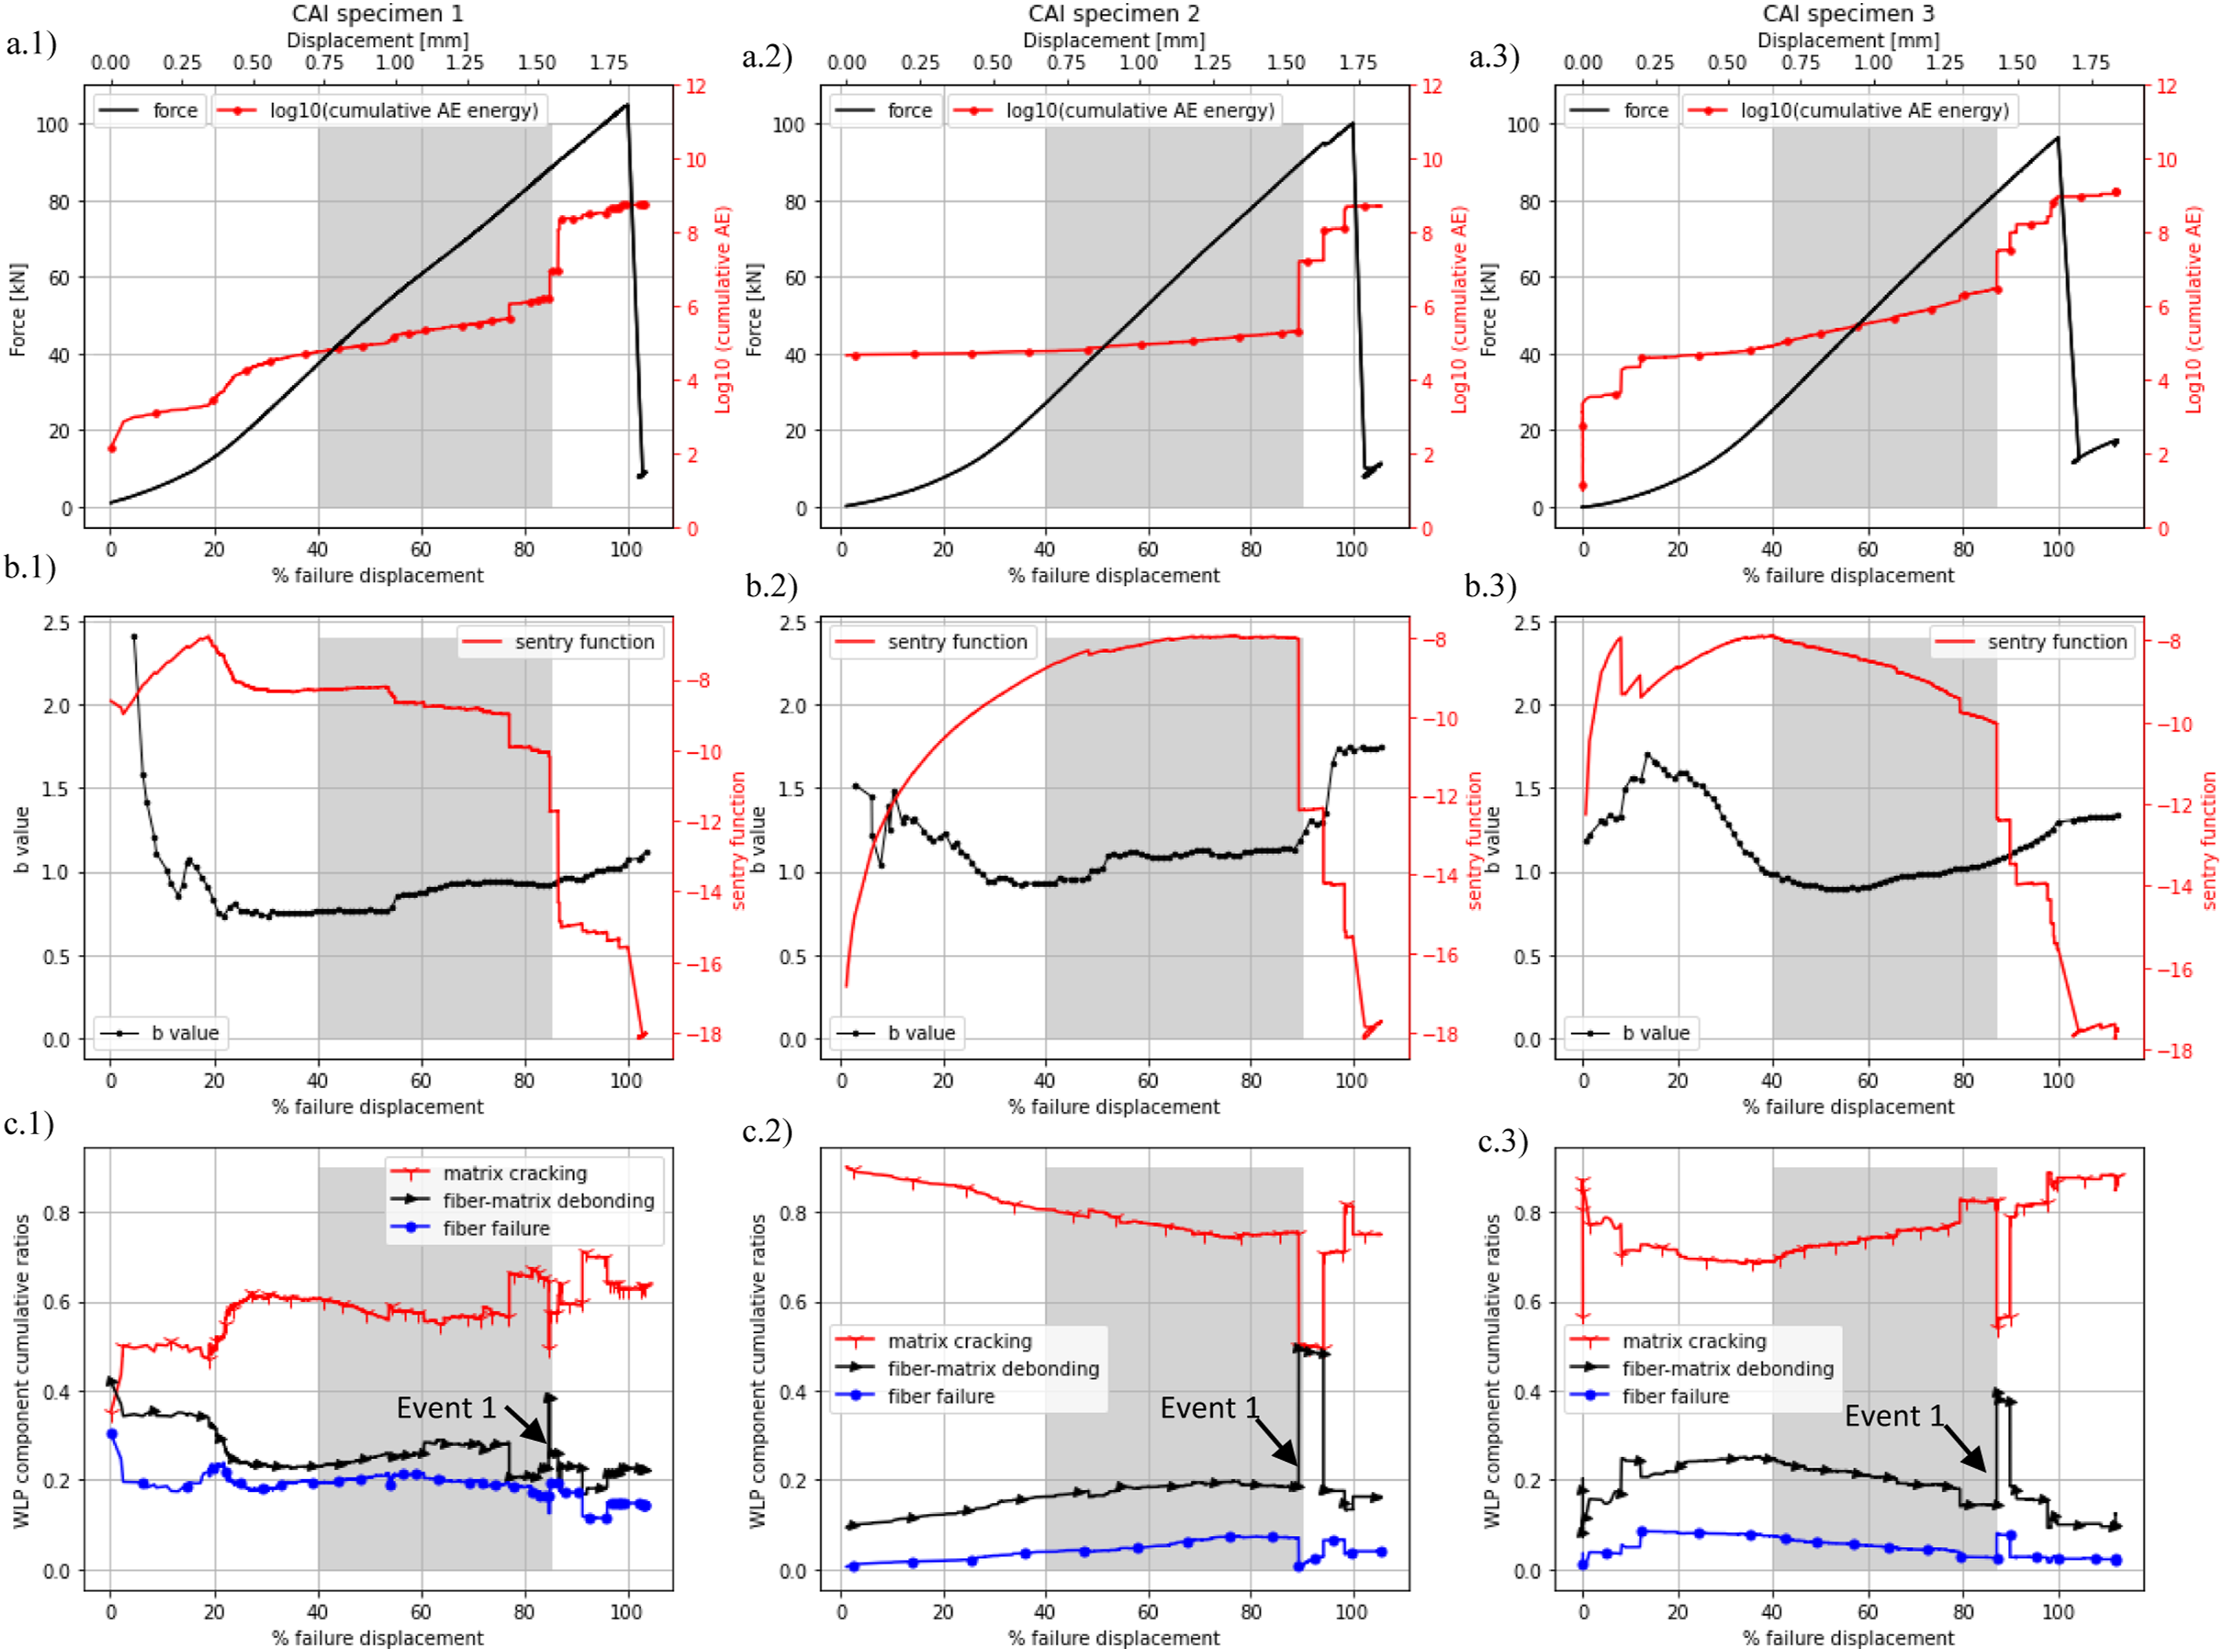
In all tests, the global buckling was successfully prevented by the lateral guides and local buckling happening in the area of impact was observed using the DIC system. In all three specimens final failure occurred from the impact location towards the lateral edges, which is acceptable according the ASTM D7137 23 standard.
Acoustic energy (measured in attoJoule) was released from the beginning of the test (Figures 8(a1)–(a3)). This early release of acoustic energy can be explained by the presence of a large impact damage, causing high local stress at the geometrical discontinuities, even at relatively low applied stress. In all three specimens there is a phase of steady accumulation of damage, where the cumulative AE energy appears to be linear in the logarithmic scale. After that, all tests show a sudden increase of cumulative AE energy, starting after 80% of CAI failure displacement, suggesting that an unstable mechanism could be triggering the increase of acoustic energy released (Figures 8(a1)–(a3)). It is noteworthy that this event was not accompanied by a noticeable drop of stiffness in any of the specimens.
Combining the Sentry function, b-value and wavelet ratios, three phases can be individuated in damage accumulation, namely damage stabilization, stable damage accumulation and unstable damage accumulation.
Damage stabilization
In all the specimens, a first phase of increase of sentry function is observed (Figures 8(b1)–(b3)). This can be attributed to a phase of strain energy storing and relatively low acoustic activity. Although damage is accumulated, as proven by the cumulative acoustic energy (Figures 8(a1)–(a3)), it does not degrade the capability to store mechanical energy, since no change in the global stiffness is observed. During this phase a decrease of the b-value is observed (Figures 8(b1)–(b3)). This suggests that mostly micro-damage is propagating during this phase, since AE energy is released in the form of many low energy events. During this phase, damage mode fractions are chaotic and there is no good agreement between the different specimens (Figures 8(c1)–(c3)). To explain this, it must be considered that wavelet ratios are cumulative quantities (equations (4) and (5)). A single fiber fracture happening at the beginning of the test, has more effect on the wavelet cumulative ratios compared to the same event happening at the end of the test. At the beginning of the test, all damage modes can potentially happen in weak areas of impact damage. Due to the stochastic nature of initial impact damage, no good agreement is found between the different tests. However, as the test goes on, the results converge towards a similar repartition between damage modes in different specimens.
Stable damage accumulation
After the initial increase, the sentry function flattens (spec-1,2) or starts a gradual decrease (spec-3). Sometimes in the literature a constant sentry function was associated with stiffening mechanisms occurring in the materials, like fiber bridging in DCB tests. 19 However, there is no evidence of stiffening mechanisms happening in the present CAI tests, even though a constant sentry function is observed.
During this phase, no drops are observed in the load displacement curve, suggesting that the material is still efficiently storing strain energy. An overall increase of the acoustic activity is observed during this phase and cumulative acoustic energy has a linear trend in the logarithmic plot (Figures 8(a1)–(a3) grey area).
In all the specimens a constant trend is observed in the b-value (Figures 8(b1)–(b3)). This means that the relative frequency of occurrence of the high energy peaks and low energy peaks does not change during the test as acoustic energy is progressively released.
The damage modes repartition evaluated with cumulative ratios of wavelet packet components, remains stable and assumes similar values in the different tests (Figures 8(c1)–(c3)). It can be observed that during this phase matrix cracking is the predominant damage mode but debonding is still not negligible in terms of energy dissipation.
In conclusion, a phase of damage accumulation is observed between 50%–80% of failure displacement, where the nature of damage accumulation in terms of acoustic energy of the events (b-value) and repartition between damage modes (wavelet ratios) is stable and similar between different specimens.
Unstable damage accumulation
In all the specimens, the end of the stable damage accumulation is determined by a significant and sudden increase of the released acousic energy (Figures 8(a1)–(a3)). It is interesting to observe how this damage event has appearently no effect on the residual stifness. This suggests that residual compressive stiffness does not provide a good indication of the integrity of the structure in the case of CAI loading. The sudden release of acoustic energy results in a large drop in the sentry function. While there is no drop in stiffness, and therefore the specimen remains capable of storing mechanical energy, the continued decrease of the sentry function indicates a much larger portion of the additional work performed beyond the 80% displacement is absorbed by failure mechanisms, rather than stored as strain energy. The stepwise increase of the AE cumulative energy (Figures 8(a1)–(a3)) and stepwise decrease of the sentry function (Figures 8(b1)–(b3)) shows that the final failure indeed proceeds in an unstable ‘stick-slip’ type manner.
During this phase an increase in b value is observed in all the specimens, meaning that new hits come in the form of relatively high energy events (Figures 8(b1)–(b3)). This indicates that larger scale damage is now formed, compared to the previous phase of the tests.
In all the tests the unstable phase onset is determined by a sudden increase of the wavelet component associated to debonding (intermediate frequency event). The event causing this change is called here ‘event 1’ and was studied in more detail using a continuum wavelet analysis (Figure 9). By looking at the scalogram in Figure 9, it is evident that the event one in all three tests looks very similar and can be classfied as waveform type c (cf. Figure 3(c)), which we attributed to a combination of debonding and matrix cracking. In all tests a second event was observed, releasing a large amount of energy in the matrix cracking frequency range. After these events, the damage mode fraction evolution (as a function of displacement) largely differs in the different specimens. It must be considered that wavelet packet ratios must not be taken as an exact repartition between damage modes, since there are overlaps in the spectrum of the different waveform type (Figure 3) but they can be useful to analyze trends in the damage accumulation. Continuous Morlet wavelet plot of event one in the three specimens.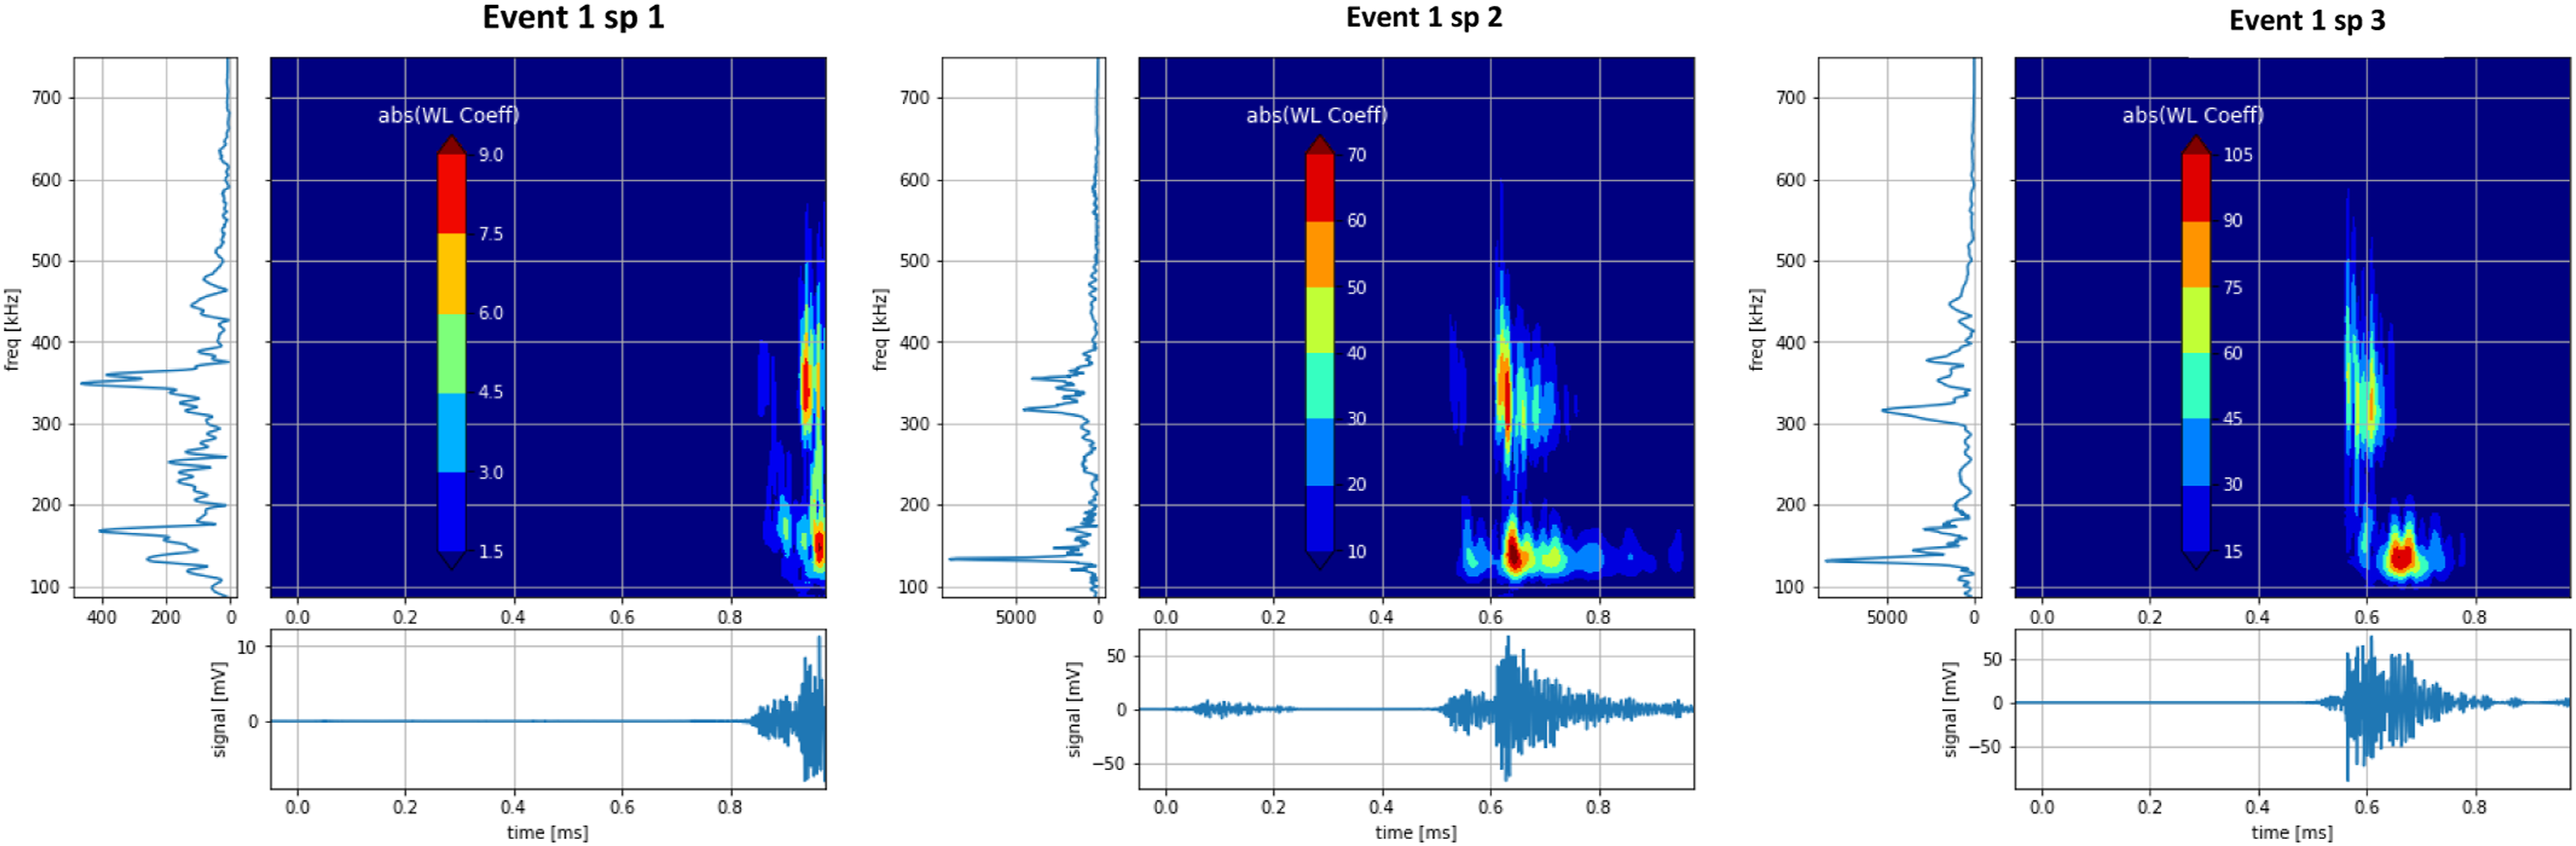
The numerical study of CAI failure by Yang 9 suggested that the CAI failure mode (delamination vs fiber kinking) could be highly dependent on the initial impact damage configuration. The high variability of the initial impact damage (Figure 7) together with the variability registered in damage mode repartition close to CAI failure suggests that this hypothesis formulated by Yang may be correct.
Conclusions
A methodology was developed for using AE data to gain insight into the damage mechanisms occurring during CAI loading.
First, a series of preliminary tests was conducted to isolate AE signals of damage modes in layups of unidirectional plies of CFRP. The continuum wavelet analysis showed the presence of four waveform types, which were associated to matrix cracking, fiber matrix debonding, a combination of the two, and fiber failure. Although a test was conducted to generate delamination propagation, triggered by local buckling using a Teflon insert, no new waveform type was observed compared to other compression tests, in which no delamination occurred. This suggests that in the case of a delamination the damage modes at the microscale are still matrix cracking and fiber-matrix debonding. This furthermore suggests that AE cannot differentiate between delamination and matrix cracking or fibre-matrix disbonding during a CAI test, at least using the analysis methods employed in the current research.
In order to analyze signals characterized by superposition of AE hits, wavelet packet transform components were used to analyze trends in the presence of damage modes in the CAI tests. This approach was justified by the separation in frequency between damage modes observed during the preliminary tests.
To analyze AE events a strategy for damage accumulation combining sentry function, energy b-value and cumulative ratios of wavelet packet components was adopted, leading to the following conclusions: - Stiffness is not a good indicator of structural integrity in CAI; there is evidence of a large accumulation of damage in the absence of significant drops in the load–displacement curve. - Combining the information of b-value, Sentry function and wavelet ratios, it is possible to identify and explain three different phases in the damage accumulation, namely: damage stabilization, stable damage accumulation and unstable damage accumulation. - During the stable phase, the different specimens showed similar qualitative wavelet packet ratio trends in the CAI tests, regardless of the different initial impact damage shapes. - In all specimens the onset of unstable damage accumulation appears to be triggered by an intermediate frequency acoustic event, here associated to a combination of debonding and matrix cracking, occurring at 80% of failure displacement. - A large variability is observed in damage mode repartition from the onset of the unstable phase, suggesting that failure modes may differ largely from specimen to specimen, possibly linked to the variation in initial impact damage.
Interestingly, a similar stable damage accumulation was registered among the different specimens, regardless of the different initial impact damage. This suggests that the phase of stable growth may be less dependent on the initial impact damage configuration compared to the final failure process. This is of particular interest if we consider that this stress range (60%–80% of CAI strength) corresponds to the load range in which fatigue growth has been experimentally observed.10,30,31 Therefore, the techniques presented in this paper also appear to be promising to gain more insight into the fatigue damage growth process, a possibility that will be explored further in future work.
Footnotes
Declaration of conflicting interests
The author(s) declared no potential conflicts of interest with respect to the research, authorship, and/or publication of this article.
Funding
The author(s) received no financial support for the research, authorship, and/or publication of this article.
Data availability
The data underlying this paper is publically available for download from: “https://doi.org/10.4121/21621381.v1”. The scripts used to analyse the AE signals can be obtained from: “![]() ”.
”.