
Abstract
Objectives
The aims of the present study were to evaluate the association between serum amyloid A (SAA) concentrations and proteinuria in cats without known pre-renal, renal and post-renal causes of proteinuria and to document the magnitude of proteinuria in these cases.
Methods
Cats with contemporaneous SAA and urine protein:creatinine ratio (UPC) data and without renal azotaemia, evidence of reduced urine concentrating ability, active urine sediment, hyperthyroidism, diabetes mellitus and recent steroid administration were included. Cats with SAA concentrations above 3.9 µg/dl were classified as having increased SAA. UPC was compared between cats with and without increased SAA using the Mann–Whitney U-test, comparisons between the proportion of cases classified as proteinuric (UPC >0.4 or >0.2) between the groups were made using Fisher’s exact test, and correlations were assessed using Spearman’s correlation coefficient. Multivariable logistic regression analysis was performed to examine the association between SAA and UPC.
Results
UPC was significantly higher in the increased SAA group than in the normal SAA group (0.32 [0.11–1.25] vs 0.17 [0.08–0.59]; P = 0.002) and cats with increased SAA were also more likely to be borderline or overtly proteinuric (UPC >0.2) than cats in the normal SAA group (72% vs 36%; P = 0.02). There was also a moderate positive correlation between UPC and SAA (rs = 0.519; P <0.001).
Conclusions and relevance
Increased UPC is associated with increased SAA concentrations in cats, although the severity of proteinuria in these cases is usually mild. Systemic inflammation might contribute to proteinuria in some cats, although further studies are required to establish a causal relationship.
Plain language summary
This study aims to investigate whether cats with increased circulating concentrations of serum amyloid A are more likely to excrete greater amounts of urinary protein. We investigated this by comparing the amount of protein in the urine of cats who did not have another potential reason to have protein in their urine and that did or did not have increased serum amyloid A concentrations. Our data show that urinary protein loss is increased in cats with increased serum amyloid A concentrations, although this increase is only mild in severity. The cause of this increased protein loss is currently unknown, and future studies are needed to confirm whether inflammation leads to increased protein loss and to determine the underlying cause.
Introduction
Proteinuria can be classified as transient (physiological/functional) or, if persistent, as pathological. Pathological proteinuria can be categorised according to pathophysiology as being of pre-renal, renal (glomerular or tubular) or post-renal origin. Detection of persistent renal proteinuria in feline patients has a number of potential consequences, as it is associated with the development of renal azotaemia in initially non-azotaemic cats 1 and with a poorer prognosis in cats with chronic kidney disease (CKD).2,3 International Renal Interest Society (IRIS) staging guidelines 4 recommend measurement of urine protein:creatinine ratio (UPC) for the substaging of CKD, and antiproteinuric therapy is suggested in azotaemic cats that have persistent renal overt proteinuria (UPC >0.4).4 –6 However, renal proteinuria is usually a presumptive diagnosis after exclusion of transient proteinuria or pre- and post-renal causes of pathological proteinuria; therefore, knowledge of non-renal causes of proteinuria is clinically important.
In the anecdotal experience of our laboratory, proteinuria (based on increased UPC) can be observed in animals with increased serum amyloid A (SAA) concentrations. Although the American College of Veterinary Internal Medicine consensus statement 5 refers to functional proteinuria secondary to pyrexia, no studies have documented the prevalence or severity of proteinuria in cats with increased SAA concentrations. Hence, the aim of this study was to evaluate whether increased SAA concentrations were associated with proteinuria in cats that did not have any other known pre-renal, renal or post-renal cause of proteinuria, and to establish the prevalence and severity of proteinuria in these cases.
Materials and methods
Ethical approval was granted by the Ethics and Welfare Committee of the Department of Veterinary Medicine, University of Cambridge. Informed consent was not applicable as the data utilised were collected retrospectively. Medical records from our institution between July 2017 and September 2023 were reviewed to identify cases with available SAA data. SAA concentrations were measured on an Olympus AU480 analyser using a human immunoturbidimetric assay previously validated for use in cats. 7 The limit of blank of the assay was 0.3 µg/ml; results under 0.3 µg/ml were assigned the value of 0.3 µg/ml for statistical purposes. If multiple SAA results were available for the same patient, then only the first result was included. Cats were excluded if urinalysis was not performed within 48 h of SAA measurements. UPC is included as part of standard urinalysis in our laboratory, and SAA is included as part of the routine extended biochemistry panel. Urine creatinine concentrations were measured using the Jaffe Kinetic method, and urine total protein concentrations were measured using the pyrogallol red method on an Olympus AU480 analyser (OSR6178; Beckman Coulter). For urine creatinine concentration measurement, the settings applied on the analyser followed the manufacturer’s instructions (https://www.beckmancoulter.com/download/phxBSOSR6X7811-EN_US?type=pdf); therefore, undiluted urine was automatically diluted when urine creatinine concentrations were above the linear range of the assay 35,360 μmol/l. Urine specific gravity (USG) values above 1.050 (upper limit of scale on refractometer) were not diluted to determine the USG value, and therefore are assigned the arbitrary value of 1.050 for the purposes of statistical analysis.
Cases with known pre-renal, renal and post-renal causes of proteinuria were then excluded based on the following criteria: (1) USG below 1.035; (2) serum creatinine concentrations above the laboratory reference interval (RI) (>153 µmol/l); (3) an active urine sediment defined as pyuria (>5 white blood cells per × 100 field), haematuria (>5 red blood cells [RBCs] per × 100 field or >20 RBCs per × 100 field if cystocentesis sample) or bacteriuria; (4) hyperthyroidism, serum total thyroxine above 45 nmol/l (upper limit of laboratory RI); (5) diagnosis of diabetes mellitus; (6) glucocorticoid medication in the 30 days before sampling; (7) renal or urinary tract pathology that could be associated with proteinuria; (8) previous placement of a subcutaneous ureteral bypass (SUB) device; and (9) current or previously diagnosed systolic hypertension (>160 mmHg, although blood pressure was measured at the discretion of the attending clinician). Non-azotaemic cats with a USG below 1.035 were also excluded.
Cases were then classified based on SAA concentrations; those with SAA above 3.9 µg/ml were classified as having increased SAA concentrations, and those with SAA less than or equal to 3.9 µg/ml were classified as having normal SAA; 7 however, derivation of a laboratory-specific RI for SAA was not performed owing to the local constraints associated with sampling of healthy animals. Correlations between SAA concentrations and UPC were evaluated using Spearman’s correlation coefficient, and the Kruskal–Wallis test or Mann–Whitney U-test was used to compare UPC between the groups. The proportion of cats defined as having proteinuria (overt group defined as UPC >0.4 or borderline or overt group defined as UPC >0.2) were compared between the groups using Fisher’s exact test. Univariable logistic regression analysis was used to investigate the association between SAA and serum creatinine concentrations as continuous variables and proteinuria. Variables with a tendency towards a significant association on univariable analysis were included in a multivariable logistic regression model. Data are presented as median (minimum–maximum).
Results
A total of 278 cases were eligible for inclusion; of them, 224 were excluded because of the identification of concurrent diseases that might be associated with proteinuria. Of the 224, 153 were excluded owing to having a USG below 1.035, six cases were excluded because of increased serum creatinine concentrations (with USG >1.035), 20 were excluded as a result of an active urine sediment, 16 were excluded because of current or recent glucocorticoid treatment, 15 were excluded owing to diabetes mellitus, 10 were excluded as a result of hyperthyroidism and four cases had undergone placement of a SUB device (Figure 1). Urine cultures were performed in 32 cases and were negative in all cases.
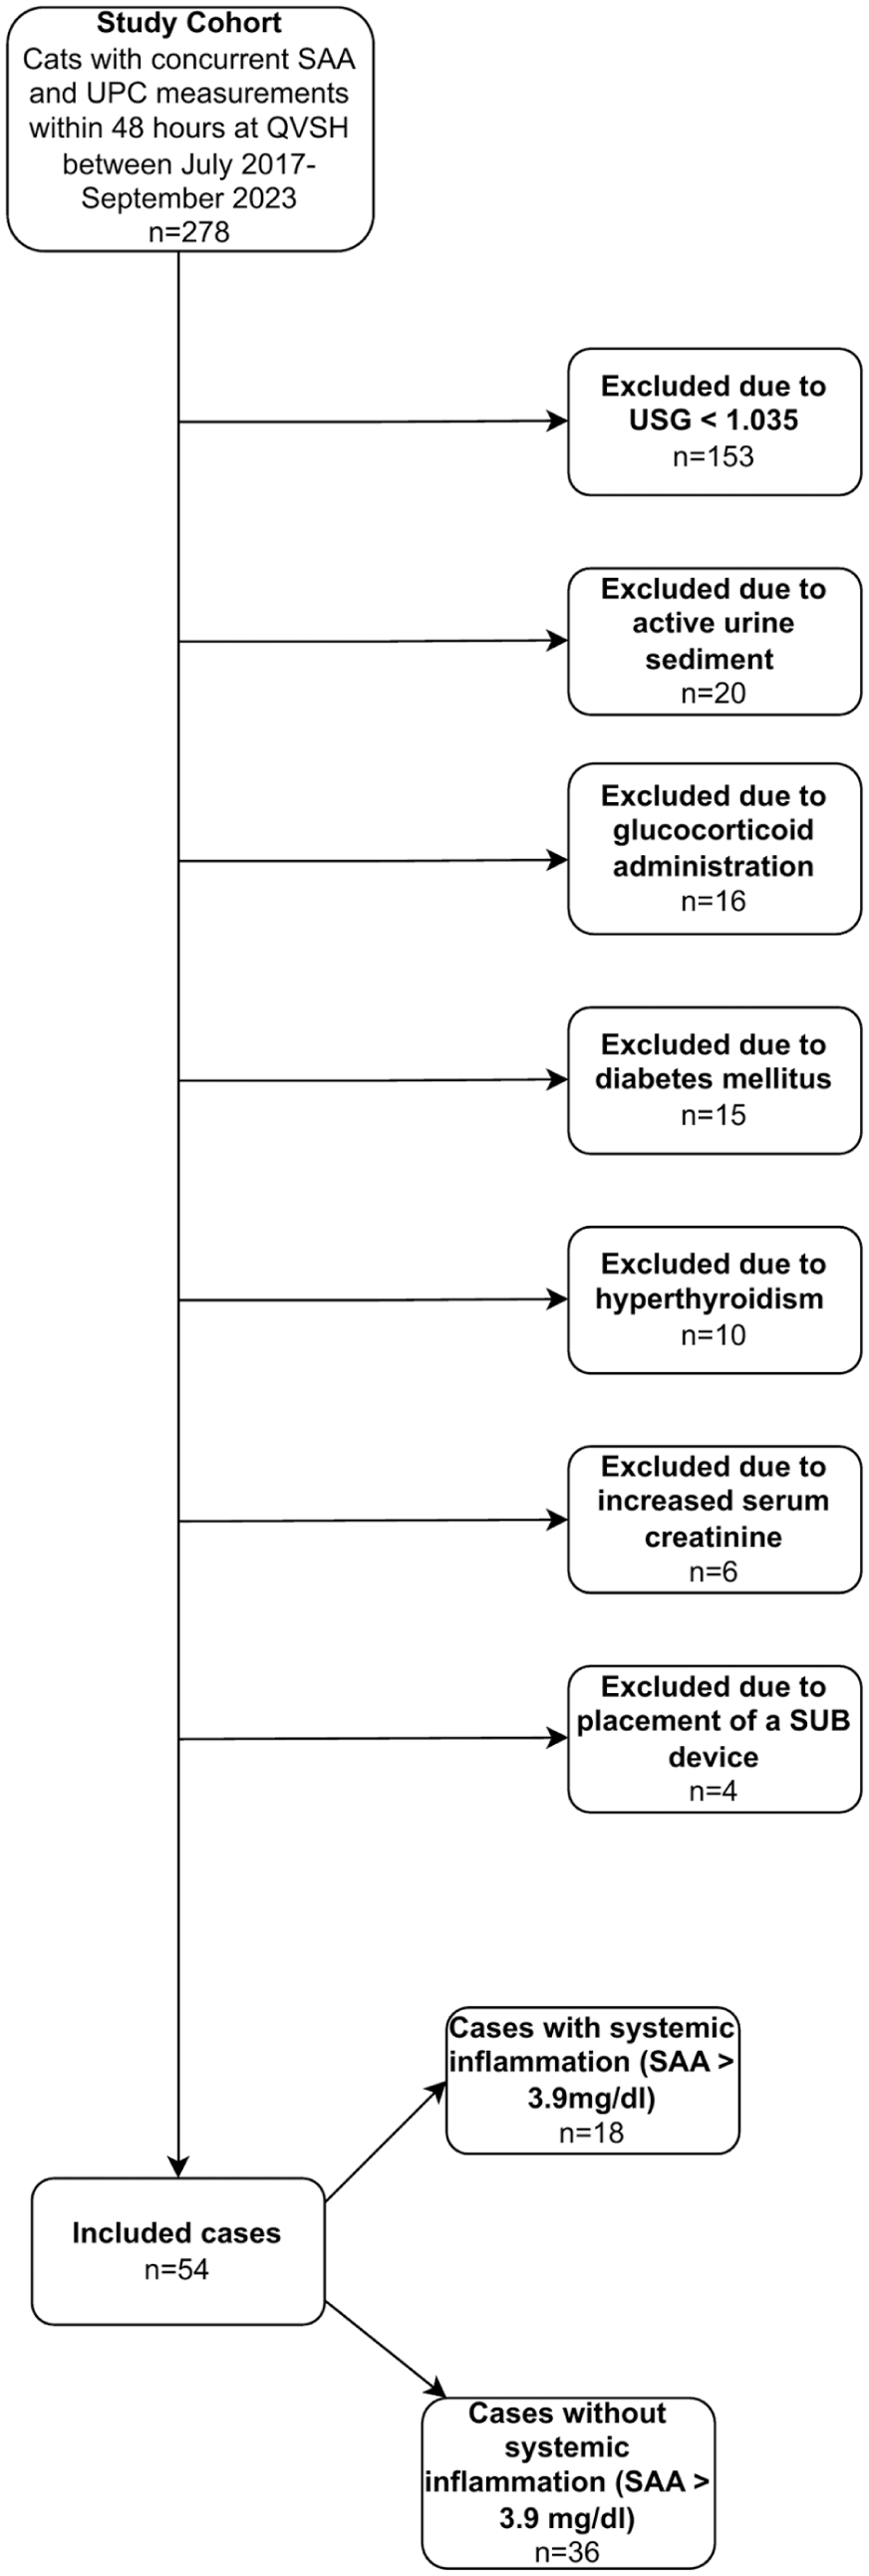
Flowchart showing numbers of included and excluded cases and reasons for exclusion. QVSH = Queen’s Veterinary School Hospital; SAA = serum amyloid A; SUB = subcutaneous ureteral bypass; UPC = urine protein:creatinine
The remaining 54 cases consisted of 33 domestic shorthairs, three domestic longhairs, five Maine Coons, four Ragdolls, three Bengals, two Persians, two British Blues, one Exotic Shorthair and one Nebelung. There were 26 male castrated, 21 female spayed, four entire male and three entire female cats among the cohort.
Of the 54 cases included, 18 cats had increased SAA and 36 cats had normal SAA. Final diagnosis in the increased SAA group included confirmed or suspected cases of feline infectious peritonitis (n = 5), lymphoma (n = 4), suspected thromboembolic events (n = 2, one due to restricted cardiomyopathy, the other cause was unknown), cholelithiasis (n = 1), pancreatitis (n = 1), inflammatory bowel disease (n = 1), pemphigus foliaceous (n = 1), lobar pneumonia (n = 1), metastatic disease without a histopathological diagnosis (n = 1) and an undiagnosed cause of alopecia and weight loss (n = 1).
Final diagnosis in cases included in the normal SAA group were chronic enteropathy (n = 12), neoplasia (n = 6, including an oral gingival mast cell tumour stage IV, suspected gastric metastatic carcinoma, cholangiocellular carcinoma, bronchial carcinoma, B-cell lymphoma, suspected brain lymphoma), spinal injury (n = 2), gastrointestinal parasitism (n = 2), idiopathic hypercalcaemia (n = 2), undiagnosed pelvic limb lameness (n = 1), chronic pancreatitis (n = 1), pyogranulomatous skin lesions (n = 1), hypodipsia and hyponatraemia (n = 1), suspected toxoplasma (n = 1), infectious lymphadenopathy (n = 1), cholangitis (n = 1),vestibular disease (n = 1), feline infectious peritonitis (n = 1), pleural effusion and lung lobe consolidation (n = 1), bilateral otitis media and interna (n = 1) and food-responsive periocular alopecia (n = 1).
Urine samples were obtained by cystocentesis in 11/18 (61%) cats in the increased SAA group and 30/36 (83%) cats in the normal SAA group (P = 0.096); otherwise, samples were collected by free catch or the collection method was not recorded.
Overt proteinuria (UPC >0.4) was observed in 10 (19%) cats, of which six were in the increased SAA group and four were in the normal SAA group (Table 1). In total, 16 cats had borderline proteinuria (UPC 0.2–0.4), of which seven were in the increased SAA group and nine were in the normal SAA group (Table 1). The proportion of cats with overt proteinuria did not significantly differ between cats with high or normal SAA (33% vs 11%, respectively), although the P value was close to the level of statistical significance (P = 0.067). Conversely, the proportion of cats with borderline or overt proteinuria was higher in cats with high SAA than in cats with normal SAA (72% vs 36%; P = 0.02). UPC was significantly higher in the increased SAA group than in the normal SAA group (0.32 [0.11–1.25] vs 0.17 [0.08–0.59]; P = 0.002). Since some cats had mildly increased SAA concentrations, the data were further sub-stratified to compare UPC between cats with mild increases in SAA concentrations (3.91–39 µg/ml, n = 7) and those with moderate to marked increases in SAA concentrations (× 10 upper limit of RI or >39 µg/ml, n = 11). UPC was not significantly different between these two groups (0.22 [0.11–0.45] vs 0.37 [0.15–1.25], respectively; P = 0.151) (Figure 2). UPC was not significantly different between cats with mild increases in SAA concentrations and those with normal SAA concentrations (P = 0.166) (Figure 2); however, UPC was significantly higher in cats with moderate to markedly increased SAA concentrations than those with normal SAA concentrations (P <0.001). In addition, there was a moderate positive correlation between UPC and SAA (rs = 0.519; P <0.001) (Figure 3) and a moderate negative correlation between UPC and serum creatinine concentrations (rs = –0.617; P <0.001).
Cross-tabulation of proteinuria vs serum amyloid A (SAA) concentrations in cats included in the study

UPC = urine protein:creatinine ratio

Scatter graph showing urine protein:creatinine ratio (UPC) in cats with serum amyloid A (SAA) <3.9 µg/ml, cats with mildly increased SAA concentrations (3.91–39 µg/ml) and cats with moderate to markedly increased SAA concentrations (>39 µg/ml). The dotted line represents the International Renal Interest Society cut-off point for diagnosis of overt proteinuria (UPC >0.4). Comparisons between groups were made using the Mann–Whitney U-test. UPC was significantly higher in cats in the moderate to markedly increased SAA group than in the normal SAA group (P <0.001)

Scatter graph showing the correlation between serum amyloid A (SAA) concentrations and urine protein:creatinine ratio (UPC). SAA concentrations below the limit of blank (0.3 µg/dl) were assigned the arbitrary value of 0.3 µg/dl for statistical analysis. The dotted line represents the International Renal Interest Society cut-off point for the diagnosis of overt proteinuria (UPC >0.4). Correlations were assessed using Spearman’s correlation coefficient. There was a weak positive correlation between UPC and SAA (rs = 0.519; P <0.001)
When comparing other clinical and biochemical variables between groups, serum creatinine concentrations were significantly lower in the moderate to markedly increased SAA group than in the normal SAA group (Table 2), although the differences in serum creatinine concentrations between the two groups were small and unlikely to be clinically relevant. However, there was no significant difference in serum urea concentrations, age or USG between the increased SAA and normal SAA groups (Table 2). Urinary protein concentrations were significantly higher in the two increased SAA groups than the normal SAA group, whereas there was no difference in urinary creatinine concentrations between the groups (Table 2).
Comparison of selected clinicopathological variables between cats with serum amyloid A (SAA) <3.9 µg/ml, cats with mildly increased SAA concentrations (3.91–39 µg/ml) and cats with moderate to markedly increased SAA concentrations (>39 µg/ml)

Data are median (range). Comparisons between groups were made using the Kruskal–Wallis test with post hoc Mann–Whitney U-test with Bonferonni correction. Significant differences (P < 0.05) between groups are shown by the superscript symbols * and †
Discussion
The results of the present study suggest that increased SAA concentrations are associated with mild proteinuria (usually UPC <1), with 32% of cats in the increased SAA group classified as overtly proteinuric based on IRIS guidelines. 4 However, the study design does not permit inference of causality, and further studies would be needed to demonstrate whether proteinuria resolves after resolution of increased SAA in these cases before a causal relationship between increased SAA and proteinuria can be inferred.
Previous studies in humans and dogs have documented an association between systemic inflammatory disease and proteinuria,8 –10 although the underlying mechanisms remain unclear. It has been suggested that both increased systemic capillary permeability 11 and immune complex-mediated glomerular injury may contribute. 12 Given that immune complex deposition may have been present in several of the conditions represented in both our high and normal SAA groups, this could have been an important factor influencing the development of proteinuria in our cohort. Further studies to elucidate the cause of proteinuria in cats with systemic inflammation – for example, through proteomic or electrophoretic analysis of urine and/or evaluation of renal histopathology for evidence of immune complex formation – would be required to further investigate this.
Proteinuria is an established negative prognostic factor in cats with CKD, 1 where it has been associated with disease progression and reduced survival times. One preliminary study has also linked proteinuria with prognosis in non-azotaemic cats; 12 in dogs, albuminuria was associated with reduced survival to 3 days after admission to the intensive care unit. 13 UPC reflects urinary protein loss and does not directly assess renal function, which is more appropriately evaluated by glomerular filtration rate. Therefore, proteinuria may be present in cats without evidence of reduced renal function. In the present study, we found that UPC correlated with SAA concentration, and although this suggests that cats with high SAA concentrations are more likely to have proteinuria, our study was not able to demonstrate a causal association. Further longitudinal studies are warranted to investigate whether treatment of inflammatory conditions that subsequently lowers serum SAA concentrations leads to resolution of proteinuria, and to evaluate the relationship between proteinuria and survival in cases with increased SAA.
Serum creatinine concentrations were statistically lower in the increased SAA group compared with the normal SAA group; however, the differences were not considered clinically relevant given that the data largely overlapped and most concentrations were within the RI. The normal SAA group included cats diagnosed with inflammatory conditions, such as inflammatory bowel disease, pancreatitis, meningitis, feline infectious peritonitis and feline asthma; however, it is possible that in these cases SAA concentrations remained within the laboratory RI despite systemic inflammation, perhaps because SAA did not increase in some cats because of other factors such as comorbidities (eg, hepatocellular dysfunction) or treatment with anti-inflammatories. Increased SAA concentrations are only 93% sensitive for detecting systemic inflammation; 14 therefore, the presence of inflammation in cats with normal SAA cannot be excluded and was likely given the diseases diagnosed in the normal SAA cohort, eg, pancreatitis and cholangitis. Thus, we can only conclude that cats with increased SAA concentrations (rather than inflammation) are more likely to be proteinuric; however, future studies investigating the association between systemic inflammation and proteinuria in cats could utilise multiple biomarkers to classify patients and increase the sensitivity for detection of systemic inflammation and to confirm the association between proteinuria and systemic inflammation per se.
Our study has some limitations. First, this was a small study, partly because of the strict inclusion criteria, and additional studies evaluating larger cohorts of cats are recommended to confirm our findings and to further investigate the prevalence and severity of proteinuria in cats with increased SAA. In addition, the presence of non-azotaemic CKD or other renal lesions that might contribute to proteinuria could not be excluded, given that renal biopsy was not performed. Measurement of glomerular filtration rate or assessment of serum symmetric dimethylarginine concentrations might have allowed the detection of additional cases with non-azotaemic CKD, especially for cases that may have had reduced muscle mass; 15 however, this was not possible in the present study. Persistent proteinuria was also not demonstrated; hence the presence of physiological proteinuria that was not associated with increased SAA could not be excluded. Systolic blood pressure (SBP) was also not measured in all cases; therefore, hypertension, which can be associated with proteinuria, 16 was also not excluded in all cases. In one study, only 12% of non-azotaemic cats were hypertensive; 1 therefore, this is unlikely to have significantly confounded our results. In addition, cats with SBP in the range of 150–160 mmHg were included in the study, suggesting pre-hypertension was not excluded; however, the association between pre-hypertension and proteinuria is unknown. Urine samples were also a mixture of cystocentesis and free catch samples, and UPC in samples collected by cystocentesis is higher than in voided urine samples; 17 however, the number of voided samples included in the study was low. Furthermore, urinalysis was only performed at the discretion of the attending clinician; hence bias in the population of patients for which urinalysis was performed cannot be excluded, although UPC analysis was performed on all samples submitted for urinalysis, as per the standard protocol in our laboratory. Finally, samples with SAA below the limit of blank and with USG above 1.050 were assigned arbitrary values for statistical purposes, which may have confounded assessment of the associations between SAA and these variables.
Conclusions
The results of this study suggest that cats with increased SAA concentrations have a higher UPC than cats with normal SAA concentrations. However, further studies are needed to evaluate whether persistent proteinuria is observed in cases with increased SAA concentrations and to determine whether proteinuria resolves after resolution of increased SAA concentrations.
Footnotes
Conflict of interest
The authors declared no potential conflicts of interest with respect to the research, authorship, and/or publication of this article.
Funding
The authors received no financial support for the research, authorship, and/or publication of this article.
Ethical approval
The work described in this manuscript involved the use of non-experimental (owned or unowned) animals. Established internationally recognised high standards (‘best practice’) of veterinary clinical care for the individual patient were always followed and/or this work involved the use of cadavers. Ethical approval from a committee was therefore not specifically required for publication in JFMS. Although not required, where ethical approval was still obtained, it is stated in the manuscript.
Informed consent
Informed consent (verbal or written) was obtained from the owner or legal custodian of all animal(s) described in this work (experimental or non-experimental animals, including cadavers, tissues and samples) for all procedure(s) undertaken (prospective or retrospective studies). No animals or people are identifiable within this publication, and therefore additional informed consent for publication was not required.