
Abstract
Urinalysis could be helpful to investigate the health status of giraffes held in captivity using noninvasive methods to avoid animal handling or anesthesia. We collected 52 voided urine samples from 20 giraffes of different ages, sexes, and subspecies from the ground. To evaluate potential interference by soil contaminants, a pilot study was performed using 20 urine samples obtained from 10 cows. All bovine and 29 giraffe samples were subjected to routine urinalysis including urine specific gravity (USG). All samples were analyzed for urine total protein (uTP), urine creatinine (uCrea) concentration, and urine protein-to-urine creatinine ratio (UPC). Urinary proteins were separated by SDS-PAGE electrophoresis. No significant differences were determined between free-catch and urine sampled from the ground in cows. Giraffe urine was pale-yellow, with alkaline pH (>8.0) and a mean USG of 1.035 ± 0.013. The uTP, uCrea, and UPC expressed as median (range) were 0.20 (0.08–0.47) g/L, 2.36 (0.62–5.2) g/L, and 0.08 (0.05–0.15), respectively. SDS-PAGE allowed the separation of protein bands with different molecular masses, including putative uromodulin at 90 kD, putative albumin at 64 kD, and putative immunoglobulin heavy and light chains at 49 kD and 25 kD, respectively. Urine collection from the ground appears to be a reliable technique for urinalysis and urine electrophoresis in giraffes.
Introduction
The number of giraffes (Giraffa camelopardalis) has significantly decreased in the wild; thus, giraffes have been classified by the International Union for Conservation of Nature (IUCN) as a vulnerable species. 27 In particular, 4 of its 9 subspecies (Giraffa camelopardalis spp. reticulata, tippelskirchi, antiquorum, and camelopardalis) have been declared endangered or critically endangered.2,11,28,47 Given that they are at risk of becoming extinct, improving general knowledge about giraffes and their physiology should be a priority. Health status evaluation of non-domestic animals is challenging for researchers and conservationists because of the inherent challenges in obtaining clinical and laboratory data. 20 The use of noninvasive sampling techniques is an important tool to limit the costs and risks of anesthesia or capture needed for medical evaluation of these animals.
Urine is an excellent biological sample, and urinalysis is one of the most important clinicopathologic tools in veterinary medicine for the identification of renal and urinary tract disorders, as well as to obtain preliminary information on non-urinary diseases.24,32,34,41 Urine samples have been collected from chimpanzees, macaques, orangutans, and wolves by a variety of sampling methods: from the snow, leaves, first aid cotton, as well as clean plastic sheets.8,9,21,25,44 Urine collection from the ground or floor with a syringe has been reported for captive okapi and giant panda, and applied in giraffes to study the urinary metabolome.5,14,48 The latter method could be useful also for giraffes given that urine can be collected repeatedly in adequate amounts and noninvasively, without causing stress to the animals.20,22,32,34 Indeed, the particular cardiovascular system of giraffes makes them more susceptible than other mammals to anesthetic mortality, making animal capture and sampling difficult and dangerous. 7
Considering the anesthetic-related complications that limit biological sampling of giraffes and the absence of urinalysis reference values in this species, the aims of our study were to evaluate and to apply a noninvasive urine sampling method in giraffes and to obtain preliminary data on urinalysis and urine electrophoresis in this species. To evaluate the possible preanalytical interference from ground contaminants, we performed a pilot experiment to compare voided urine collected by free-catch sampling with a syringe sample from the ground.
Materials and methods
Study subjects and sample collection
Cattle
To evaluate the influence of ground contamination, we collected 10 free-catch urine samples from 10 dairy cows of similar body weight in a nearby farm in Bussolengo, Italy. Urine collection was performed during daily feeding after milking. Twenty mL of urine were sampled during spontaneous voiding in urine cups (Safe sterile box, 100 mL; Pic Solution) and divided into two 10-mL aliquots. One aliquot was used as the control sample; the second aliquot was poured on the unpaved ground and 5 mL were immediately collected with a syringe, aspirating only the upper portion of the sample.
Giraffes
Urine samples were obtained from 20 captive giraffes of different ages, sexes, and subspecies housed in 2 Italian zoos: Parco Natura Viva, Bussolengo, Verona (group A; n = 4; 4 adult males) and Parco Faunistico Le Cornelle, Bergamo (group B; n = 16; 10 females and 6 males; Table 1). A total of 29 urine samples were collected in August and October 2013 from group A. A total of 23 urine samples were collected from March 2013 to July 2014 from group B. The 52 urine samples were collected during daily husbandry activities or animal feeding to standardize the collection method.
Subjects included in the study of giraffe urine: Giraffa camelopardalis (G. c.) subspecies, sex, age, group, and number of samples for each specimen.
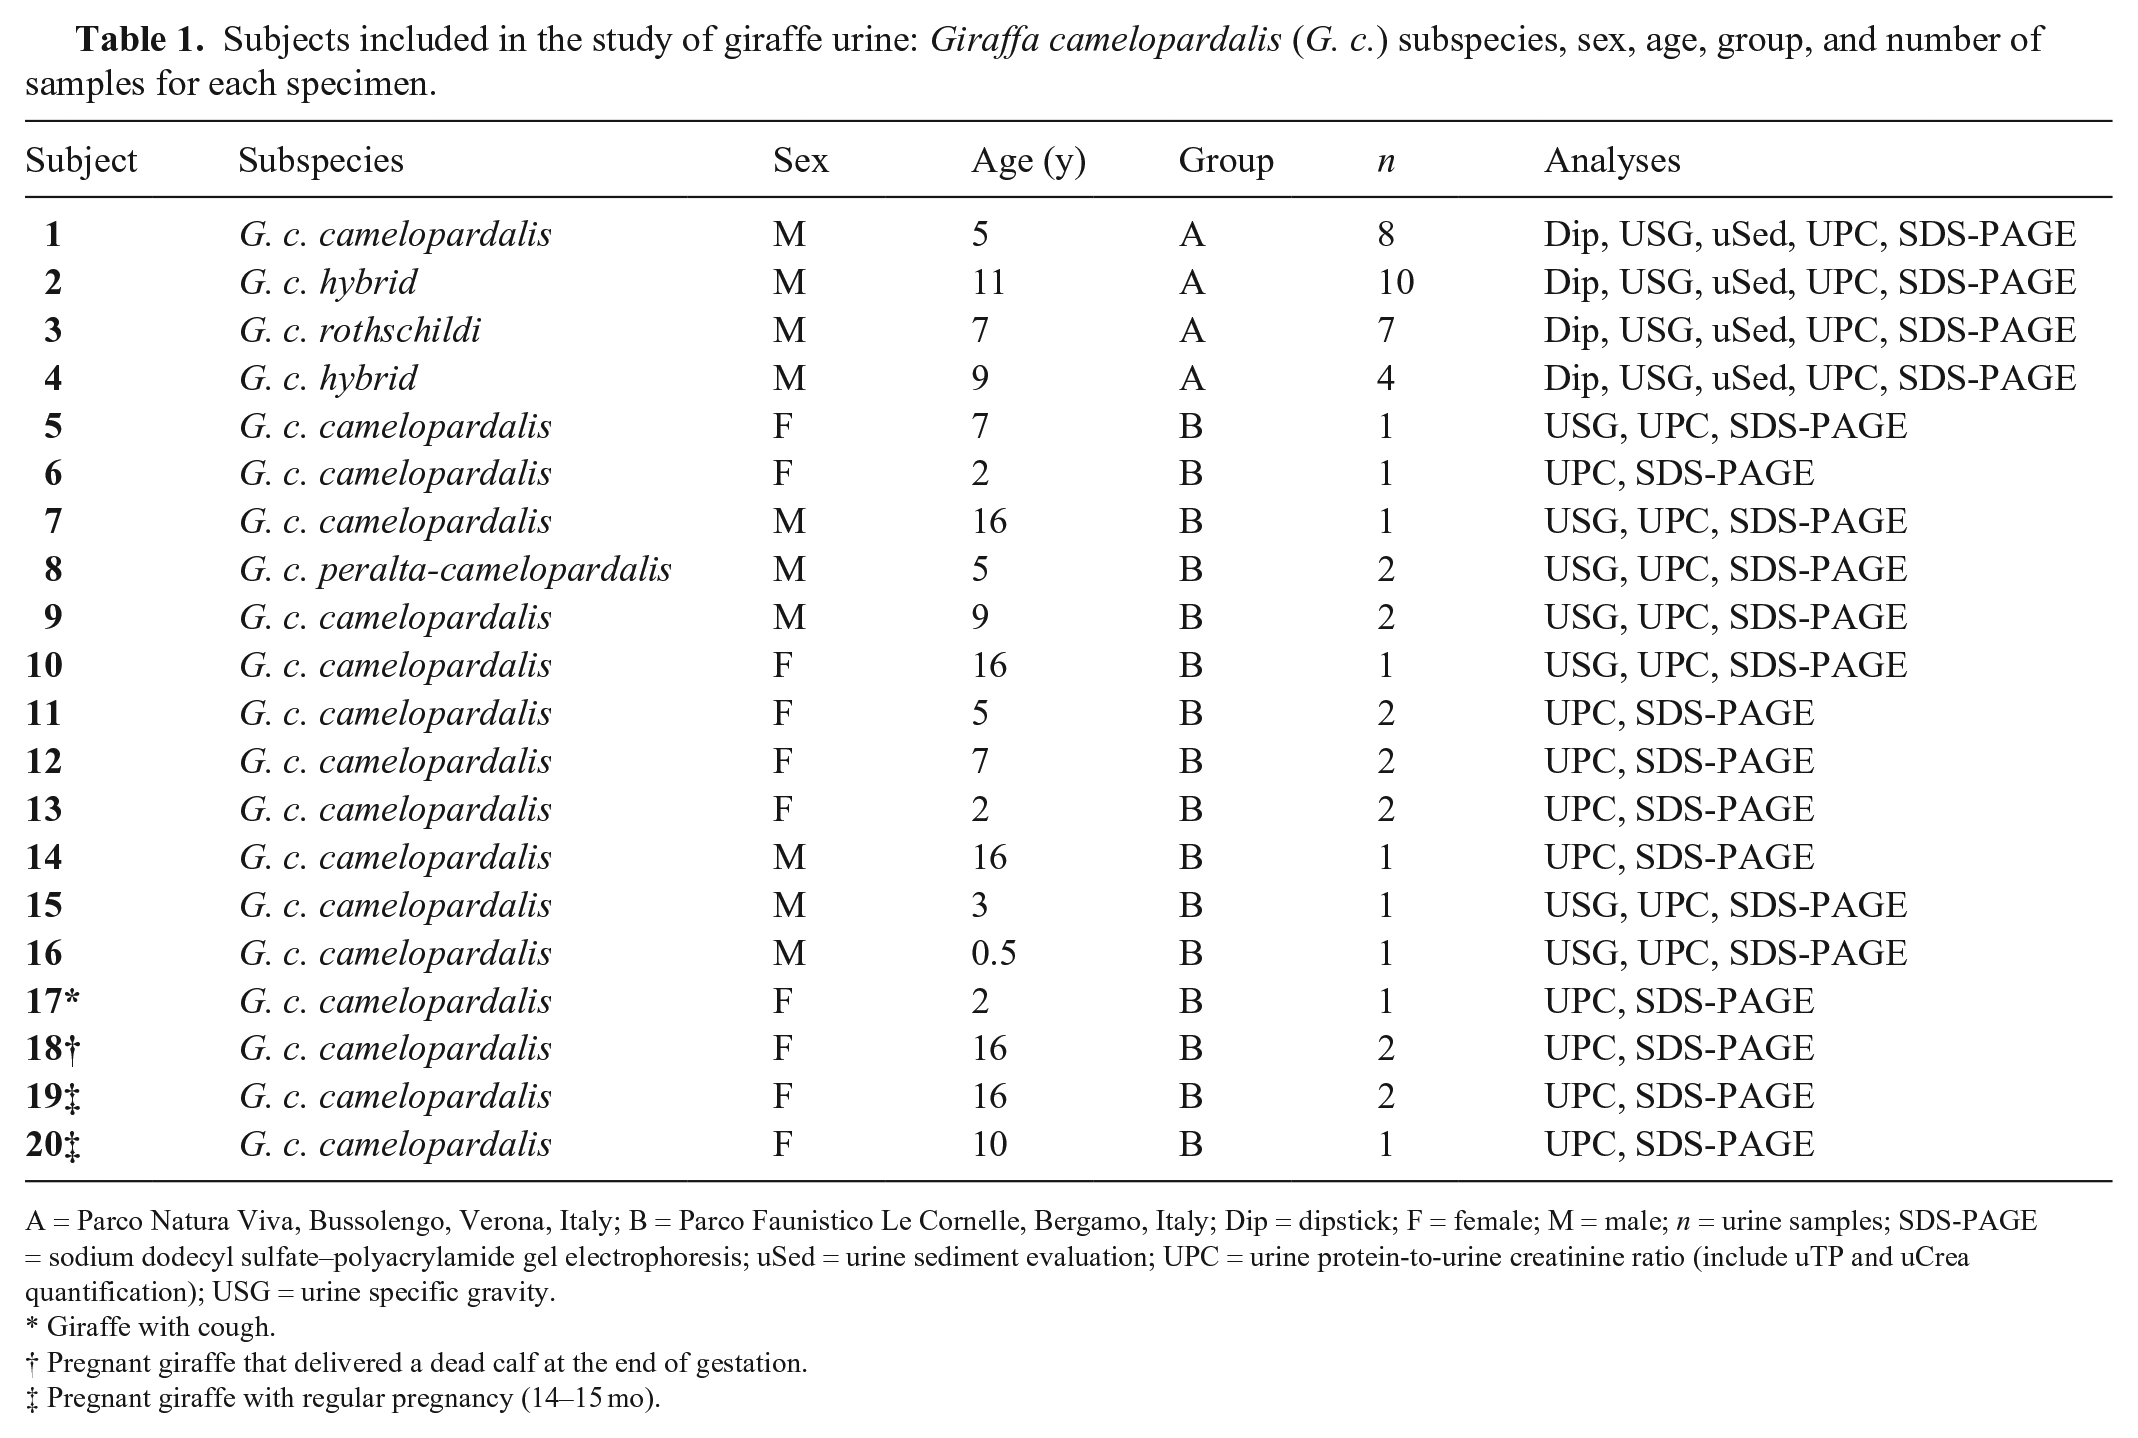
A = Parco Natura Viva, Bussolengo, Verona, Italy; B = Parco Faunistico Le Cornelle, Bergamo, Italy; Dip = dipstick; F = female; M = male; n = urine samples; SDS-PAGE = sodium dodecyl sulfate–polyacrylamide gel electrophoresis; uSed = urine sediment evaluation; UPC = urine protein-to-urine creatinine ratio (include uTP and uCrea quantification); USG = urine specific gravity.
Giraffe with cough.
Pregnant giraffe that delivered a dead calf at the end of gestation.
Pregnant giraffe with regular pregnancy (14–15 mo).
Group A giraffes lived in a large naturalistic enclosure of outdoor and indoor areas. The outdoor area was a 5-ha safari park with water pools, trees, rocks, and large grassy areas. The indoor area was composed of four 5 × 5 m wooden stables that were heated in winter. During the day, giraffes lived in the outdoor area and at night in the indoor area. The husbandry of group A varied across seasons; the time spent in the outdoor area of the enclosure was ~8 h in spring and summer, but decreased during winter, depending on weather condition, temperature, and the presence of ice. In group A, every giraffe was fed hay and 7–8 kg of fresh fruit and vegetables, supplemented with vitamins twice a week. When available, mainly from April to November, fresh grass and branches were also provided. In winter, the diet was supplemented with 1 kg of herbivore pellets per individual.
Group B giraffes also lived in an enclosure divided into 2 areas: an outdoor and an indoor area. The indoor zone had wooden stables where the animals rested during the night. The outdoor paddock was used during the day and varied by season. During the summer, the group of giraffes stayed outdoors for 10 h; during the winter, giraffes were in the open air for ≤6 h, on account of low temperatures or the presence of ice. Group B giraffes were fed alfalfa hay, which was available at both the outdoor and the indoor feeding points, and 6–8 buckets each containing 12 kg of fruits and vegetables. In every bucket, 3 kg of cereal mix, 500 mL of seed oil, and 300 mL of cod liver oil were also added. Additionally, 100 g of a multivitamin supplement was added to each bucket 3 times per wk. Three females of this group were pregnant during the trial. Two of them had a normal pregnancy (14–15 mo normal gestation); one female delivered a dead calf at the end of gestation. Another 2-y-old female in this group had a cough as a unique clinical sign.
At voiding, 5 mL of urine were collected both from the floor of the barn and from the outside ground or soil with a syringe immediately after micturition. Soil contamination was minimized through the prompt collection and aspiration of only the superficial part of the urine. 48
Urinalysis, urine chemistry, and urine protein-to-urine creatinine ratio evaluation
The 20 urine samples from cows and the 29 urine samples from giraffes of group A underwent immediate routine urinalysis, including measurement of urine specific gravity (USG) by a refractometer (Giorgio Bormac), as well as physical and chemical evaluation. Physical examination was performed by visual inspection of color and clarity. Chemical examination was carried out by semiquantitative dipstick test (Combur10; Roche Diagnostic). Seven urine samples from 7 giraffes of group B were analyzed for USG.
All of the urine samples (20 from cows; 52 from giraffes) were centrifuged at 1,500 × g for 10 min.21,41 On the 20 samples from cows and the 29 from giraffes of group A, microscopic sediment analysis was performed by resuspending 50 µL of urine sediment with subsequent placement on two 26 × 76 mm microscope slides (unstained and stained with fuchsin solution [Samson reagent; Dr. Grogg Chemie]), and covered by a 20-mm2 glass coverslip. The urine sediment was examined under low-power (100×) and high-power (400×) fields for evaluation of crystals, casts, epithelial cells, red blood cells (RBCs), leukocytes (WBCs), bacteria, and soil contaminants (pollen, vegetable fibers, mold spores). Microscopic quantification of the components of the urine sediment (cells, casts, and crystals) were performed using the scale of (negative) = <5 components; (+) = 5–10 components; (++) = 11–50 components; and (+++) = >50 components for soil contaminants and cells (RBCs, WBCs, transitional and squamous epithelial cells, and sperm); for crystals and casts, the scale was (+) = 1–4 components, (++) = 5–10 components, and (+++) = 11–20 components. Supernatants were stored for 1 mo at −80°C for subsequent analyses.
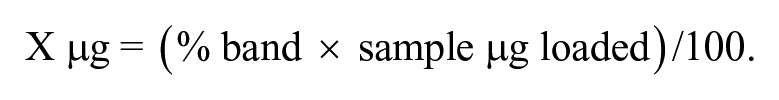
On urine supernatants obtained from all of the collected samples (20 from cows; 52 from giraffes), the urine total protein (uTP) and urine creatinine (uCrea) were determined using commercial assays (Urinary/CSF protein, Creatinine; Olympus-Beckman Coulter) on an automated chemistry analyzer (AU 480; Olympus-Beckman Coulter). Both methods were calibrated following the manufacturer’s instructions for urine using standard materials (Urinary/CSF protein calibrator, Urine calibrator; Beckman Coulter); controls were performed on a daily basis using a commercial quality control solution (Liquichek, Urine chemistry control; Bio-Rad). The urine protein-to-urine creatinine ratio (UPC; g:g) was calculated using the following formula: UPC = uTP (g/L)/uCrea (g/L).
Urine protein electrophoresis
Urine protein electrophoresis was performed on all collected samples (20 from cows; 52 from giraffes) using sodium dodecyl sulfate–polyacrylamide gel electrophoresis (SDS-PAGE). Urine proteins were separated using an electrophoresis system (NuPAGE; Thermo Fisher Scientific) on precast 4–12% polyacrylamide gels in reducing conditions with MES buffer (2-[N-morpholino]ethanesulfonic acid; Thermo Fisher Scientific) containing SDS.
Two μg of protein for each sample was loaded and electrophoresis carried out following the procedure reported previously; gels were stained with silver nitrate (SilverQuest; Thermo Fisher Scientific). 18 After staining, the gels were digitalized with specific software (ChemiDoc XRS+ system; Bio-Rad) and the electropherograms captured (ImageLab software; Bio-Rad). Qualitative evaluation of protein profiles was performed by visual inspection of pherograms and by the calculation of the total number of bands in each sample. For the quantitative evaluation of the band intensities, the ImageLab software determines the volume of each protein band by analyzing the pixel values of the digital image; the volume is calculated as the sum of the pixel intensities within the band boundaries. 36 The volume of each band of interest, corresponding to its intensity, was then compared to the entire volume of the lane, and the corresponding percentage was calculated. The micrograms of each band were calculated as follow:
Statistical analysis
Statistical analyses were performed using commercial software (MedCalc Statistical Software v.19.0.7; RStudio v.1.2.1335 Statistical and R v.3.4.3). Given the presence of different urine samples from the same giraffe, the mean value of each analyte for each giraffe with repeated samples was calculated and used to perform all subsequent statistical analyses. 33 Data from the pregnant giraffes (cases 18–20) and the giraffe with cough (case 17) were excluded from all statistical analyses. For each analyte (dipstick, USG, uTP, uCrea, and UPC), normal distribution was tested graphically and by Shapiro–Wilk normality test; p > 0.05 was considered indicative of a normal distribution. Data were reported as mean ± standard deviation or median and range (minimum–maximum value), depending on normal or non-normal distribution, respectively. To evaluate the impact of the sampling method on urinalysis in cattle (dipstick, USG, uTP, uCrea, and UPC), the Wilcoxon test for paired samples was performed comparing free-catch urine samples and urine collected from the ground.
For SDS-PAGE results, to evaluate the impact of the sampling method on qualitative evaluation, the Wilcoxon test for paired samples was performed comparing the total number of bands of free-catch urine samples and urine collected from the ground. In addition, a linear model was performed to evaluate the quantitative differences of the protein profiles (band values expressed as protein percentage or µg) between the 2 groups (free-catch and from the ground). A p ≤ 0.05 was considered to indicate significant differences between the 2 sampling methods.
Results
Cattle
Urine color (light-to-medium yellow) was not different between free-catch urine and urine collected from the ground. Transparency was affected by soil contamination, as the 10 free-catch urine samples were clear, whereas the same urine samples collected from the ground were slightly cloudy (9 samples) or cloudy (1 sample).
No significant differences between bovine free-catch urine and urine collected from the ground were detected for urine dipstick, USG, uTP, uCrea, and UPC values (Table 2). The dipstick was positive for protein in 7 cattle and negative in 3. The microscopic sediment analysis from the 2 sampling methods differed in the presence of soil contaminants (pollen, vegetable fibers, mold spores, and bacteria), which were abundant in the urine collected from the ground (Table 2). One epithelial cell and one granular cast were detected in 2 samples, a free-catch urine and a different sample from the ground, respectively. RBCs and WBCs were not detected in the urine sediments. The presence of ground contaminants did not interfere with the identification of the biological elements (cells, crystals, and casts). No significant differences were found between the sampling methods for uTP (p = 1.0), uCrea (p = 0.4), and UPC (p = 0.9).
Comparison of routine urinalysis (dipstick, urine specific gravity, sediment analysis), urine total protein, urine creatinine, and urine protein-to-urine creatinine ratio from 10 cattle collected with a syringe from the ground after spontaneous voiding.
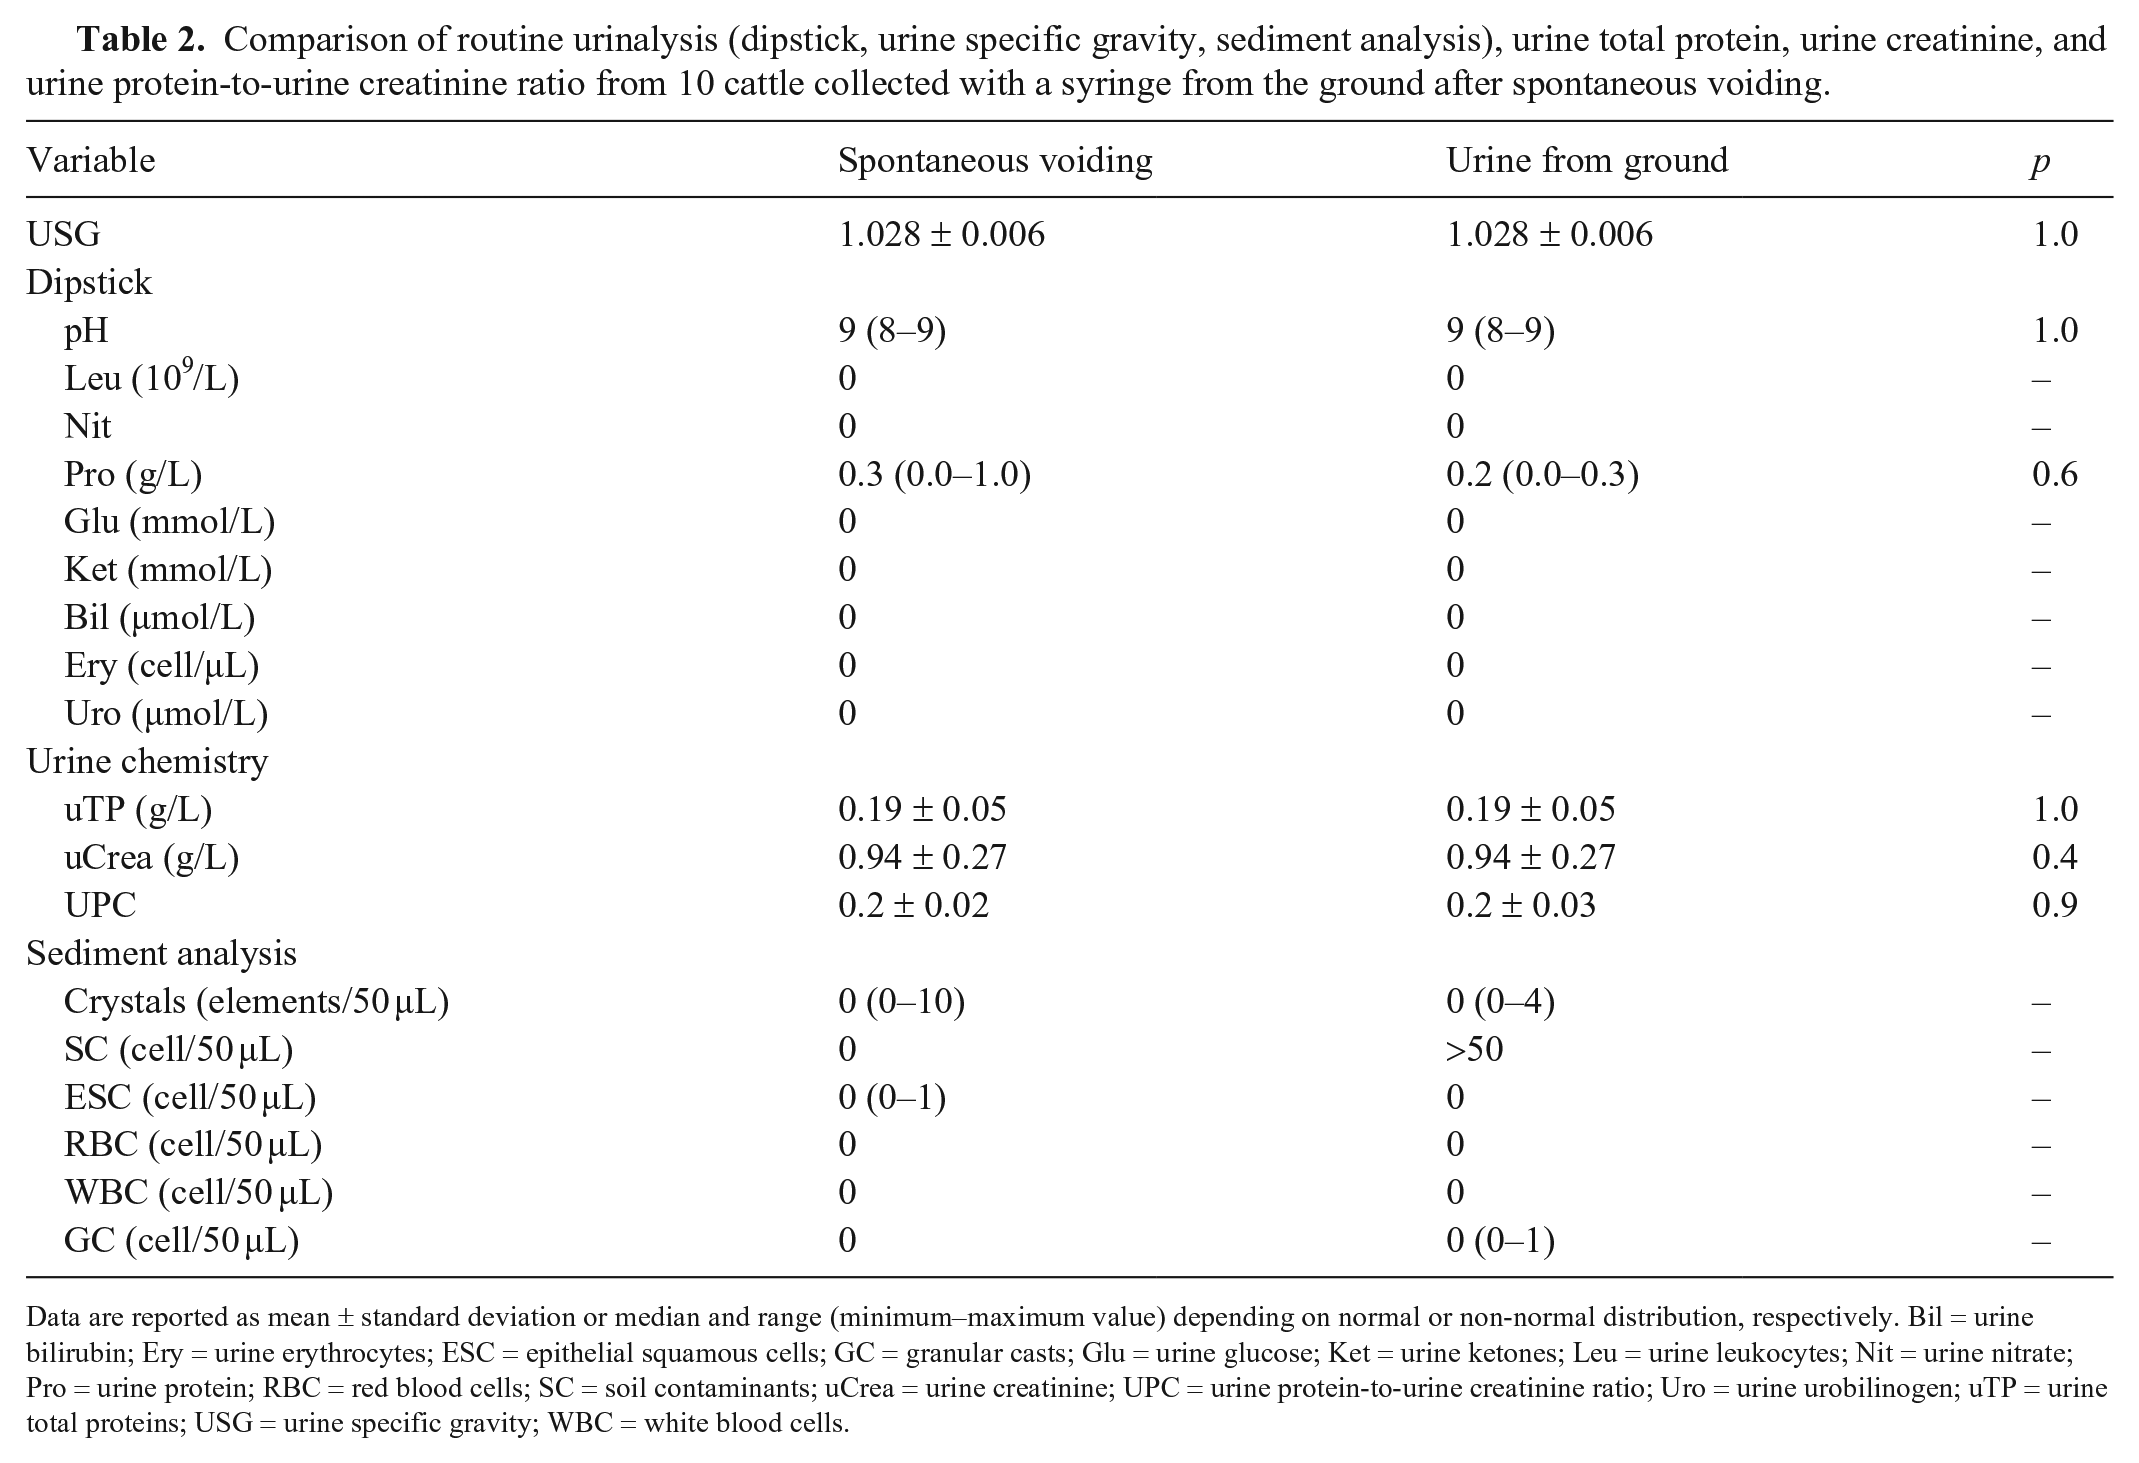
Data are reported as mean ± standard deviation or median and range (minimum–maximum value) depending on normal or non-normal distribution, respectively. Bil = urine bilirubin; Ery = urine erythrocytes; ESC = epithelial squamous cells; GC = granular casts; Glu = urine glucose; Ket = urine ketones; Leu = urine leukocytes; Nit = urine nitrate; Pro = urine protein; RBC = red blood cells; SC = soil contaminants; uCrea = urine creatinine; UPC = urine protein-to-urine creatinine ratio; Uro = urine urobilinogen; uTP = urine total proteins; USG = urine specific gravity; WBC = white blood cells.
SDS-PAGE did not have a significant difference in the number of bands when the 2 collection methods were compared (p = 0.46). The most represented bands had molecular masses (MMs) of 97, 86, 69–70, 59, 38, 27, 21–22, and <13 kD (Fig. 1). The linear model, used to evaluate the influence of the sampling methods on the SDS-PAGE protein quantification (percentage and µg), yielded nonsignificant values with an R2 of 0.0003898 (p = 0.8195) for protein percentage and an R2 of 0.0003492 (p = 0.829) for protein µg, indicating that the collection method did not impact the SDS-PAGE results.
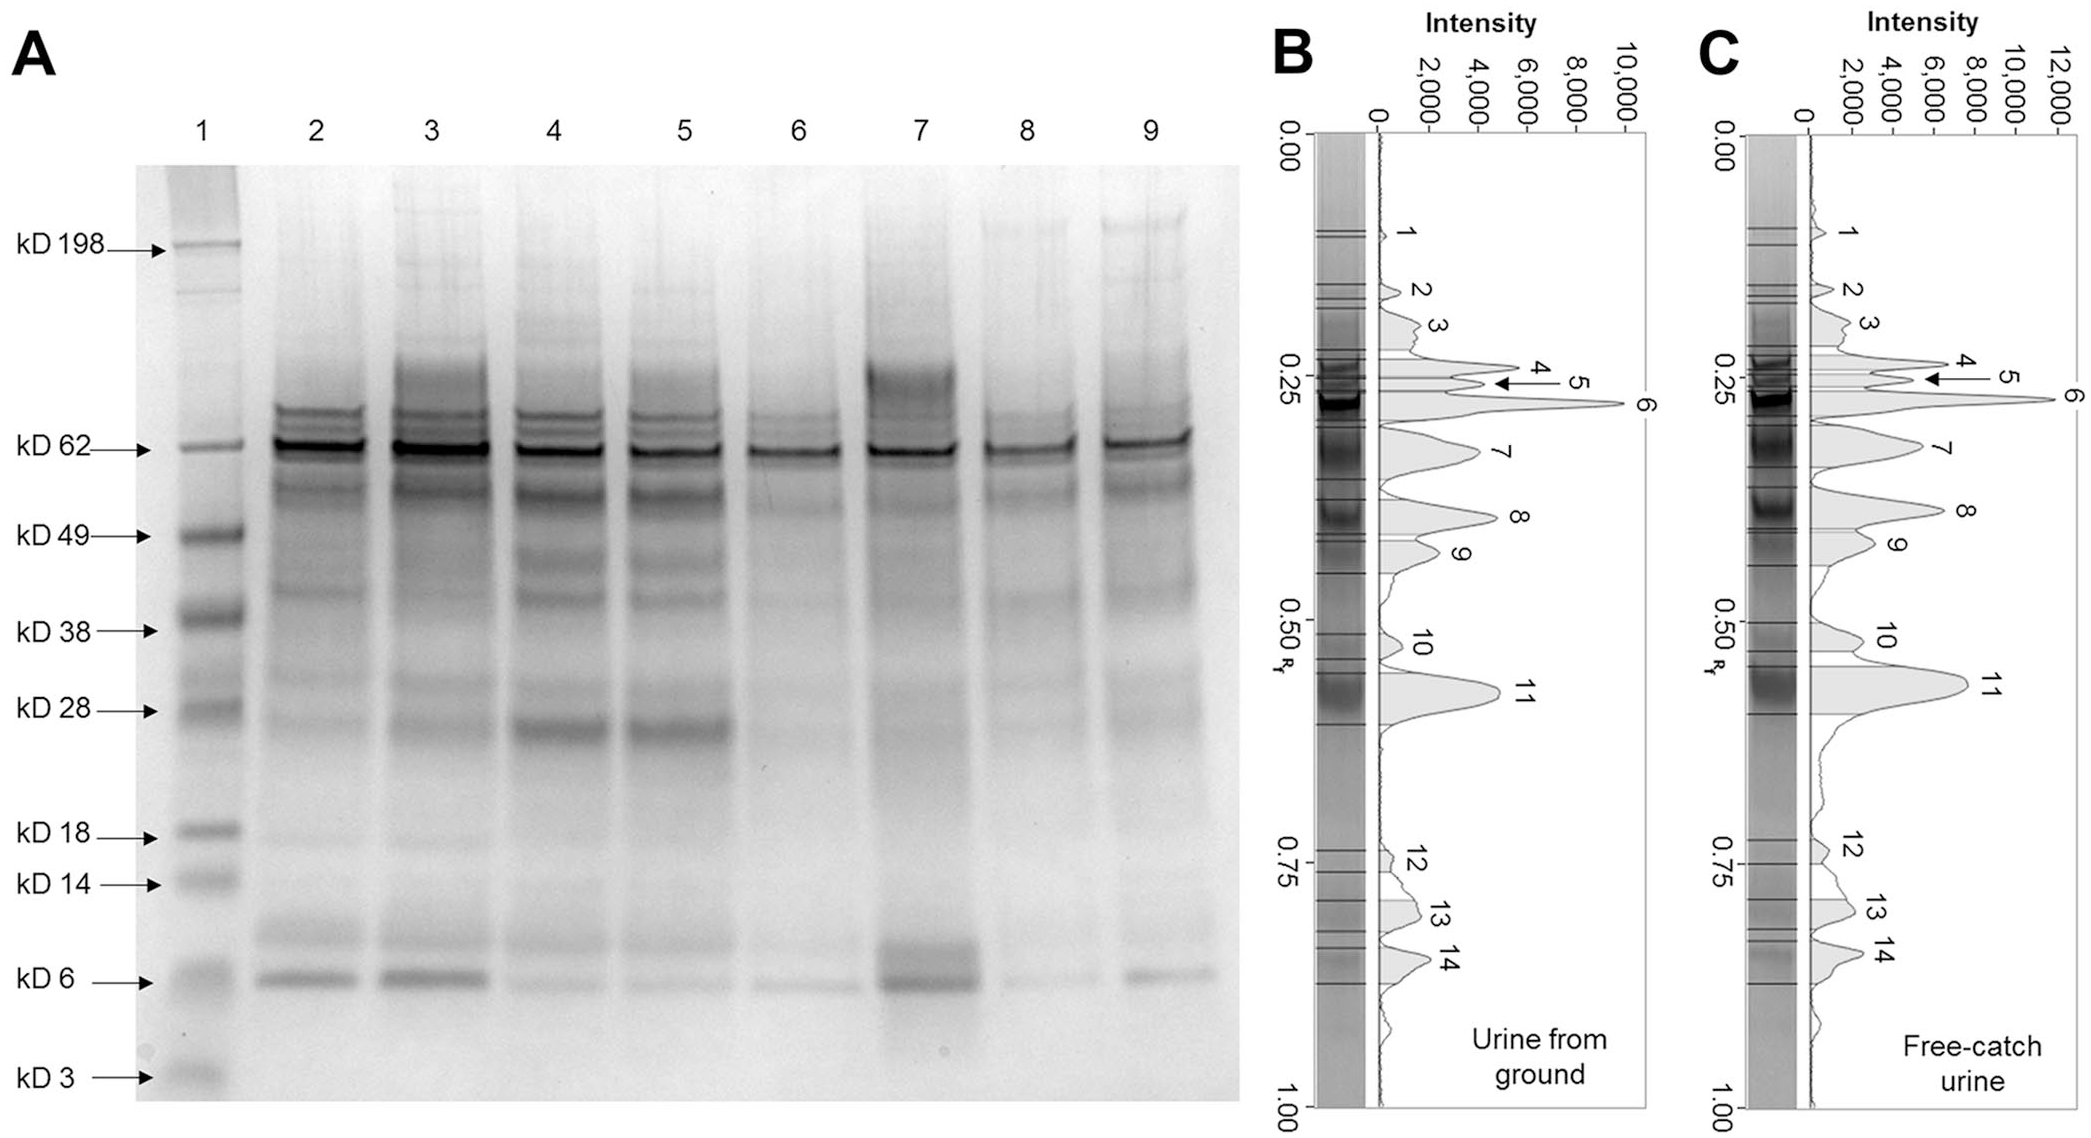
Representative SDS-PAGE gel and pherograms of urine samples collected from cattle using different methods.
Giraffes
Urinalysis, urine chemistry, and urine protein-to-urine creatinine ratio evaluation
Urine samples appeared colorless or pale-yellow, and most of them had mild-to-moderate turbidity. In all analyzed samples, the urine pH was alkaline (8.0–9.0). The mean USG value obtained was 1.035 ± 0.013 (Table 3).
Urine specific gravity, urine total protein, urine creatinine, and urine protein-to-creatinine ratio from adult giraffes housed in 2 groups.
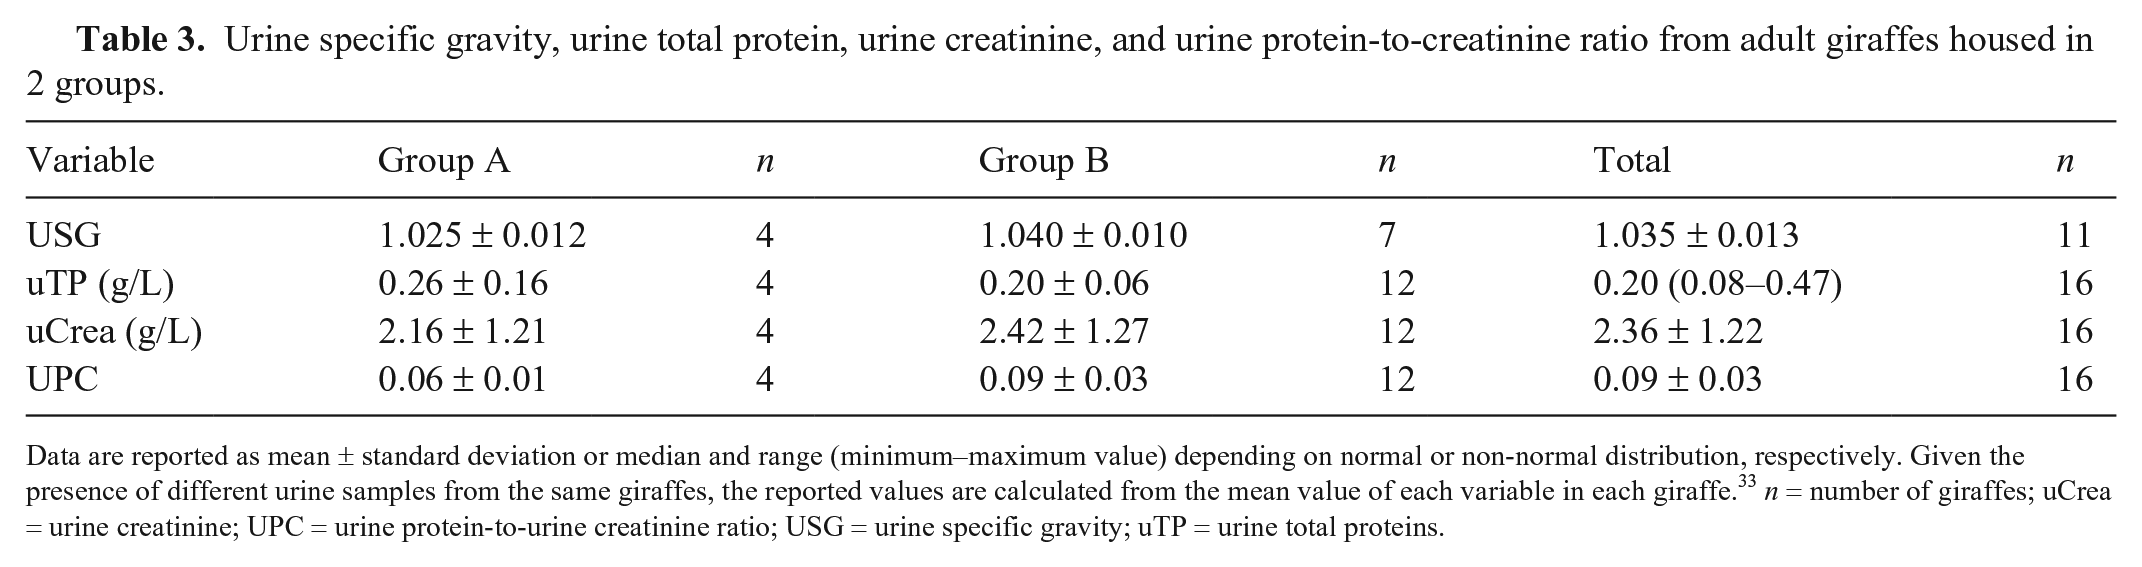
Data are reported as mean ± standard deviation or median and range (minimum–maximum value) depending on normal or non-normal distribution, respectively. Given the presence of different urine samples from the same giraffes, the reported values are calculated from the mean value of each variable in each giraffe. 33 n = number of giraffes; uCrea = urine creatinine; UPC = urine protein-to-urine creatinine ratio; USG = urine specific gravity; uTP = urine total proteins.
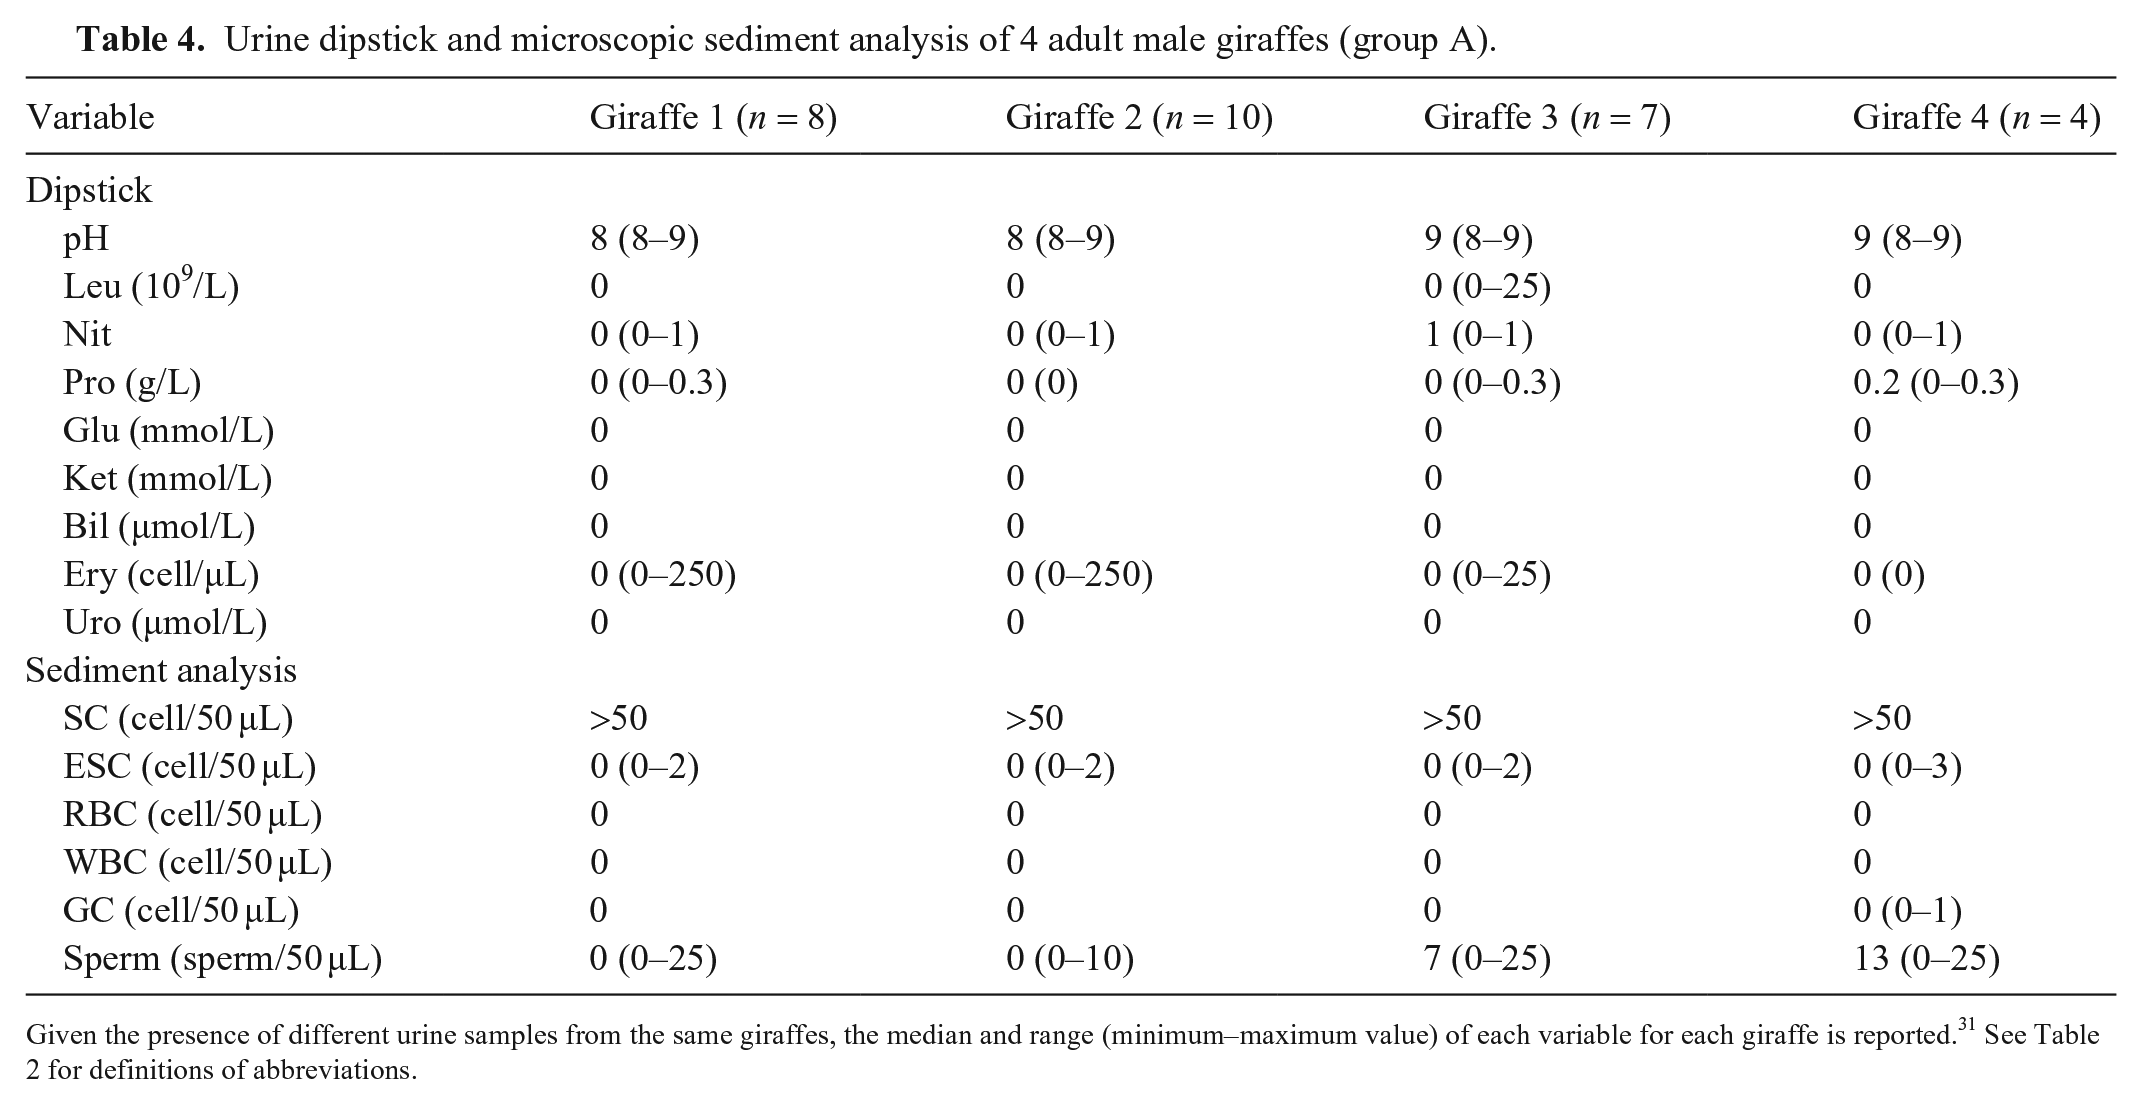
Urine samples of group A underwent routine urinalysis. Of the 29 samples, 7 (3 in giraffe 1; 2 in giraffe 3; 2 in giraffe 4) and 10 (3 in giraffe 1; 4 in giraffe 2; 3 in giraffe 3) tested positive for protein and RBCs, respectively. Moreover, 10 (3 in giraffe 1; 2 in giraffe 2; 4 in giraffe 3; 1 in giraffe 4) urine samples tested positive for nitrite, and 1 sample (giraffe 2) tested positive for WBCs. No other abnormalities were detected. Microscopic examination of urine sediment revealed soil contaminants (pollen, vegetable fibers, rare mold spores, and bacteria) in all urine samples. Sperm were found in 17 urine sediments (5 in giraffe 1; 3 in giraffe 2; 6 in giraffe 3; 3 in giraffe 4), 9 samples (2 in giraffe 1; 2 in giraffe 2; 2 in giraffe 3; 3 in giraffe 4) had rare squamous epithelial cells; 1 sample from an adult male (giraffe 4) contained a granular cast. RBCs and WBCs were not detected in the urine sediment (Table 4).
Urine dipstick and microscopic sediment analysis of 4 adult male giraffes (group A).
Urine total protein, uCrea, and UPC results were 0.20 (0.08–0.47) g/L, 2.36 ± 1.22 g/L, and 0.09 ± 0.03, respectively (Tables 3 and 5). The adult male giraffe of group A, which had a granular cast in urine sediment, had a UPC value of 0.07.
Urine total proteins, urine creatinine, and urine protein-to-urine creatinine ratio in urine samples of 3 pregnant giraffes and a giraffe with cough (excluded from other analyses).
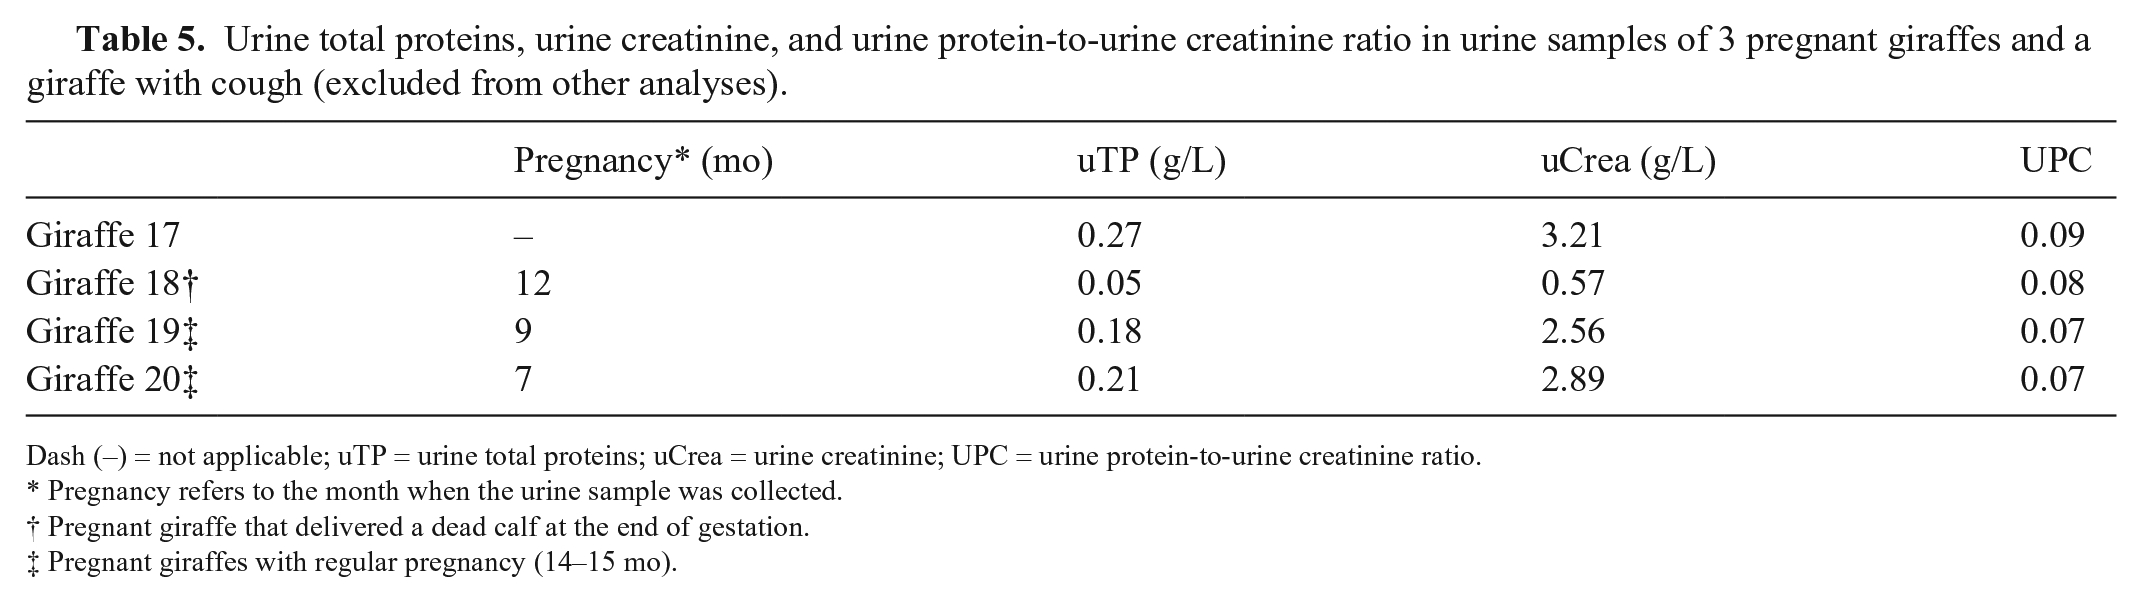
Dash (–) = not applicable; uTP = urine total proteins; uCrea = urine creatinine; UPC = urine protein-to-urine creatinine ratio.
Pregnancy refers to the month when the urine sample was collected.
Pregnant giraffe that delivered a dead calf at the end of gestation.
Pregnant giraffes with regular pregnancy (14–15 mo).
SDS-PAGE
The protein bands of all urine samples had apparent MMs of 90, 64, 49, 25, and 14 kD (Fig. 2). In group A, all samples had electrophoretic profiles characterized by a low number of protein bands. Most urine samples had 6 common bands at MMs of 90, 64, 49, 14, 13, and <10 kD.

Representative SDS-PAGE gel and pherogram of urine samples from giraffes.
In group B, the electrophoretic profiles had a mean value of 9 bands, ranging from 5 to 14. Most of the analyzed samples exhibited common protein bands with apparent MMs of 198, 90, 64, 49, 34, 25, 14, 13, and <10 kD. The giraffe calf (6 mo old) had both a few protein bands below the average of the group and the absence of bands at MM between 65 and 15 kD. In addition, the band with MM of 14 kD was more intense in the animal with cough (case 17) than in the other urine samples. The 2 pregnant giraffes (giraffes 19, 20), which gave birth to healthy calves, had an electrophoretic profile comparable to those determined for the other giraffes. Giraffe 18, which delivered a dead calf at the end of gestation, had an electrophoretic profile characterized by the presence of 2 additional bands at 120 and 60 kD and the absence of protein bands of <10 kD.
Discussion
The comparison of free-catch urine and urine sampled from the ground in cattle did not reveal statistical differences for any analytes investigated. Therefore, the use of this noninvasive sampling method was considered useful to obtain reliable data. SDS-PAGE on cattle urine demonstrated that the qualitative evaluation of urine proteins was also possible using ground-sampled urine. The electrophoretic profiles of the 2 aliquots (free-catch and from the ground) were not significantly different and were comparable to data reported previously. 19 The bands were clearly visible and distinguishable, and the qualitative evaluation can be considered reliable. Moreover, the linear model proved that the sampling method did not affect the quantitative results (percentage or micrograms of protein). Therefore, the application of SDS-PAGE to urine samples collected from the ground can produce reliable results.
USG values determined in giraffes were similar to those reported in the veterinary literature for calves and cows.10,16,45 In addition, the alkaline pH detected in giraffes was in accordance with previous findings in cattle, giraffes, and okapis.14-16,29,42
The dipstick test in giraffes was positive for proteinuria, and different causes should be considered when interpreting these results. In particular, dipstick proteins may test positive when urine is highly concentrated or has an alkaline pH, even though the animal is not proteinuric.6,23 In addition, contamination with non-protein compounds, such as non-protein pigments deriving from a vegetable-based diet, could also cause a positive reaction.4,23,30,34,39 As a result, the positive values for dipstick proteins should be carefully considered and compared with uTP and UPC values determined by quantitative methods. 34 Given that UPC values of giraffes were lower than the threshold established for domestic species, these specimens might be considered non-proteinuric and the protein dipstick findings a false-positive result.16,23
Some urine samples tested positive for nitrite, WBCs, and RBCs. The nitrite dipstick positivity might be the consequence of nitrate reductase activity from soil bacterial contamination, although in bovine urine the soil did not cause positivity. However, the dipstick nitrite positivity might also be affected by a vegetarian diet, and is not reported typically in veterinary medicine.34,39 Urine dipsticks are considered reliable for urine pH, glucose, ketones, bilirubin, occult blood, and protein. Consequently, the dipstick WBC positivity might be considered an unreliable result, also in light of the subsequent negative sediment analysis. 34 Similarly, dipstick positivity to RBCs might be to the result of soil contamination. A color change caused by reagent oxidation might not confirm the presence of blood cells. 37 Ions (e.g., iron) present in the soil may oxidize the reagent of the dipstick. Given that the microscopic examination of urine sediment confirmed the absence of RBCs, this interference could have been responsible for our positive results. However, lysis of RBCs cannot be completely excluded and might have contributed to the positivity of the test.6,30
The microscopic examination of the urine sediment in giraffes revealed a moderate-to-elevated presence of soil contaminants and bacteria, mainly as a result of the method of collection. It was likely that bacteria originated from the soil; it was not possible to determine if true infectious agents were present. Therefore, this sampling method is not suggested to diagnose urinary tract infection. Nevertheless, the contaminants did not interfere with the overall microscopic examination given that all of these elements were easily distinguishable from cells, casts, and other biological findings. A granular cast was identified only in one urine sediment. Granular and hyaline casts can originate from physiologic turnover of tubular cells, and a few casts per field can also be found in the urine of healthy animals; thus, although this giraffe’s urine was non-proteinuric and concentrated (USG > 1.035), it is reasonable to assume that this was a physiologic finding.6,41
To our knowledge, reference intervals for uTP, uCrea, and UPC have not been reported previously for giraffes. Consequently, we compared our data to the veterinary literature on companion and farm animals. Urine creatinine concentration results obtained in our study were lower than the data described in a previous paper on giraffes, which reported a significant correlation between uCrea and the concentrate-to-hay ratio. 42 However, the previous study did not report data on the USG. Nevertheless, the giraffes studied in our research were rarely fed concentrates, and the lower creatinine value observed might be a consequence of a different diet. Under physiologic conditions, ruminant urine contains low amounts of protein. Our data are similar to those reported by other authors for healthy dairy cows and heifers.16,19 Giraffes included in our study had low UPC values compared to small animals and cows. 16 In the absence of reference data, considering the threshold value established for dogs, cats, and cows, all the giraffes included in our study could be classified as non-proteinuric (UPC < 0.2).16,23 Therefore, our data, although preliminary, could be considered indicative of a normal physiologic condition for giraffes.
SDS-PAGE revealed a similar profile in most of the urine samples, with common protein bands at MMs of 90, 64, 49, 25, 14, and 13 kD, which could represent a typical set of proteins physiologically present in urine of healthy giraffes. The identity of some of the bands could be hypothesized basing on the apparent MM and the data reported in the literature for humans and animals. Noticeably, the band at 90 kD might be uromodulin, followed by putative albumin at 64 kD. Uromodulin is produced by healthy renal tubular cells and is one of the most abundant urinary proteins in healthy mammals. Uromodulin has been found in the urine of camels, dogs, and cats.1,3,12,13,26,38 Albumin has been detected in the urine of different species, including dogs, cattle, goats, and camels.1,3,26,31,35 In urine of healthy animals, a small amount of albumin is present, whereas its increase indicates glomerular damage. 17 The bands at 49 and 25 kD could be the putative heavy and light chains of immunoglobulins, also described in the urine of camels and dogs.1,3 The presence of putative uromodulin and the low abundance of putative albumin and immunoglobulins, associated with low UPC values, suggested the absence of renal damage in giraffes in our study.
The presence of bands at 60 and 120 kD in the urine of pregnant giraffe 18 is challenging to interpret. These MMs are in the reported range for the monomer and the dimer of pregnancy-associated glycoproteins, a well-known family of glycoproteins found in serum and milk of ruminants and considered helpful in the diagnosis of pregnancy and in the detection of embryonic mortality. 40 More studies are required to detect and confirm the presence of these proteins in giraffes.
Our study presented limitations that should be considered when interpreting the results. The first limitation of our study was the absence of a full assessment of the health status of these giraffes. It would be necessary to obtain a larger number of specimens in known healthy giraffes to confirm our preliminary results before establishing reference intervals. The second limitation is the possible soil contamination that might affect some urine samples. This preanalytical variable might be responsible for some false positivity to RBCs, protein, or nitrate of the dipstick results, and could be related to soil composition. Dipstick RBC positive results should be compared to the microscopic examination of urine sediment, and the dipstick protein positivity to uTP and UPC values obtained by quantitative analytical techniques.
Urine sampling from the ground did not require direct contact with the animals, therefore no sedation was needed, making this protocol useful and simple to perform in captivity, and useful for routine clinical evaluations. This method could be helpful not only in the early diagnosis of renal impairment, but also in monitoring urinary system status and potential detection of crystalluria, given that uroliths have been reported in giraffes.42,43,46
Footnotes
Acknowledgements
A portion of our data was presented as a poster during the ICARE (International Conference on Avian Herpetological and Exotic Mammal Medicine) in Paris, France, April 18–23, 2015. We thank Dr. Rainer Schneider for providing the urine samples of giraffes from Parco Faunistico Le Cornelle, and to the animal caretaker Fulvio Pendezza for his help in urine sampling. We thank the staff of Parco Natura Viva for helping with urine collection. We also thank Drs. Caterina Spiezio and Barbara Regaiolli for their assistance in manuscript writing. We thank Dr. Francesca Lino for her assistance in the statistical analysis, and Drs. Enrico Benato and Annarenza Zocca for their assistance with the cow’s urinalysis.
Declaration of conflicting interests
The authors declared no potential conflicts of interest with respect to the research, authorship, and/or publication of this article.
Funding
This work has been in part supported by a grant of the University of Bologna for Oriented Fundamental Research (RFO).