
Abstract
Objectives
This study aimed to develop a quantitative scoring method for the evaluation of mucosal fibrosis (MF) and assess its correlation with World Small Animal Veterinary Association scores, clinical abnormalities, disease severity, diagnosis and outcome in cats with lymphoplasmacytic enteritis (LPE) or low-grade intestinal T-cell lymphoma (LGITL).
Methods
Formalin-fixed, paraffin-embedded small intestinal biopsy specimens from 13 cats with LPE and 14 cats with LGITL were included. MF was quantitatively measured in three separate areas (villi, apical crypts [ACs] and basal crypts) using an image processing program. The fractional fibrotic area (%FFA) was calculated based on the mean fibrosis scores in five representative fields. MF was also scored by a single board-certified pathologist on sequential slides stained with either hematoxylin and eosin (H&E) or Masson’s trichrome (MT) on a four-point scale in the areas described above. Statistical analysis was performed to assess the correlation between clinical and pathological variables, diagnosis and outcome.
Results
The %FFA scores correlated well with fibrosis scores on MT stains (r = 0.52, P = 0.01) but did not correlate with H&E stains (r = 0.29, P = 0.14). The %FFA in the villi and AC area was negatively correlated with a modified Feline Chronic Enteropathy Activity Index in cats with LGITL (r = −0.57, P = 0.04). A histopathologic diagnosis of LPE showed a weak correlation with MF in the AC area (r = 0.38, P = 0.05). The survival time of cats with chronic enteropathy (CE) was weakly negatively correlated with MF (r = −0.38, P = 0.05).
Conclusions and relevance
MF is more effectively assessed using MT staining compared with H&E staining alone. Increased MF in the AC region may indicate a diagnosis of LPE. Although increased MF did not correlate with increased disease activity, it appears to be a negative prognostic factor for survival in cats with CE.
Keywords
Introduction
Chronic enteropathies (CEs) in cats comprise mostly lymphoplasmacytic enteritis (LPE; also known as inflammatory bowel disease [IBD]) and low-grade intestinal T-cell lymphoma (LGITL; also known as alimentary small-cell lymphoma). 1 Guidelines produced by the World Small Animal Veterinary Association (WSAVA) include mucosal fibrosis (MF) as a criterion for the histopathologic assessment of the intestinal mucosa. 2 Studies have shown that MF is more common in LPE than in LGITL and that an apical-to-basal gradient exists, with fibrosis being more prominent in the apical regions of the lamina propria for LPE and in the basal regions for LGITL.3,4 However, data on MF and its association with disease severity and outcome are scarce. 5 Intestinal fibrosis (IF) has been identified as a common and serious complication associated with increased morbidity and mortality in humans with IBD.6,7
Fibrosis, the replacement of healthy tissue with collagen-rich extracellular matrix (ECM), is triggered by inflammation. 8 In physiological wound healing, ECM and collagen deposition is self-limiting and ends with the restoration of the damaged tissue. However, under chronic inflammation, fibrosis becomes dysregulated, leading to the accumulation of excessive scar tissue. 9
Masson’s trichrome (MT) staining is the gold standard for assessing fibrosis in formalin-fixed, paraffin-embedded (FFPE) biopsy specimens. However, hematoxylin and eosin (H&E)-stained tissue sections are routinely assessed by pathologists in cases of CE, raising the question whether IF might be underreported.10,11
The aim of the present study was to develop and utilize a quantitative scoring method for the evaluation of MF in cats with LPE or LGITL. In addition, we aimed to assess its correlation with traditional semi-quantitative WSAVA scores on H&E and MT-stained slides, clinical abnormalities, disease severity, diagnosis and outcome.
Materials and methods
Sample cohort
The tissue archive of the Alfort School of Veterinary Medicine was searched for intestinal biopsy specimens from cats diagnosed with idiopathic LPE (herein referred to as LPE) or LGITL between June 2017 and January 2022 (IACUC: ENVA COMERC n 2017-05-09). All owners gave prior written consent. Samples from cats with chronic (⩾3 weeks) clinical signs of gastrointestinal disease (weight loss, vomiting, diarrhea, anorexia, polyphagia) were eligible for enrollment. All cats underwent a standard diagnostic work-up, including a physical examination, complete blood count and a serum biochemistry panel. Intestinal tissue biopsy specimens were collected via laparotomy or endoscopy. The final diagnosis was based on histopathologic evaluation of H&E-stained slides from FFPE specimens. Cats were categorized as having LPE or LGITL based on histopathologic assessment of at least two locations (ie, duodenum and ileum). Samples used for MF analysis had to be consistent with the final diagnosis. Where indicated, immunohistochemistry stains for CD3, CD20, Ki-67, STAT3 or STAT5 were performed. Cats with uncontrolled systemic extraintestinal disease and cats responding to dietary modification (hypoallergenic diets) or symptomatic treatments (anthelminthics, antimicrobials, proton pump inhibitors) were excluded from the study. All cats were treated with corticosteroids and either diet (LPE) or chlorambucil (LGITL).
Sample preparation, histopathology and WSAVA fibrosis scoring
Biopsy specimens most representative of the underlying disease process (ie, LPE or LGITL) were selected for analysis. FFPE biopsy specimens were cut in 4 μm sections, sequentially mounted on glass slides and shipped to the UC Davis School of Veterinary Medicine. Slides were batch stained using H&E or MT stain, respectively, on sequential slides. Slides were scanned at 400× magnification and uploaded to a web-based histopathology platform for analysis.
A single board-certified veterinary pathologist (PRG) blindly assessed and scored H&E-stained slides according to the guidelines published by the WSAVA.2,12 The degree of fibrosis was semi-quantitatively assessed on a four-point scale on H&E and MT-stained slides (0/absent: fibrosis ⩽10%; 1/mild: fibrosis 10–30%; 2/moderate: fibrosis 30–50%; 3/severe: fibrosis >50%). Three areas of the mucosal lamina propria were assessed separately: the villi, apical crypts (ACs; corresponding to the lamina propria from the base of the villi to the upper half of the crypts) and basal crypts (BCs; corresponding to the lower half of the crypts up to but excluding the muscularis mucosae) (Figure 1). To avoid visual memory effect, reassessment of sequential slides was performed after an 8-week wash-out period. 13 Cases were excluded if the biopsy specimens were of poor quality (eg, poor tissue orientation, inadequate amount of tissue).
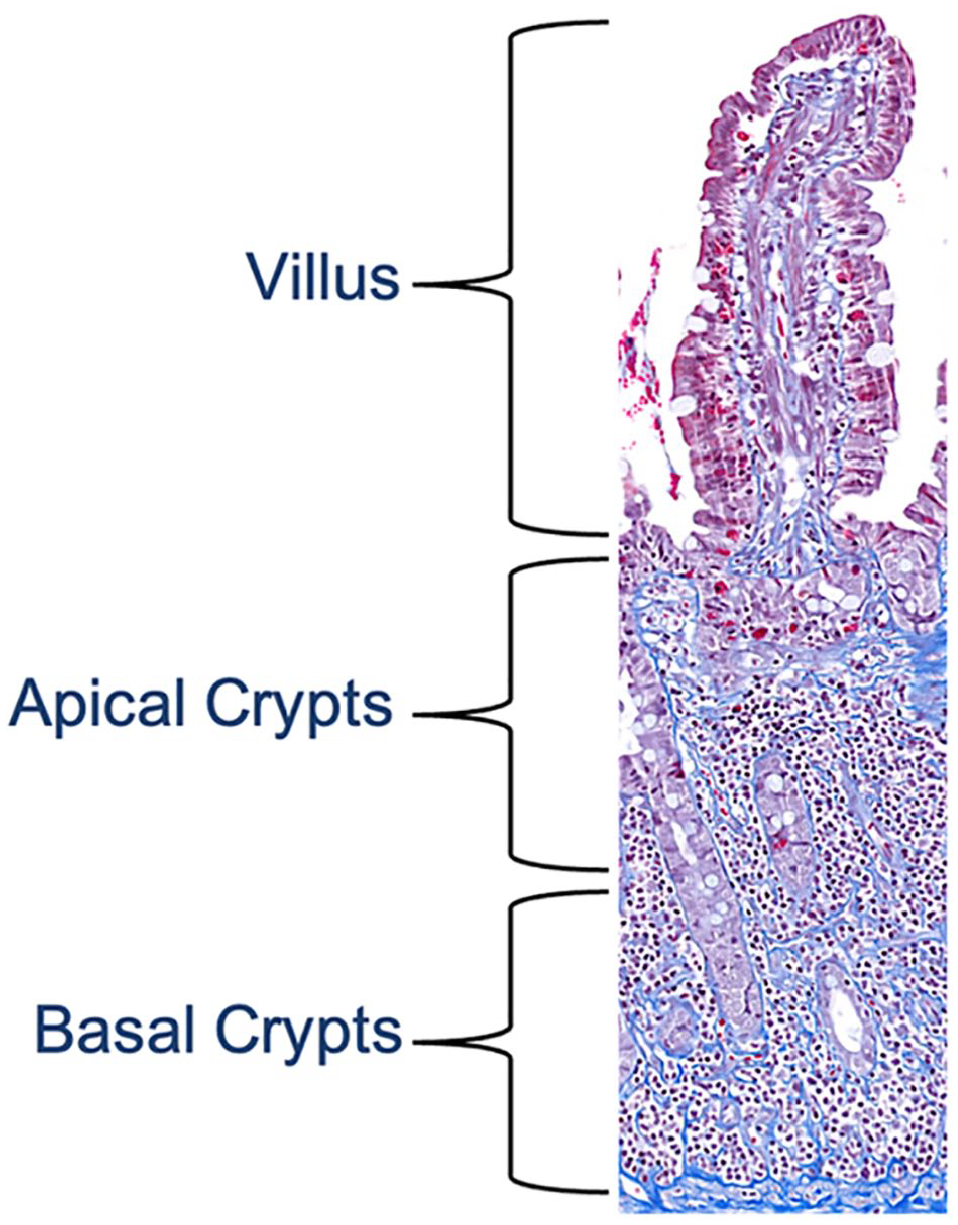
Masson’s trichrome-stained small intestinal biopsy specimen from a cat with chronic enteropathy, × 100 magnification. The section depicts the mucosal layer. Collagen fibers in the lamina propria are stained in blue, while the epithelium and other cells are stained in red to purple. The mucosal lamina propria was divided into the villus, apical crypts (base of the villi to the upper half of the crypt area) and basal crypts (the lower half of the crypt area up to but excluding the muscularis mucosae)
Quantitative measurement of mucosal fibrosis
MF in the lamina propria was quantified using the image processing software ImageJ on MT-stained slides. 14 MF was determined in five representative areas where both the villi and crypt areas were fully present with no visible processing artefacts (eg, tissue folding, gaps or stain accumulations). For each area, regions of interest were manually selected using the freehand tool within the same three distinct mucosal regions as described above (Figure 2). The color threshold was adjusted so that the blue MT stain, consistent with fibrosis, was selected by the image processing program as target areas. Using the analyze tool, the fractional fibrotic area (%FFA) was calculated in each highlighted section and expressed as the mean of five regions.

View of Massone’s trichrome (MT)-stained small intestinal biopsy specimen from a cat with lymphoplasmacytic enteritis scanned and processed with the software ImageJ. 14 To better visualize fibrotic areas, the color red was chosen as the default coloring for the blue MT-stained areas corresponding to fibrosis. (a) Fibrosis is seen in the lamina propria and throughout the submucosa. Regions of interest (ROIs) (yellow lines), here represented by the villi, were identified and captured using the freehand tool. Fibrosis was quantified in each area as fractional fibrotic area (%FFA). × 50 magnification. (b) Areas within the epithelium and lumen falsely identified as fibrosis (black arrows) were excluded from the %FFA calculation by manually adjusting the ROIs (indicated by yellow lines). × 200 magnification
Data and statistical analysis
A modified Feline Chronic Enteropathy Activity Index (FCEAI; index range 0–20) 15 was calculated using a binary scale (absent = 0, present = 1) (Tables 1 and 2). Abnormal abdominal palpation was determined using a binary scale (absent = 0, present = 1), requiring at least one of the following clinical signs to be present: painful abdomen, thickened intestines or lymphadenomegaly. Duration of clinical signs was added to the calculation as an ordinal score (0 = 3 weeks to 3 months; 1 = 3–6 months; 2 = 6–12 months; 3 ⩾ 1 year). 16
Signalment of cats with lymphoplasmacytic enteritis (LPE) and low-grade intestinal T cell lymphoma (LGITL)

Data are median (range) unless otherwise indicated
Frequency of specific clinical signs/clinicopathologic abnormalities in cats with lymphoplasmacytic enteritis (LPE) or low-grade intestinal T cell lymphoma (LGITL)

Clinical signs and clinicopathologic abnormalities were used to calculate a modified Feline Chronic Enteropathy Activity Index
Statistical analysis was performed using the computer software GraphPad PRISM version 10.2.3. Data were tested for normality (D’Agostino & Pearson and Shapiro–Wilk test) and further calculations were performed using either the median or mean scores where appropriate. Dunn’s multiple comparison test was used to assess significant differences between the %FFA in the villi, ACs and BCs.
Correlation of %FFA with clinical and laboratory parameters, and the correlation between different scoring methods, were performed using the Spearman rank test. Positive and negative correlations were rated as negligible, weak, moderate, strong or very strong based on the respective r values. 17 The association between MF and outcome was evaluated using Kaplan–Meier plots and the log rank Mantel–Cox test (in days between initial presentation and time to last follow-up on 11 December 2024). Kaplan–Meier survival analysis requires ordinal data, which is why WSAVA fibrosis scores were used for these calculations instead of %FFA. Cats that were lost to follow-up or died from competing causes were treated as censored observations. Statistical significance was set at P ⩽0.05.
Results
Study population
A total of 27 cases met the inclusion criteria, of which 13 cases were classified as LPE and 14 cases as LGITL (Tables 1 and 2). 3
Samples were obtained from the small intestinal tract and included five duodenal samples (one LPE and four LGITLs; all samples were obtained endoscopically), 17 jejunal samples (10 LPEs, seven LGITLs; all samples were obtained surgically) and five ileal samples (two LPEs, three LGITLs; two samples were obtained endoscopically and three were obtained surgically).
Correlation between H&E and MT scores
WSAVA fibrosis scores correlated moderately between H&E and MT stains (r = 0.64, P <0.001). On MT slides, WSAVA fibrosis scores also correlated moderately with %FFA scores (r = 0.52, P = 0.01). Consequently, correlations between MF and clinicopathologic data were calculated using %FFA scores only. Traditional semi-quantitative (WSAVA) fibrosis scoring performed on H&E-stained slides did not correlate well with %FFA on MT stains (r = 0.29, P = 0.14). Furthermore, MT staining identified MF in two additional cases compared with H&E alone (25 [93%] vs 23 [85%] cases).
Clinical signs and physical examination
A negative correlation between diarrhea and the median %FFA in all cats (r = −0.48, P = 0.01) and in cats diagnosed with LGITL (r = −0.61, P = 0.02) was identified. In cats with LPE, a negative correlation was also found between %FFA in the villi and the occurrence of vomiting (r = −0.63, P = 0.03). In addition, an abnormal abdominal palpation and the palpation of thickened bowel loops were moderately negatively correlated with %FFA scores in the small intestinal villi (r = −0.59, P = 0.001; r = −0.51, P = 0.006). The FCEAI was moderately negatively correlated with villi and AC %FFA scores in cats with LGITL (r = −0.57, P = 0.04; r = −0.55, P = 0.04). Lastly, the duration of clinical signs was weakly negatively correlated with MF in the AC areas in cats with CE (r = −0.39, P = 0.04) (Table 3).
Significant Spearman rank correlations between fractional fibrotic area (%FFA) scores and clinicopathologic variables in cats with chronic enteropathy (CE)

All cats: n = 27; LPE: n = 13; LGITL: n = 14
All correlations were calculated for each condition (LPE vs LGITL) as well as both conditions combined (all cats). Only clinicopathologic variables with significant results are presented. Groups (all cats, LPE, LGITL) are included in the table only if they showed a correlation
AC = apical crypt; BC = basal crypt; LGITL = low-grade intestinal T-cell lymphoma; LPE = lymphoplasmacytic enteritis; NS = not significant
Histopathologic examination and diagnosis
Cats with LPE showed significantly higher %FFA scores in the AC areas compared with the villi (Dunn’s multiple comparison test, P <0.001). Similarly, cats with LGITL had significantly higher %FFA scores in the BC area compared with the villi (Dunn’s multiple comparison test, P <0.001).
Our study revealed moderate negative correlations between the %FFA score in the AC area in cats with LPE and infiltration with lymphocytes and plasma cells (r = −0.59, P = 0.03) and neutrophils (r = −0.60, P = 0.03) (Table 3).
There was a moderate positive correlation between lymphoplasmacytic infiltration in the lamina propria and the palpation of thickened intestinal loops in cats with LGITL (r = 0.63, P = 0.03). No significant correlation was observed between %FFA and the overall histopathologic WSAVA score on H&E (see Table 1 in the supplementary material for all correlations).
We found a weak correlation (r = 0.38, P = 0.05) between MF in the AC area, calculated as %FFA, and a histopathologic diagnosis of LPE (Table 4).
Quantitative assessment (median fractional fibrotic area [%FFA]) of mucosal fibrosis in the villi, apical crypt (AC) and basal crypt (BC) areas in intestinal biopsy specimens from cats with either lymphoplasmacytic enteritis (LPE) or low-grade intestinal T-cell lymphoma (LGITL)
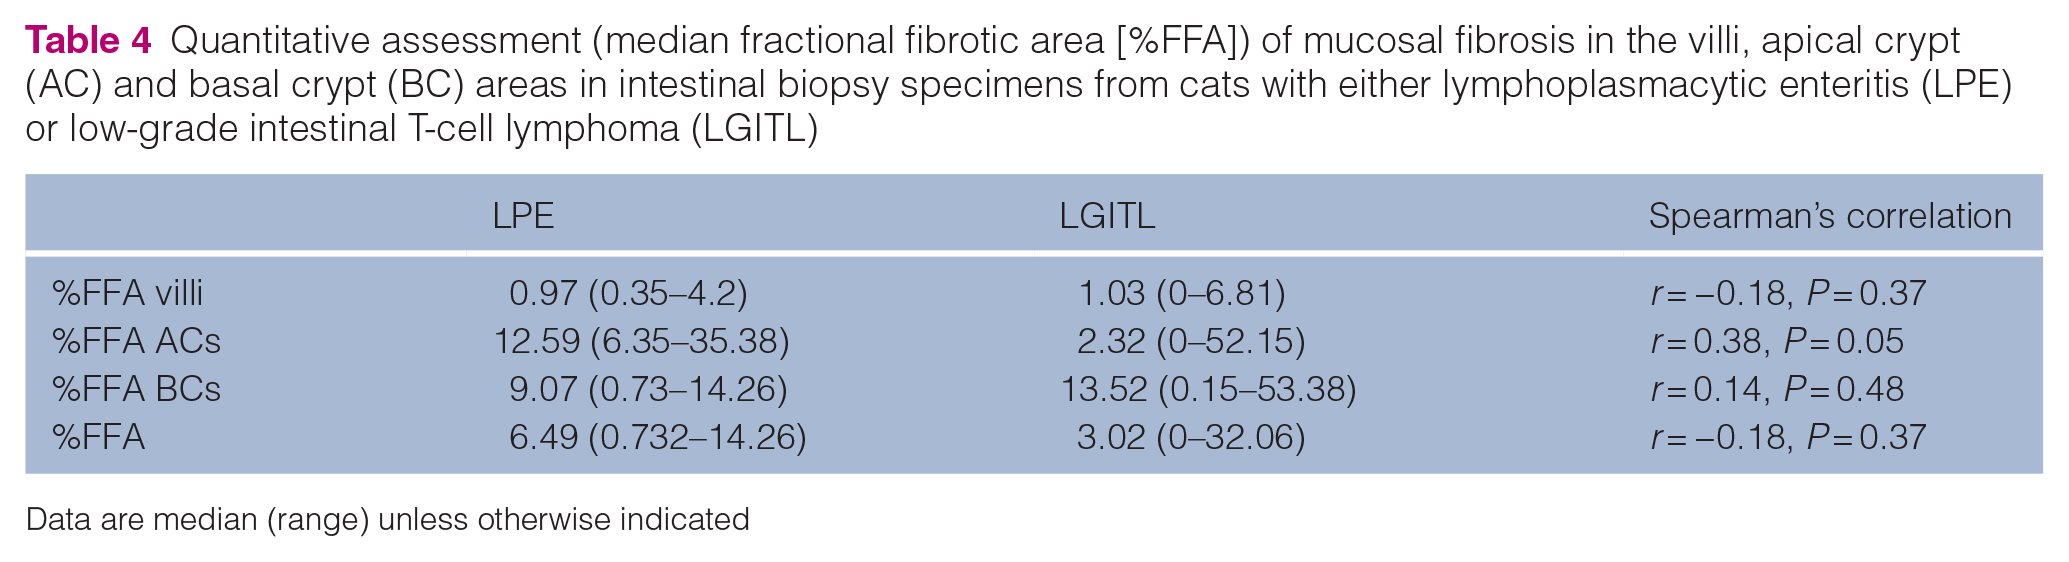
Data are median (range) unless otherwise indicated
Outcome
Investigating the correlation between MF and clinical outcome, we found a weak negative correlation between median %FFA scores and survival time in all cats (r = −0.38, P = 0.05). When evaluating correlations between %FFA scores and survival in different groups (ie, LPE vs LGITL), cats with LGITL showed a moderate negative correlation (r = −0.58, P = 0.03). However, the same was not found in cats with LPE (r = −0.26, P = 0.39). Based on a Kaplan–Meier survival analysis (based on ordinal WSAVA fibrosis scores), the median survival time of cats with LPE in which fibrosis was absent was not reached, while cats with mild MF had a median survival time of 1242 days. However, this difference did not reach statistical significance (P = 0.95; P = 0.69) (Figure 3).

Kaplan–Meier survival graphs for cats with (a) lymphoplasmacytic enteritis (LPE) and (b) low-grade intestinal T-cell lymphoma (LGITL). Each graph illustrates the survival probability over time (in days) for cats with LPE or LGITL based on the degree of fibrosis on Masson’s trichrome-stained slides. The green line represents cats with no fibrosis, the red line represents cats with mild fibrosis and the blue line represents cats with moderate fibrosis. (a) Cats with LPE and mild fibrosis had a median survival time of 1242 days (range 1–1595). The median survival time for cats with no fibrosis was not reached, indicating prolonged survival in this group. However, no statistically significant difference was detected between the two groups (P = 0.95). (b) Although cats with mild fibrosis had a lower probability of survival compared with cats with no fibrosis, this difference was not statistically significant (P = 0.69). No median survival time was reached for any group
Discussion
Our study revealed that median WSAVA fibrosis scores correlated moderately with %FFA using MT stains but showed no correlation when WSAVA scoring was applied to H&E-stained slides. MT stains aided in the identification of MF in a small subset of cases (85% vs 93%). Similarly, a previous study found MT and vimentin staining helpful in identifying additional cases of fibrosis in intestinal samples compared with H&E alone. 5 This suggests that MF is underreported and additional methods are required to improve fibrosis assessment. Although %FFA scores provide the most accurate representation of MF, image processing software is neither time- nor cost-efficient. MT staining offers a more practical and cost-effective alternative and should be used more routinely when evaluating cases of CE. However, with advancing artificial intelligence, image processing software remains a promising tool for future exploration.
Our study showed a moderate negative correlation between mucosal %FFA scores and abnormal findings on abdominal palpation, while the degree of mucosal lymphoplasmacytic infiltration was positively correlated with the palpation of thickened intestinal loops in cats with LGITL. Replacement of normal parenchyma with fibrotic tissue in chronic inflammatory conditions may lead to organ shrinkage, depending on the stage of inflammation and fibrosis. Although hepatitis and nephritis present with organomegaly in the early stages of active inflammation, chronic conditions are characterized by organ shrinkage, decreased organ weight and progression of tissue fibrosis.18 –20 This might explain our findings of a negative correlation between MF and the detection of thickened bowel loops on abdominal palpation in cats with LPE. Our findings also indicate that the thickening of the intestine in cats with CE may be predominantly driven by the cellular infiltrate, edema and possibly a thickened muscularis mucosae or propria layer instead of MF. This is supported by a previous study on the correlation between ultrasonographic changes and histopathologic findings in the intestine of cats with CE. 21 The authors found no correlation between a thickened submucosa or muscularis layer on ultrasonography and histopathologic lesions in that area, while ultrasonographic abnormalities in the mucosa were highly predictive of mucosal histologic lesions. However, abdominal palpation is operator dependent and multiple veterinarians were involved in physical examinations for the cases used in our study. Hence, this correlation requires further investigation using more objective measurements.
Interestingly, we observed a moderate negative correlation between mucosal %FFA scores and diarrhea or vomiting in LGITL and LPE cases, respectively. This contrasts with a recent study that reported a weak positive correlation between diarrhea and MF in the colon of cats with LPE. 5 Differences in study populations, biopsy locations and staining methods may explain this discrepancy. Furthermore, while the previous study used only semi-quantitative fibrosis scoring, data analysis in our study focused on quantitative methods.
Cats with LPE showed significantly higher %FFA scores in the AC areas compared with the villi (P <0.001), and fibrosis in the AC region was weakly correlated with a diagnosis of LPE. Our results align with the recent findings of a study using binary fibrosis scores, which showed superficial IF to be associated with a diagnosis of LPE in cats. 3 The same study also found fibrosis in the deep lamina propria layers and the submucosal layers to be associated with a diagnosis of LGITL in cats. 3 Although our study did find higher %FFA scores in the BC areas in cats with LGITL compared with LPE, the variability was high and hence did not reach statistical significance (Table 4). A post-hoc sample size calculation revealed that up to 125 cases per group would be required to show significance. Hence, this study was underpowered to detect this difference. In addition, since the scope of this study was to assess MF, the submucosal area was excluded from analysis.
Previous studies described an apical-to-basal gradient of cellular infiltrates, with the highest infiltration observed in the villi for LGITL.3,4 The cellular infiltrates may obscure fibrosis, potentially explaining the differences in fibrosis distribution between LGITL and LPE. Alternatively, the distribution patterns may represent different disease pathogenesis or progression, given that LGITL may infiltrate transmurally while LPE does not. 22
Analysis of %FFA found MF to be a negative prognostic factor in cats with CE (r = −0.38, P = 0.05). However, a Kaplan–Meier survival analysis, performed using WSAVA scores, did not reveal statistically significant differences in survival times between cats with or without MF (Figure 3). The differences in results between these two analyses likely stem from the lack of correlation between %FFA and WSAVA scoring.
Our findings of shortened survival time with increased fibrosis align with a previous study reporting correlations between colonic MF, thickening of the muscularis propria layer of the colonic wall on abdominal ultrasonography and a shortened survival time in cats with CE. 5 However, the same study did not find a correlation between MF in the small intestine and survival times. As mentioned above, differences in the study population, number of cats and design may have contributed to the different findings.
Our study has several limitations. The sample size was small and fibrosis scores were highly varied, which limited the study’s power. In addition, samples from various segments of the small intestinal tract were used for analysis and the variability of location may have introduced bias in the sample population. However, a final diagnosis was based on histopathologic examination of at least two locations (ie, the duodenum and ileum) and only samples most representative of the underlying disease process were analyzed. Nonetheless, we cannot exclude that localized lesions may have been missed. The common presence of inflammatory lesions in LGITL and the suspected progression from LPE to LGITL may have affected our results. Our analysis focused exclusively on MF; therefore, no conclusions on transmural fibrosis can be made. Our study did not include vimentin or collagen-specific stains, which could have aided in the additional identification of fibrosis. Histological analysis was conducted by a single board-certified pathologist. It is possible that semi-quantitative WSAVA scoring of MF varies between pathologists. 23 Factors such as tissue thickness, duration of fixation and age of stain can influence the histologic staining. To reduce this effect, batch stains were used for H&E and MT stains. The determination of %FFA was performed using the image processing software ImageJ with manual adjustments (Figure 2). We cannot exclude that the manual adjustments may have introduced bias into the measurements. Investigating the effect of variation in biopsy collection (endoscopy vs laparotomy), quality and total tissue availability on the detection of fibrosis, and therefore identifying correlations, was outside the scope of this study. Accurately assessing the duration of disease is challenging because occult intestinal disease is often present long before clinical signs are observable. Lastly, treatment regimens were not standardized and it is possible that other factors, including variabilities in treatment, may have affected the disease outcomes.
Conclusions
This study investigated the correlation between MF and clinical, pathological and outcome measures in small intestinal tissue biopsy specimens from cats with CE. Our findings showed no correlation between WSAVA fibrosis scores on H&E staining and the %FFA scores, indicating that H&E staining alone may not be sufficient for identifying fibrosis and MT staining should therefore be used more routinely when evaluating cases of CE. Palpation of thickened intestinal loops appeared to be mostly driven by mucosal infiltrate, while increased MF was not associated with abnormal abdominal palpation findings. In this study cohort, cats with LPE and higher mucosal %FFA scores had a lower incidence of vomiting. Cats with LGITL and higher %FFA scores had a lower incidence of diarrhea and a lower FCEAI, which may indicate a quiescent inflammatory stage. Lastly, we found MF to be a negative prognostic factor for survival in cats with CE.
Supplemental Material
Supplementary Table 1
Correlations between %FFA scores and clinicopathologic variables.
Footnotes
Author note
This paper was presented in part at the American College of Veterinary Internal Medicine Annual Forum 2023.
Supplementary material
The following file is available as supplementary material:
Supplementary Table 1: Correlations between %FFA scores and clinicopathologic variables.
Conflict of interest
SM has been a paid speaker for IDEXX laboratories, Purina and Dutch and her lab received research support from Inaba, Inc. PRG is an employee of the Texas A&M Gastrointestinal Laboratory offering laboratory tests on a fee-for-service basis. The remaining authors declared no potential conflicts of interest with respect to the research, authorship, and/or publication of this article.
Funding
The study was funded by the UC Davis School of Veterinary Medicine Students Training in Advanced Research (STAR) Program.
Ethical approval
The work described in this manuscript involved the use of non-experimental (owned or unowned) animals. Established internationally recognized high standards (‘best practice’) of veterinary clinical care for the individual patient were always followed and/or this work involved the use of cadavers. Ethical approval from a committee was therefore not specifically required for publication in JFMS. Although not required, where ethical approval was still obtained, it is stated in the manuscript.
Informed consent
Informed consent (verbal or written) was obtained from the owner or legal custodian of all animal(s) described in this work (experimental or non-experimental animals, including cadavers, tissues and samples) for all procedure(s) undertaken (prospective or retrospective studies). No animals or people are identifiable within this publication, and therefore additional informed consent for publication was not required.
References
Supplementary Material
Please find the following supplemental material available below.
For Open Access articles published under a Creative Commons License, all supplemental material carries the same license as the article it is associated with.
For non-Open Access articles published, all supplemental material carries a non-exclusive license, and permission requests for re-use of supplemental material or any part of supplemental material shall be sent directly to the copyright owner as specified in the copyright notice associated with the article.