
Abstract
Feline chronic enteropathy is a poorly defined condition of older cats that encompasses chronic enteritis to low-grade intestinal lymphoma. The histological evaluation of lymphocyte numbers and distribution in small intestinal biopsies is crucial for classification and grading. However, conventional histological methods for lymphocyte quantification have low interobserver agreement, resulting in low diagnostic reliability. This study aimed to develop and validate an artificial intelligence (AI) model to detect intraepithelial and lamina propria lymphocytes in hematoxylin and eosin-stained small intestinal biopsies from cats. The median sensitivity, positive predictive value, and F1 score of the AI model compared with the majority opinion of 11 veterinary anatomic pathologists, were 100% (interquartile range [IQR] 67%–100%), 57% (IQR 38%–83%), and 67% (IQR 43%–80%) for intraepithelial lymphocytes, and 89% (IQR 71%–100%), 67% (IQR 50%–82%), and 70% (IQR 43%–80%) for lamina propria lymphocytes, respectively. Errors included false negatives in whole-slide images with faded stain and false positives in misidentifying enterocyte nuclei. Semiquantitative grading at the whole-slide level showed low interobserver agreement among pathologists, underscoring the need for a reproducible quantitative approach. While semiquantitative grade and AI-derived lymphocyte counts correlated positively, the AI-derived lymphocyte counts overlapped between different grades. Our AI model, when supervised by a pathologist, offers a reproducible, objective, and quantitative assessment of feline intestinal lymphocytes at the whole-slide level, and has the potential to enhance diagnostic accuracy and consistency for feline chronic enteropathy.
Keywords
Feline chronic enteropathy (FCE) is a common cause of morbidity and mortality in old cats. 14 Histologic quantification and localization of lymphocyte infiltrates in small intestinal biopsies is an integral part of distinguishing chronic enteritis from low-grade intestinal lymphoma and to assess the severity of the condition. 14 However, healthy cats and cats with FCE can have similar histologic characteristics, and criteria for separating inflammation from low-grade intestinal lymphoma are contentious. 14 In addition, multiple studies have demonstrated low interobserver agreement for pathologists grading of lymphocyte infiltrates in cats, despite the use of standardized semiquantitative grading schemes. 29 The inherent low reproducibility of histologic grading undermines the statistical power of research studies and contributes to skepticism among clinicians regarding the utility of biopsies for the diagnosis of FCE.
Recent advancements in whole-slide imaging and artificial intelligence (AI) have facilitated the development of AI models for histopathology. 2 Convolutional neural networks, the most common type of AI algorithm for advanced image analysis, have shown promise in improving the reproducibility of histologic evaluations in diagnostic practice. 2 AI models for histopathology can be employed at the image level to predict a diagnosis (image classification tasks), at the object level to identify specific image elements (object detection tasks), or at the pixel level to predict a label for each pixel (segmentation tasks). 13 In contrast to image level AI models and semiquantitative grading by a pathologist, object detection models and semantic segmentation models enable the extraction of quantitative features from histology slides. This allows the identification of histologic patterns and facilitates the integration of histology results into multimodal analyses.
The objective of this study was to develop and validate an AI model to quantify intraepithelial and lamina propria lymphocytes in hematoxylin and eosin (H&E)-stained small intestinal biopsies from cats. The ultimate purpose of the model is to enhance the diagnostic accuracy and consistency of histologic diagnoses for FCE by providing a reproducible, objective, and quantitative assessment of feline intestinal lymphocytes at the whole-slide level.
Materials and Methods
Model Design
To quantify intraepithelial and lamina propria lymphocytes, we developed 2 separate models and merged the model outputs (Fig. 1): a “cell detection” model that utilized object detection with instance segmentation to detect lymphocytes and identify lymphocyte nucleus boundaries, and a “mucosal compartment” model that used semantic segmentation to classify pixels into epithelium, lamina propria, intestinal lumen, or other. In a postanalysis step, lymphocytes were then classified as intraepithelial or lamina propria lymphocytes depending on whether the center of a lymphocyte was located within the epithelium or lamina propria. Both models were strongly supervised convolutional neural networks, developed using Aiforia create (Helsinki, Finland). Settings and versions are detailed in Supplemental Table S1.
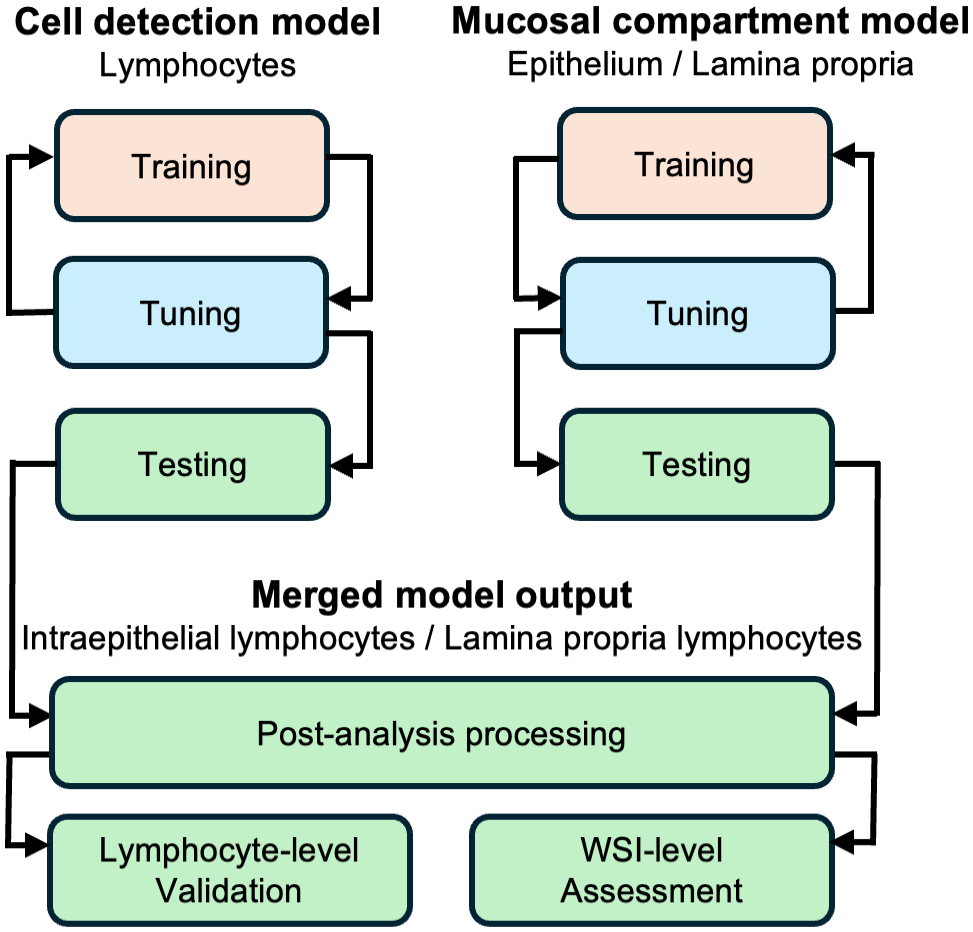
Model design. Two distinct artificial intelligence models were iteratively trained. Between training rounds, intermediate versions underwent tuning using a separate set of slides. If tuning results were unsatisfactory, training sizes were increased or hyperparameters were adjusted. Once tuning set performances were deemed satisfactory, the models were finalized and applied to manually outlined sections of small intestine in the test set slides. Analysis results were merged during postprocessing. Performance was validated at the lymphocyte level and concordance with pathologist grades was assessed at the whole-slide image (WSI) level.
Case Material
The AI models were developed and tested using retrospectively obtained feline small intestinal biopsies that were submitted for clonality testing to the Leukocyte Antigen Biology Laboratory at the School of Veterinary Medicine, University of California Davis between 2010 and 2020. A total of 383 cases from 11 different laboratories were sampled and 1 H&E-stained slide per case was randomly selected for digitization (Fig. 2). Cases were included regardless of diagnosis, biopsy type, or slide quality. Table 1 contains a summary of the original diagnoses (based on histology, immunohistochemistry, and clonality assessments) for slides included in the training, tuning, and test sets. Supplemental Table S2 contains signalments and original diagnoses for all cases in the study. Cases where slides were missing, lacked small intestinal tissue, or failed scanning were excluded (n = 50). The remaining slides (n = 333) were divided into training (124 slides), tuning (104 slides), and testing (105 slides) sets. The optimal tuning and test set sizes were determined based on a small pilot study that evaluated performance variability across slides (data not shown). The number of training slides were chosen based on the model performance in the tuning sets. In each training and tuning set slide, a single region of interest (ROI) per model was annotated. The ROIs were selected by evaluating the small intestinal fragments for the most complete wall layers, and if multiple fragments met this criterion, one was randomly chosen. Detailed methodology for set size calculation, ROI selection, and annotations are available in the Supplemental Materials. Examples of training annotations and test set analysis results are provided in Supplemental Figure S1. The test set whole-slide images (WSIs) were categorized by a board-certified veterinary anatomic pathologist (J.M.W.) based on stain quality (adequate vs faded), tissue quality (adequate vs crushed), and image focus (adequate vs out of focus). Submitting laboratory, biopsy types, and quality features of the test set are presented in Fig. 3. Detailed criteria for assessing the quality of the test set slides are provided in the Supplemental Materials. Information regarding the number and size of training and tuning set annotations for each model is available in Supplemental Table S3.
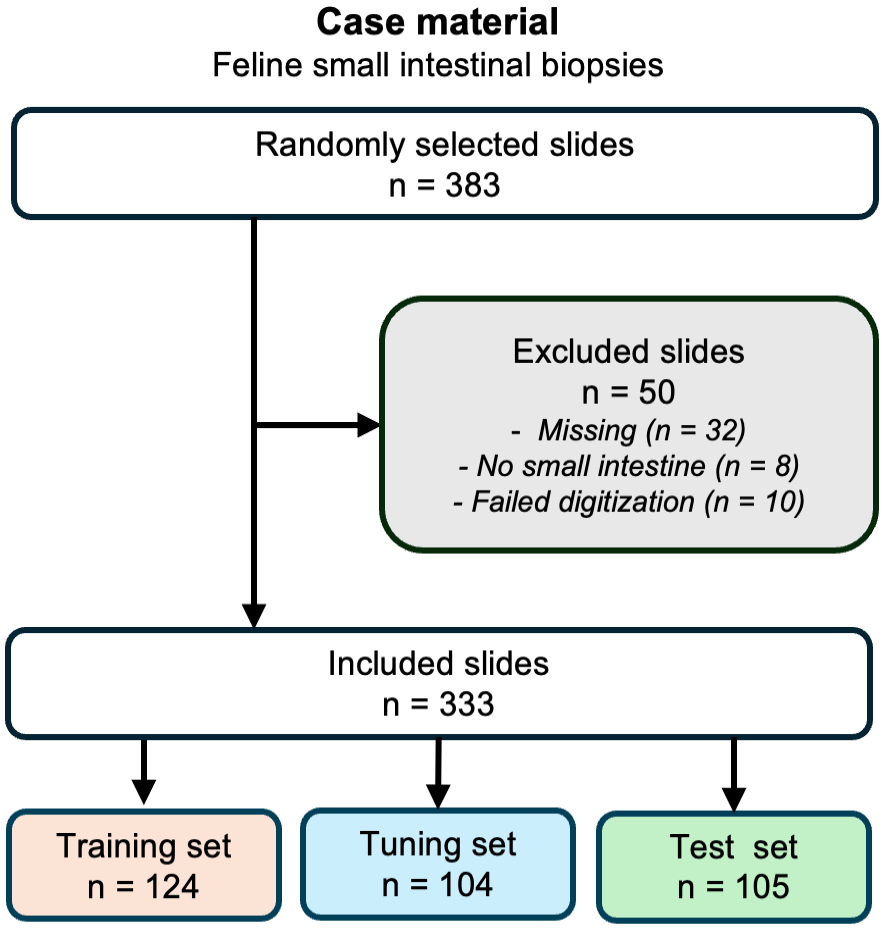
Case material. Randomly selected slides were, after excluding inadmissible slides, partitioned into training, tuning, and test sets.
Original diagnosis by histology, immunohistochemistry, and clonality.
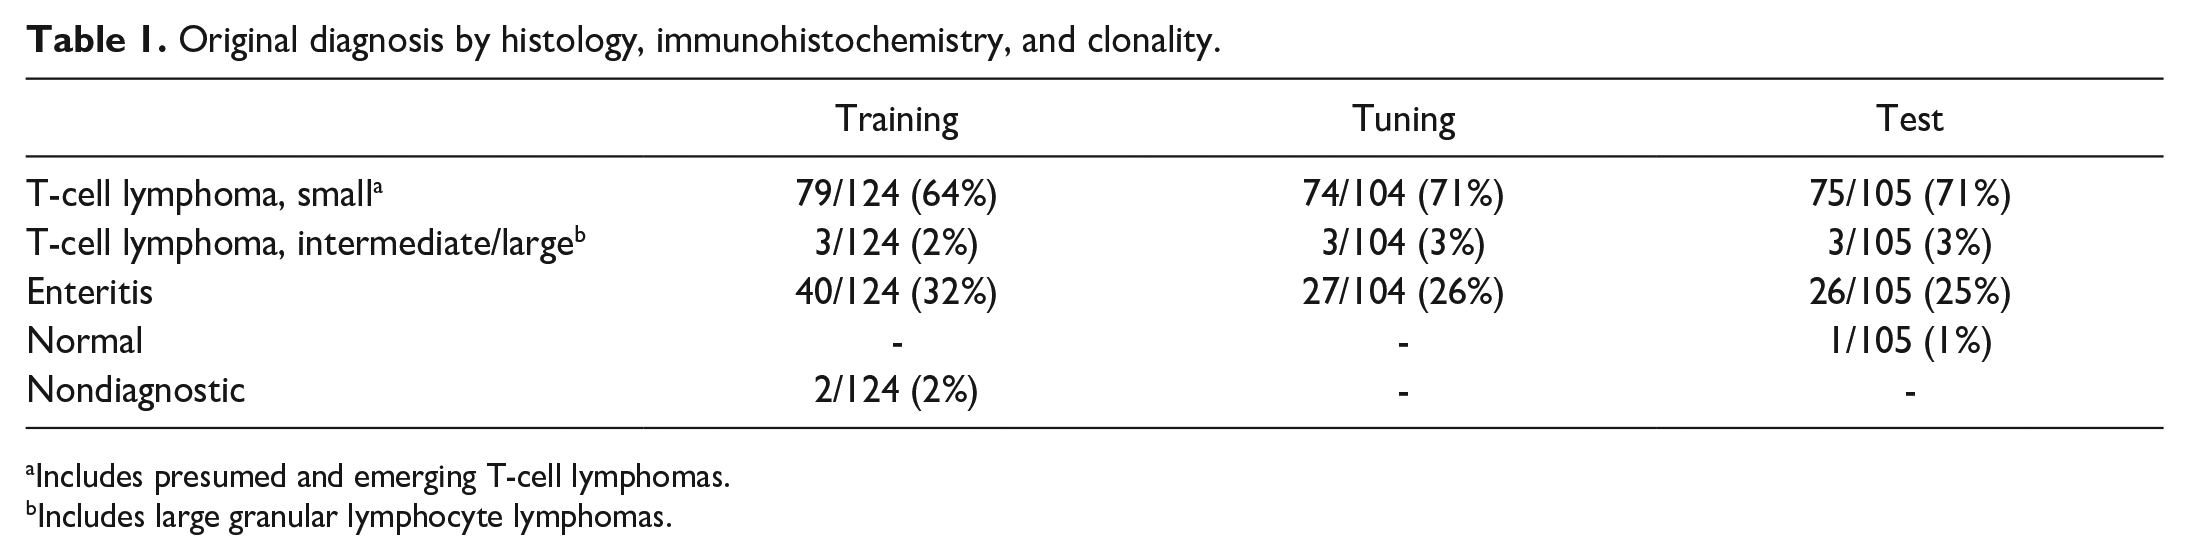
Includes presumed and emerging T-cell lymphomas.
Includes large granular lymphocyte lymphomas.
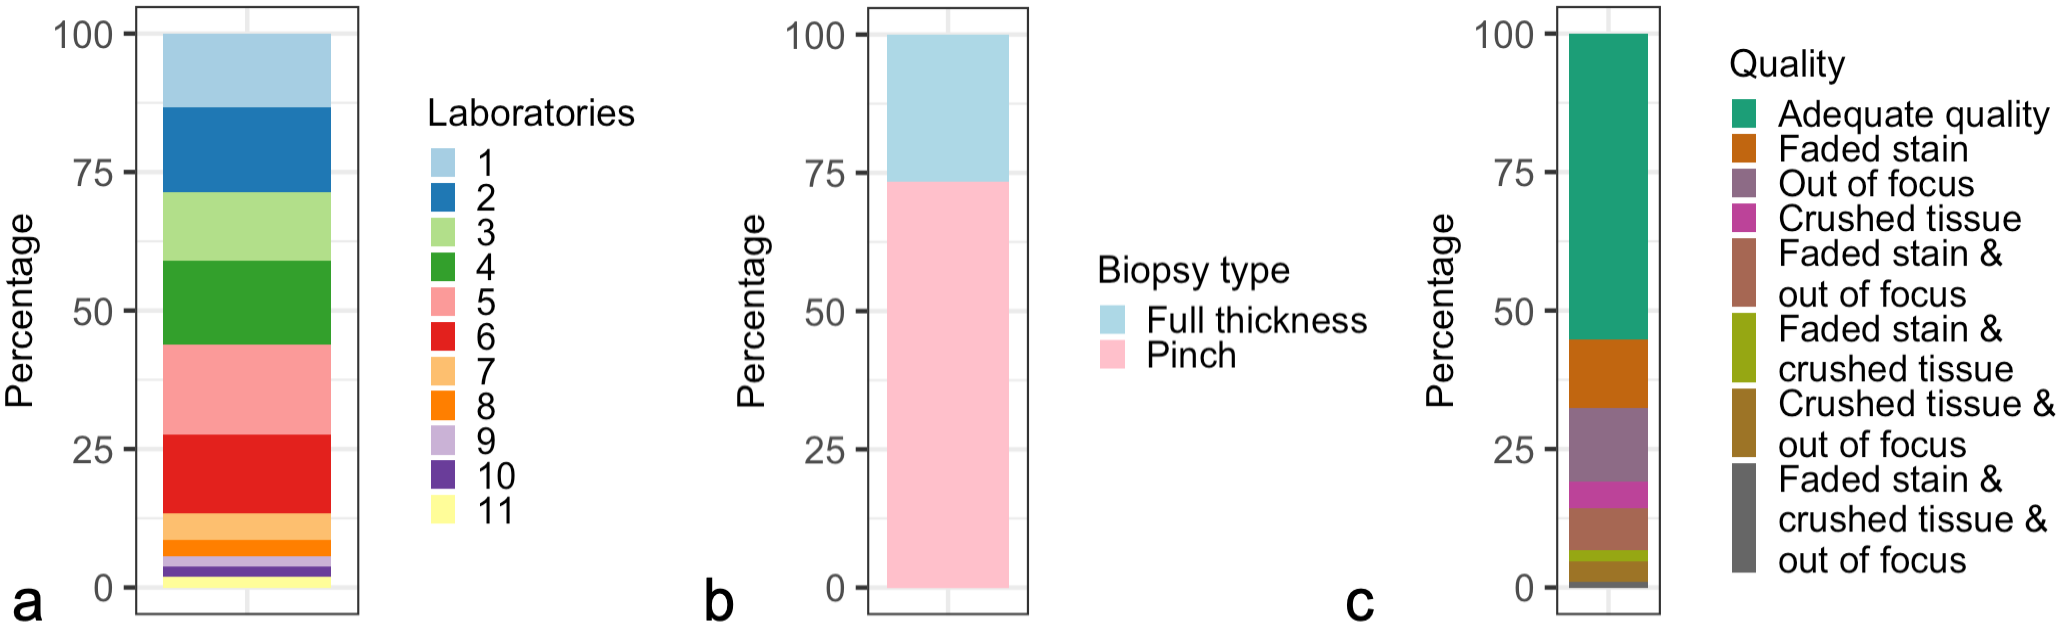
Composition of the test set (n = 105). (a) Submitting laboratory. Randomly selected slides were stratified by submitting laboratory resulting in a test set diverse in terms of origin. (b) Biopsy type. Slides were included in the study regardless of biopsy type. (c) Quality. Slides were included in the study regardless of quality, and rescanning of whole-slide images were purposefully not attempted.
Digitization
WSIs were generated at the Virtual Slide Scanning Facility, School of Veterinary Medicine, University of California Davis using an Olympus VS120 virtual slide microscope and a 40× objective (0.17 μm2/pixel). WSIs with suboptimal focus were purposefully not rescanned. Raw WSIs in the Olympus VSI format were deidentified and uploaded to Aiforia create (Helsinki, Finland).
Statistical Software
All postanalysis processing, statistical validation, and visualizations were conducted using R programming language within the RStudio integrated development environment.23,25 The custom R scripts were supported by a range of open-source packages for data science,26,27 data import and export,19,20,28 spatial analysis,5,9,21 statistics, 16 and visualization.3,11,18,22 All custom R scripts used in this study are available at GitHub (https://github.com/ucdavis/AIFeBx_supplemental). An online random number generator was used for ROI selection during model development (Supplemental Materials). 8
Postanalysis Processing
To classify the lymphocytes as either “intraepithelial” or “lamina propria,” output coordinates of both models were exported and merged. Each lymphocyte was mapped to a mucosal compartment based on the location of the lymphocyte centroid. The confidence score of lymphocytes mapped to a mucosal compartment was determined as follows. In addition to output coordinates for AI-predictions, both models provided a confidence score for every pixel/object that reflects the probability of the pixel/object belonging to a specific class. The confidence score for a lymphocyte mapped to a mucosal compartment was calculated by multiplying the confidence scores of the lymphocyte with that of the respective mucosal compartment. This resulted in a theoretical confidence score range between 0.25 and 1 for each AI-generated lymphocyte prediction.
Model Validation at the Lymphocyte Level
The model was validated by comparing AI-derived lymphocyte annotations with pathologist-generated lymphocyte annotations. Eleven board-certified veterinary anatomic pathologists were tasked with annotating lamina propria and intraepithelial lymphocytes in one 5000 µm2, randomly generated, validation region per WSI of the test set (Supplemental Materials). The pathologists, who had a median of 1 year of experience (range <1 year to 18 years since board-certification), were from different diagnostic laboratories, contract research organizations, or academic departments; had not participated in the development of the AI model; and were blinded to case details, each other’s annotations, and the AI results. Since the outline of lymphocytes was unknown, lymphocytes were inferred by aggregating the annotations from individual pathologists based on spatial proximity (Fig. 4, Supplemental Figure S2).
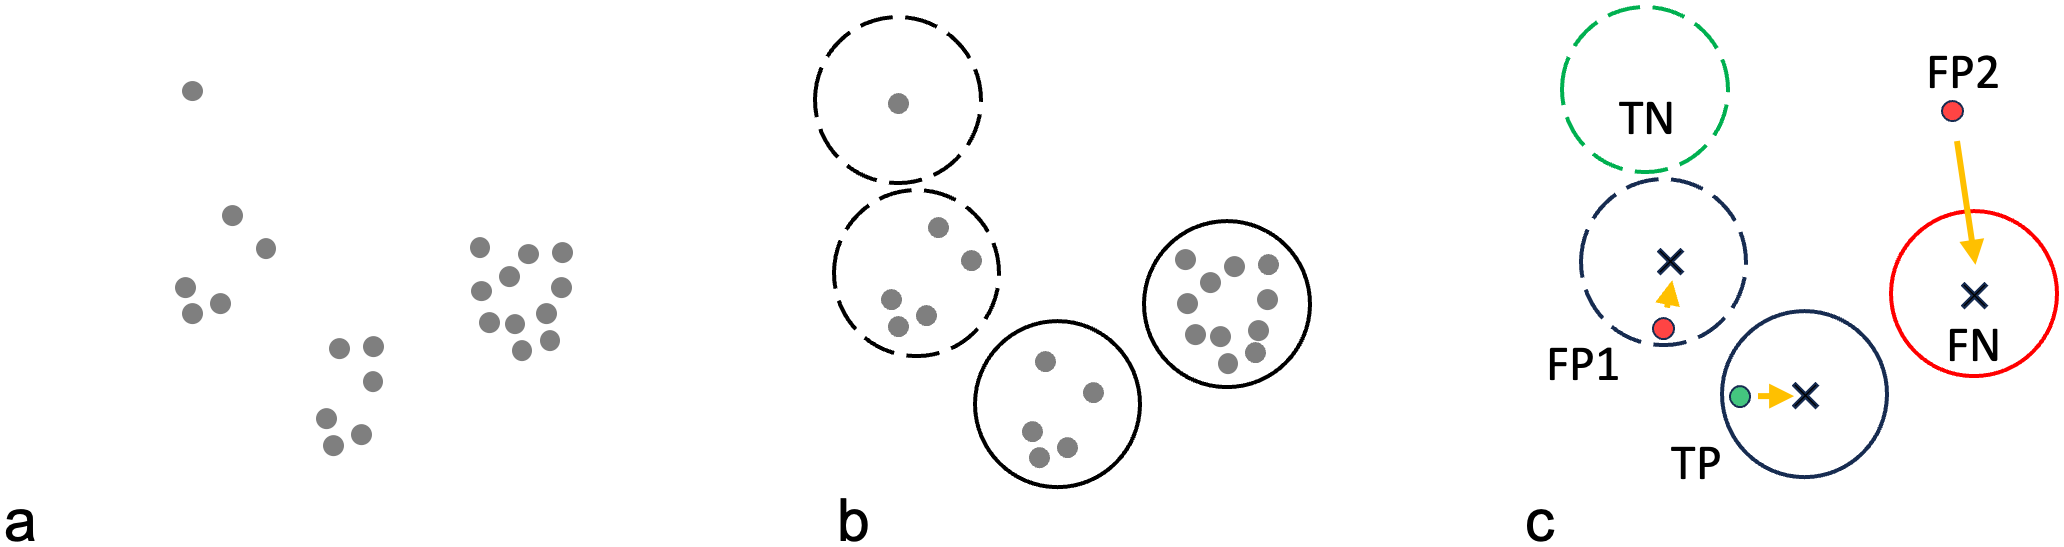
Workflow for reference lymphocyte identification. (a) Lymphocyte nuclei were annotated by 11 pathologists (grey dots). (b) Individual pathologist annotations were clustered into candidate lymphocytes (circles) based on a minimum distance threshold (see Supplemental Materials). Clusters with six or more annotations consistent with the majority opinion were considered “reference lymphocytes” (solid circles). Clusters with less than six annotations consistent with the minority opinion were considered “equivocal lymphocytes” (dashed circles). (c) For every artificial intelligence (AI)-generated lymphocyte prediction, the distance to the nearest candidate lymphocyte centroid (x) was calculated (orange arrows). If the closest candidate lymphocyte was a reference lymphocyte, and the distance was below a certain distance threshold, the AI-generated lymphocyte prediction was considered a true positive (TP, green dot); the AI-generated prediction was considered a false positive (FP) if the closest candidate lymphocyte was not a reference lymphocyte (FP1), or the distance was above the threshold (FP2). Reference lymphocytes without an AI-annotation below the distance threshold from the centroid were considered false negatives (FN, red solid circle). Equivocal lymphocytes (candidate lymphocytes with less than six contributing pathologists) without an AI-annotation below the distance threshold from the centroid were considered true negatives (TN, green dashed circle). Note that true negatives in the data set only encompassed objects that at least 1 pathologist annotated. Coordinates for objects that no pathologists annotated, were not available for documentation.
Any cell that at least 1 pathologist had annotated was considered a candidate lymphocyte. Candidate lymphocytes were considered “reference lymphocytes” if the majority of pathologists (n > 6) agreed. Candidate lymphocytes were considered “equivocal lymphocytes” if five or fewer pathologists agreed. A true positive was defined as an AI-generated lymphocyte prediction that was supported by a reference lymphocyte. A false positive was defined as an AI-generated lymphocyte prediction that was not supported by a reference lymphocyte. A false positive was considered “unequivocal” if it was not identified by any pathologist. A false negative was defined as a reference lymphocyte that was not detected by the model. A false negative was deemed “unequivocal” if all pathologists identified the reference lymphocyte. Equivocal lymphocytes that were not detected by the model were classified as true negatives (Fig. 4). Sensitivity (also known as recall), positive predictive value (PPV, also known as precision), and F1 scores (harmonic mean of sensitivity and PPV) were calculated individually for each validation region, averaged across the test set, and reported as median and interquartile range (IQR) values.
To understand causes of error, unequivocal false negative and false positive lymphocytes were classified by a board-certified veterinary anatomic pathologist (JMW) as caused by cell detection model errors, mucosal compartment model errors, or technical validation errors (mispredictions of cells located on the boundary of the validation region or cases where precise reference lymphocyte localization failed).
Interobserver Agreement Between Pathologists at the WSI Level
Eleven pathologists semiquantitatively graded intraepithelial lymphocytes as well as lamina propria lymphocytes and plasma cells according to the 2008 World Small Animal Veterinary Association guidelines. 4 The pathologists evaluated all sections available in the WSI and provided a grade for intraepithelial lymphocytes and a grade for lamina propria lymphocytes and plasma cells, ranging from normal, mildly increased, moderately increased, or markedly increased. Interobserver agreement was examined across WSIs for each pair of pathologists using weighted kappa with linear weights and 95% confidence intervals (CIs) and Cohen’s kappa (with 95% CI).
Concordance of AI Model Quantification and Pathologist Grades at the WSI Level
Concordance between the median pathologists’ grade and the AI-model generated count was assessed descriptively. AI-model generated counts for intraepithelial and lamina propria lymphocytes per 1000 µm2 were calculated individually for each tissue fragment and aggregated for each WSI using the median value.
Availability of Supporting Research Data
All supporting data, including WSIs and annotations, are available at BioImage Archive (https://www.ebi.ac.uk/biostudies/BioImages/studies), accession number S-BIAD1129, DOI: 10.6019/S-BIAD1129.
Results
Model Validation at the Lymphocyte Level
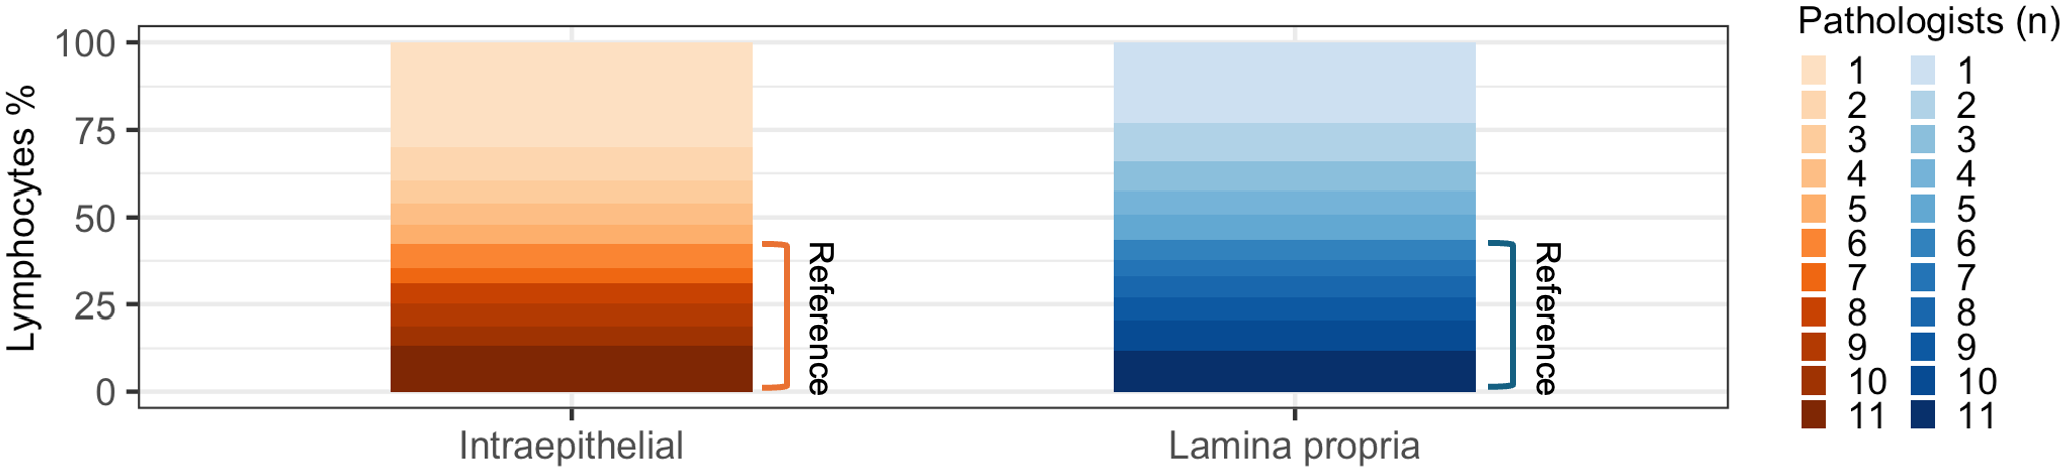
To characterize model performance, we compared AI-generated lymphocyte predictions against reference lymphocytes that were identified based on a majority vote of eleven pathologists (Fig. 4). Out of 3830 total candidate lymphocytes, less than half (1659, 43%) were identified by the majority of pathologists (n > 6) and used as reference lymphocytes (Fig. 5). The proportion of lymphocytes identified by the majority of pathologists was similar for the lamina propria (1194/2735, 44%) and the epithelium (465/1095, 43%). Of note, the median number of reference lymphocytes per validation region was similar or identical to the average number of annotations per pathologist (Table 2), supporting the majority vote as a suitable method for identifying reference lymphocytes.
Candidate lymphocytes categorized by number of contributing pathologists. Only candidate lymphocytes with six or more contributing pathologists were used as reference lymphocytes.
Lymphocytes per validation region.
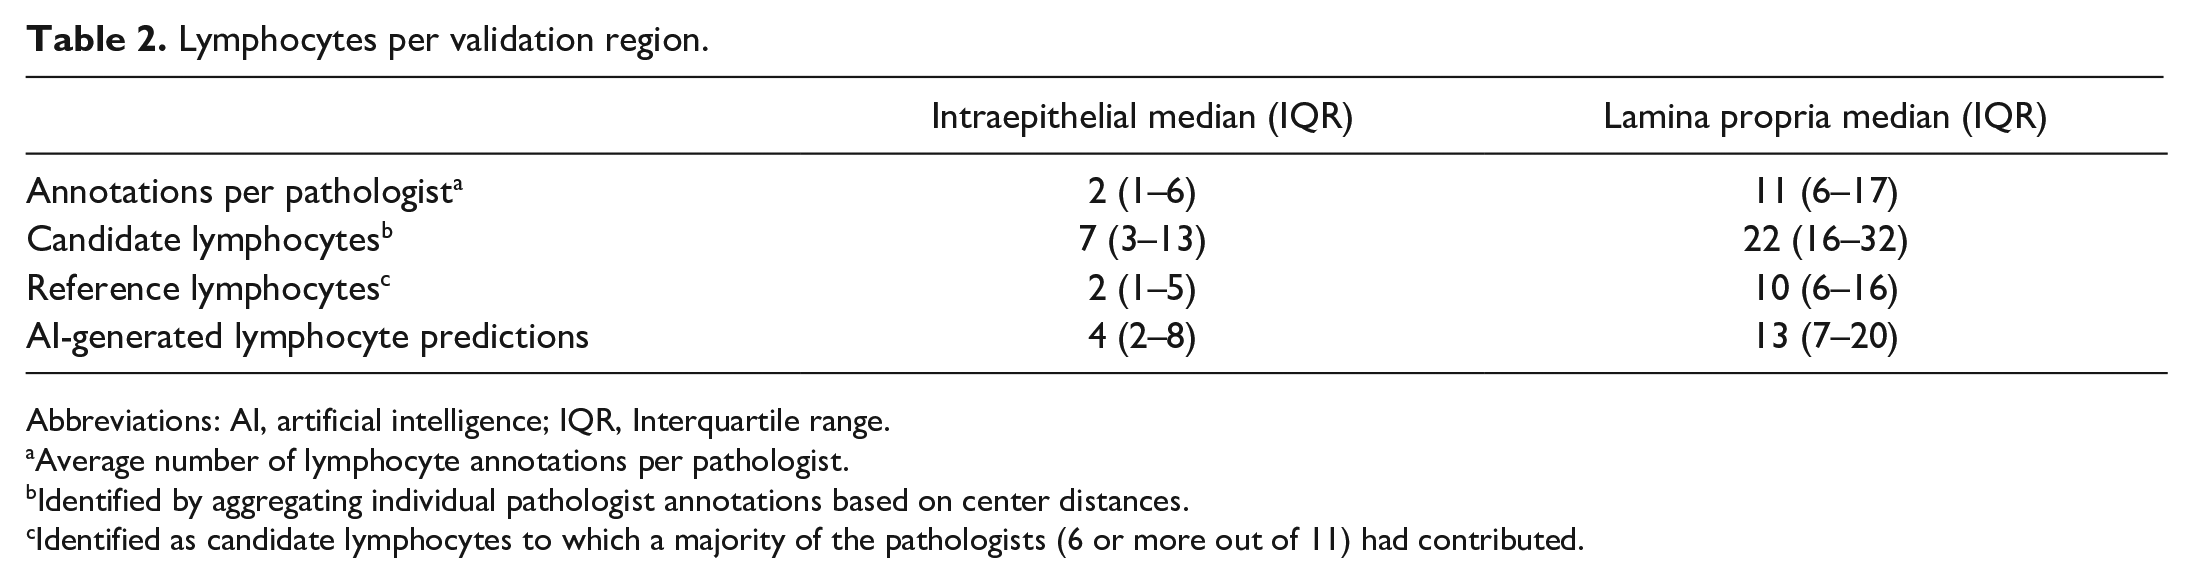
Abbreviations: AI, artificial intelligence; IQR, Interquartile range.
Average number of lymphocyte annotations per pathologist.
Identified by aggregating individual pathologist annotations based on center distances.
Identified as candidate lymphocytes to which a majority of the pathologists (6 or more out of 11) had contributed.
The AI model identified more lymphocytes than there were reference lymphocytes (Table 2). This was particularly true for intraepithelial lymphocytes, where the average number of lymphocytes per ROI identified by the model was twice the number of reference lymphocytes. When ranked based on the number of lymphocyte annotations per validation region, the AI model performed similarly to the most annotation-generous pathologists (Fig. 6). The frequency distributions of candidate lymphocytes, reference lymphocytes, AI-lymphocyte predictions, and pathologist annotations per validation region are depicted in Supplemental Figure S3.
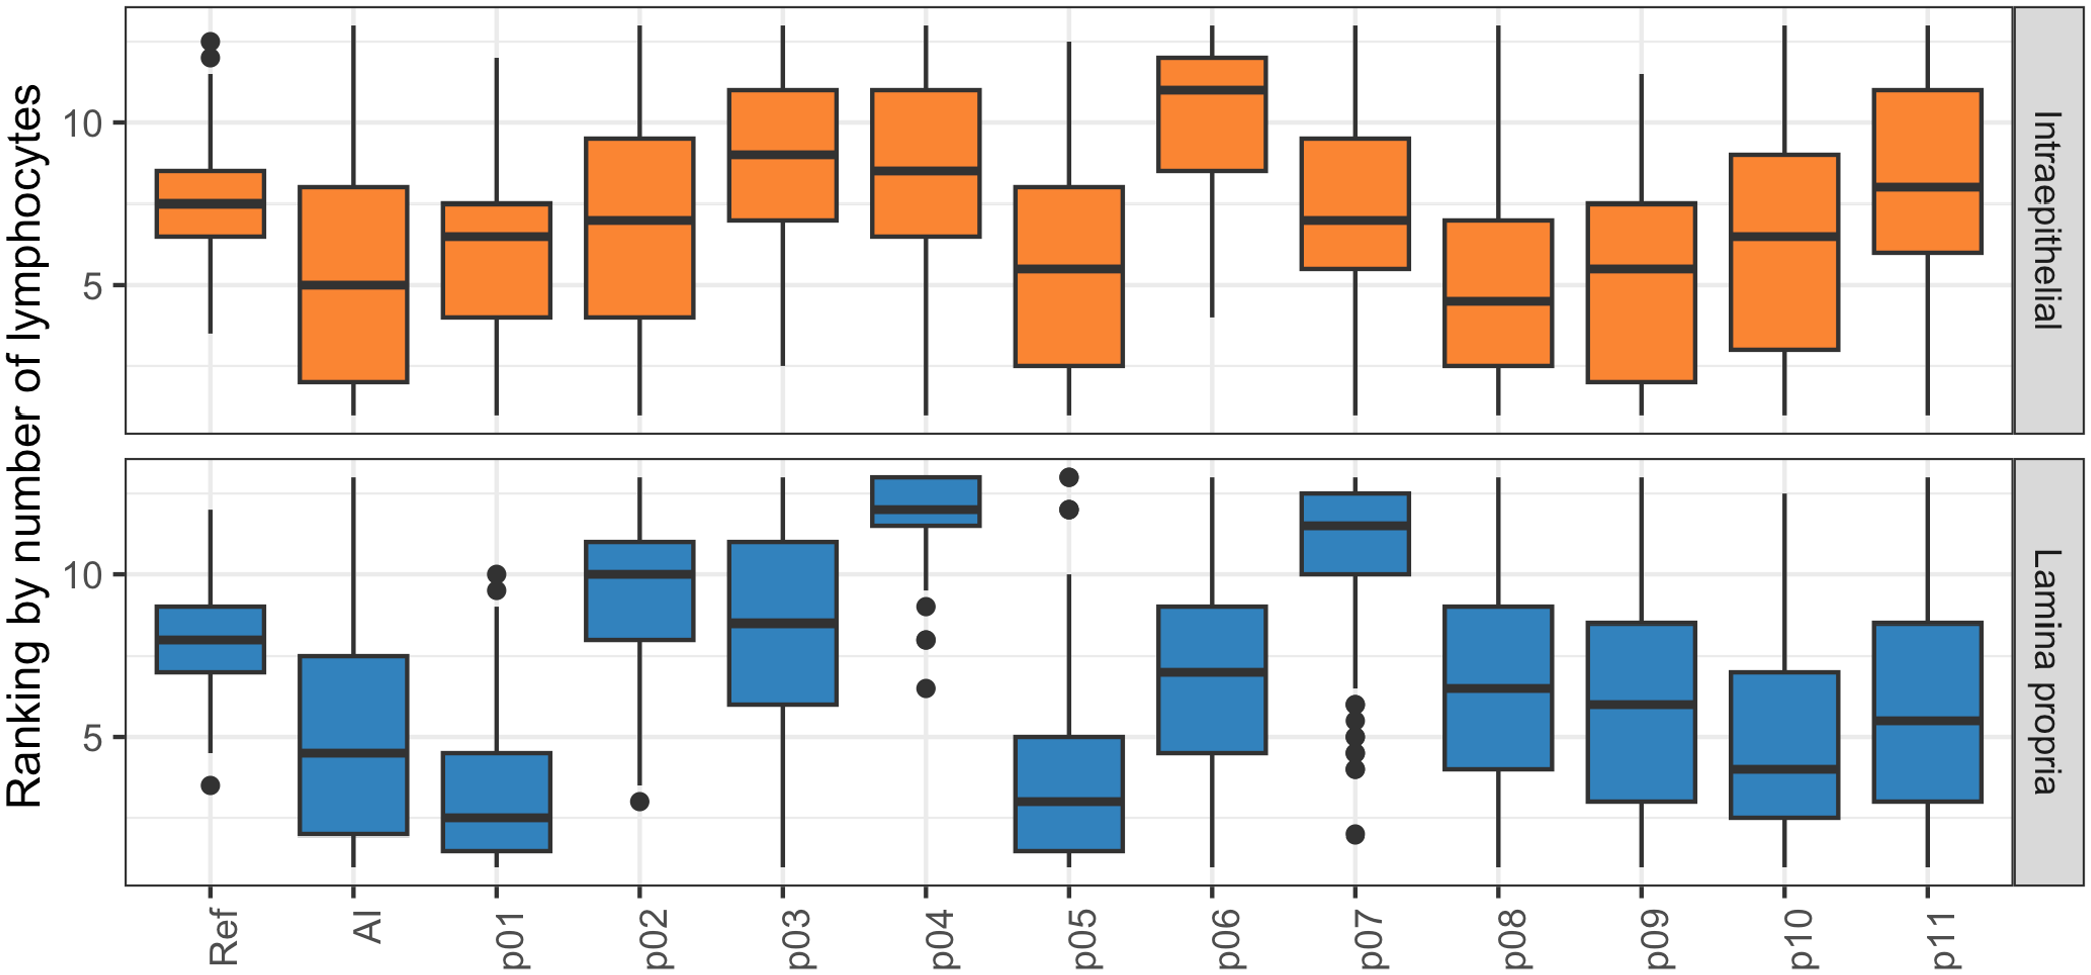
Pathologists were ranked by how generously they annotated lymphocytes. A higher value indicates fewer lymphocytes per validation region consistent with a cautious annotator, while a lower value indicates more lymphocytes per validation region consistent with a generous annotator. The box represents the interquartile range (IQR) and the line inside the box indicates the median. The whiskers extend to the smallest and largest value within 1.5 times the IQR from the first and third quartiles. The artificial intelligence model ranked among the most annotation-generous pathologists for most validation regions. AI, artificial intelligence model; p01–p11, pathologists 1–11; Ref, reference lymphocytes.
The AI model identified a higher proportion of reference lymphocytes in the epithelium (median sensitivity 100%, IQR 67%–100%) than the lamina propria (median sensitivity 89%, IQR 71%–100%) but also identified a higher proportion of equivocal lymphocytes or nonlymphoid cells in the epithelium (median PPV 57%, IQR 38%–83%) than the lamina propria (median PPV 67%, IQR 50%–82%) (Fig. 7a–c). The higher sensitivity for intraepithelial lymphocytes was counterbalanced by the higher PPV for lamina propria lymphocytes, resulting in a similar F1-score for intraepithelial lymphocytes (median 67%, IQR 43%–80%) and lamina propria lymphocytes (median 70%, IQR 43%–80%).
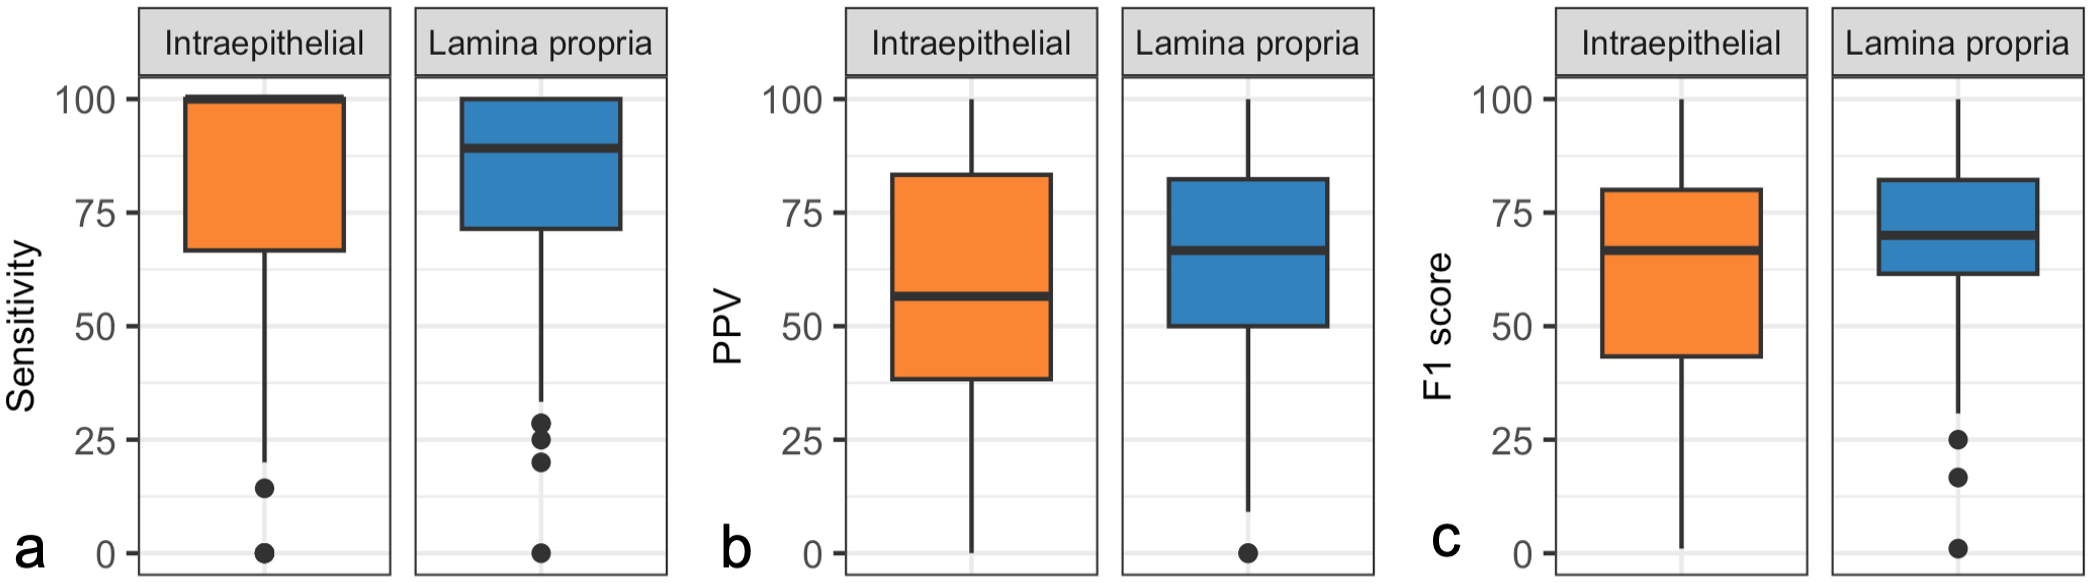
Performance metrics for the artificial intelligence (AI) model, calculated per validation region in the test set. AI-generated lymphocyte predictions were compared with reference lymphocytes composed of the majority opinion (six or more) of eleven pathologists. The box represents the interquartile range (IQR) and the line inside the box indicates the medians. The whiskers extend to the smallest and largest values within 1.5 times the IQR from the first and third quartiles. (a) Sensitivity. The median sensitivity of the AI model, compared with the reference lymphocytes, was higher for intraepithelial lymphocytes than for lamina propria lymphocytes in the validation regions of the test set. (b) Positive predictive value (PPV). The median PPV of the AI model, compared with the reference lymphocytes, was lower for intraepithelial lymphocytes than lamina propria lymphocytes in the validation regions of the test set. (c) F1 score (the harmonic mean of sensitivity and PPV). The median F1 score of the AI model, compared with the reference lymphocytes for the intraepithelial lymphocytes and lamina propria lymphocytes were similar in the validation regions of the test set, reflecting a higher sensitivity for the intraepithelial lymphocytes than the lamina propria lymphocytes, counterbalanced by a higher PPV for the lamina propria lymphocytes than the intraepithelial lymphocytes.
To explore the relationship between sensitivity and PPV at different confidence thresholds, we calculated both parameters across the range of encountered AI model confidence values (Fig. 8). The increase in PPV observed with higher confidence thresholds was modest compared with the decrease in sensitivity, indicating that raising the confidence threshold to improve PPV comes at a high cost in sensitivity. Sensitivity and PPV of the AI model for intraepithelial and lamina propria lymphocytes, calculated per validation regions grouped by slide stain quality, tissue quality, image focus, and submitting laboratory, are detailed in Supplemental Figure S4.
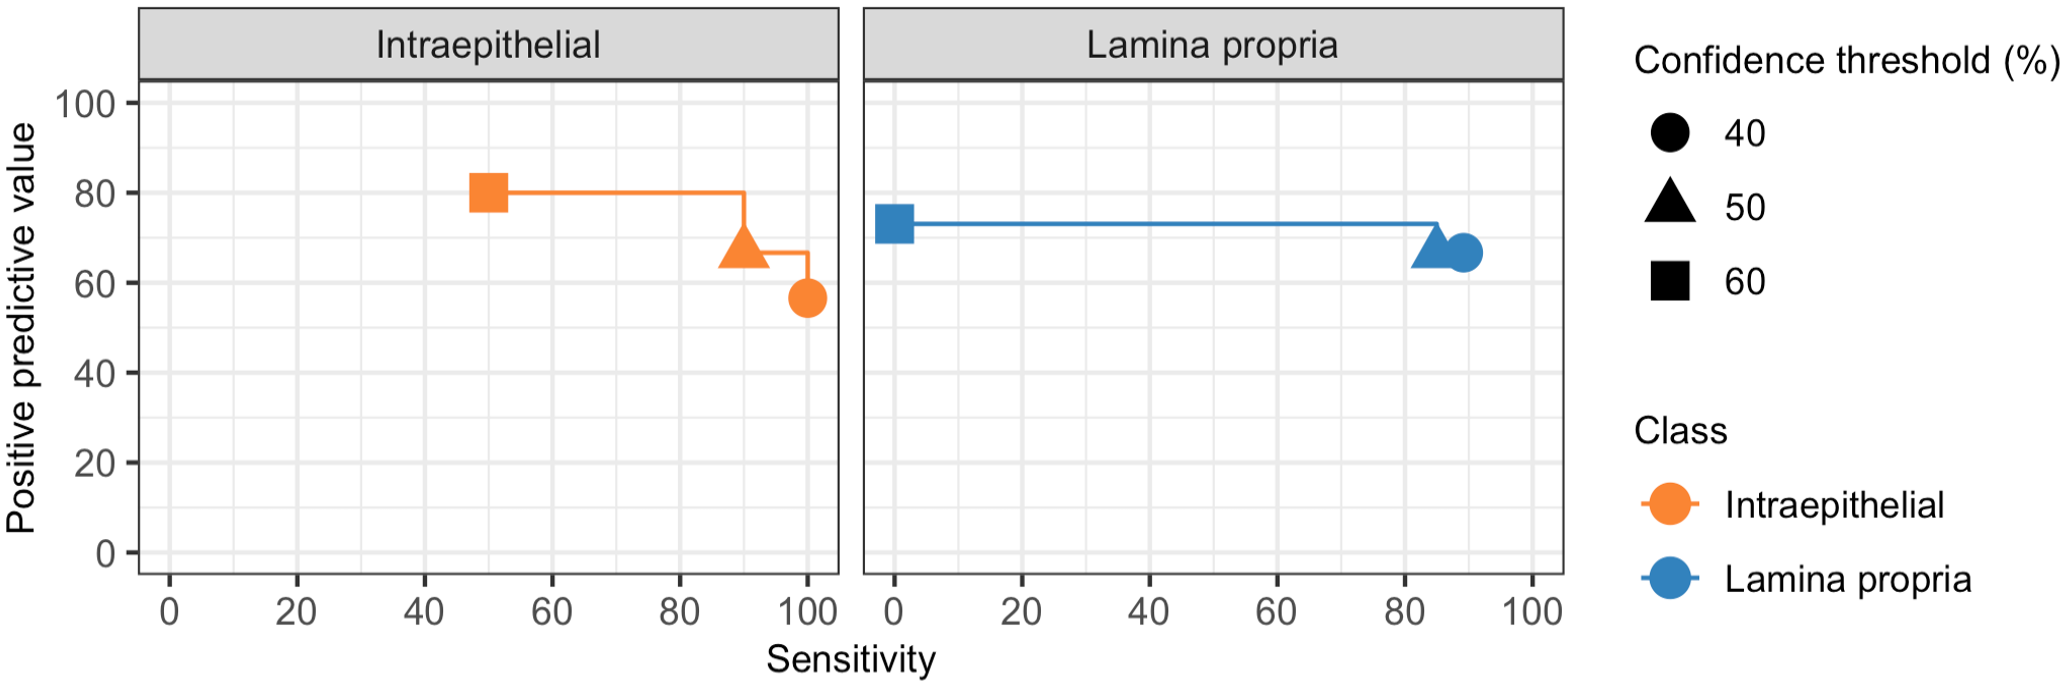
Positive predictive value (PPV) by sensitivity at different confidence thresholds. Median PPV and sensitivity for the artificial intelligence (AI) model compared with the reference lymphocytes was calculated using the range of encountered AI model confidence values. The increase in median PPV observed with higher AI model confidence thresholds was modest compared with the decrease in median sensitivity.
False positives were more frequent than false negatives for both intraepithelial and lamina propria lymphocytes (Fig. 9). False positives represented AI model predictions that were supported by no pathologist or a minority of pathologists (n < 6). Conversely, false negatives represented lymphocytes that were identified by most pathologists (n > 6) but not the model. Out of 1118 false predictions, 223 (20%) were “unequivocally” false meaning that either a model prediction was not supported by any pathologist (unequivocally false positive) or a reference lymphocyte that was identified by all pathologists was not predicted by the model (unequivocally false negative).
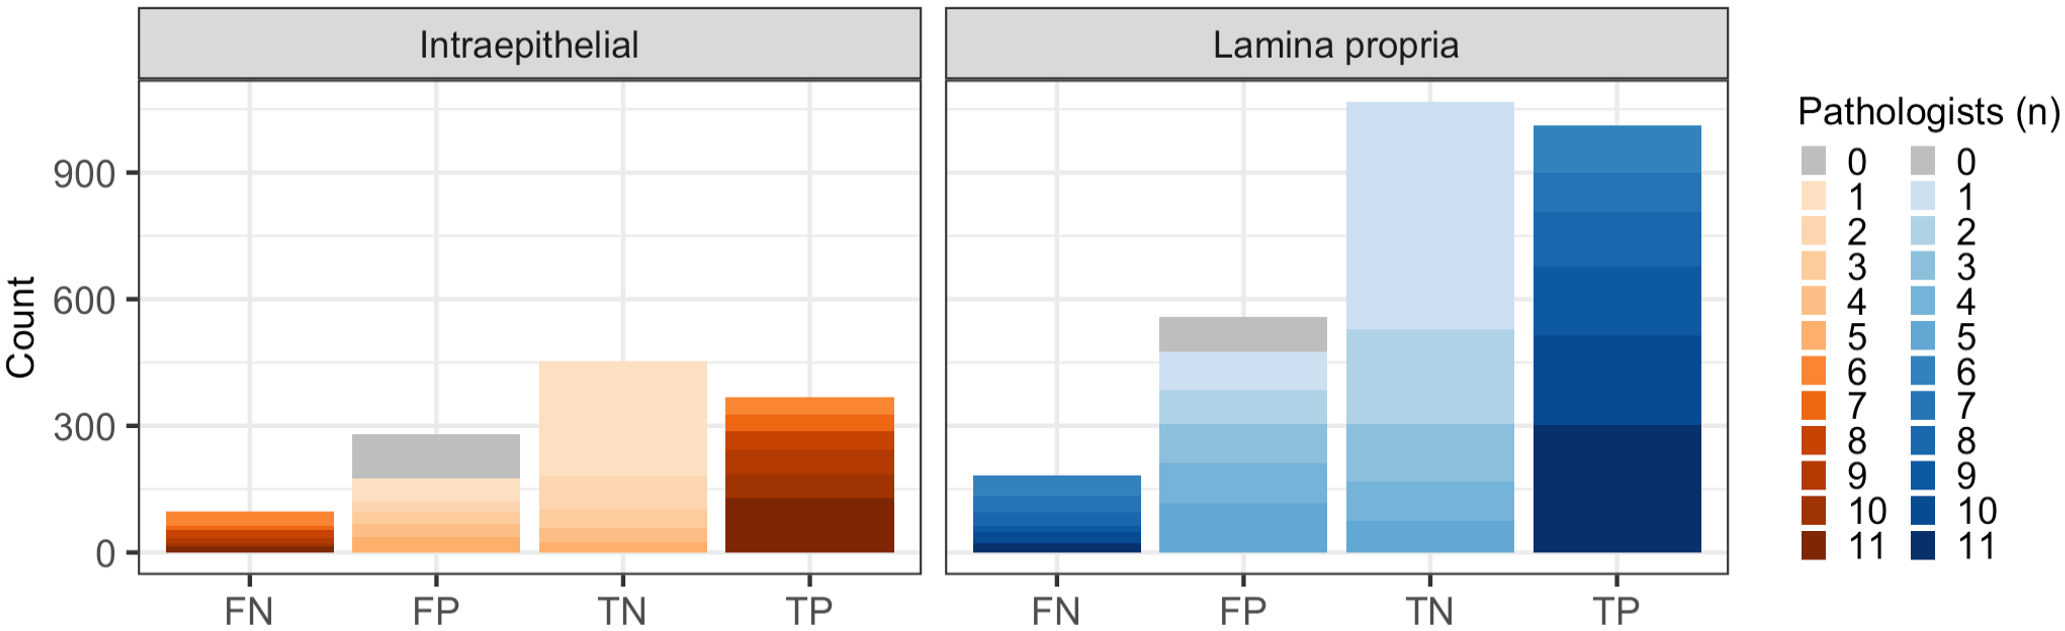
Number of false negative (FN), false positive (FP), true negative (TN), and true positive (TP) artificial intelligence (AI)-generated lymphocyte predictions when compared with reference lymphocytes. A small portion of false negative predictions consisted of reference lymphocytes to which all pathologists (11/11) contributed (dark blue/orange). These are considered unequivocally false negatives. Similarly, false positive predictions consisting of AI-generated lymphocyte predictions that did not align with any candidate lymphocyte, have zero contributing pathologists, and are considered unequivocally false positives (gray).
Unequivocal errors caused by the cell detection model were more common than errors caused by the mucosal compartment model (135/223, 61% vs 30/223, 14%) (Supplemental Figure S5). In addition, some unequivocal errors were caused by neither model but were inherent to the validation strategy (57/223, 26%; explained in more detail below). Most of the unequivocal cell detection model errors were false positives (116/135, 86%), but the cell type that was identified as a lymphocyte by the model could not be confidently determined in almost half of the cases (56/116, 48%, Supplemental Figure S6). False labeling of enterocyte nuclei (51/116, 44%) was a more common source of unequivocal errors than false labeling of goblet cell nuclei (4/116, 3%) or plasma cells (2/116, 2%) (Fig. 10a, Supplemental Figure S6). Only 19/135 (14%) unequivocal cell detection model errors constituted false negatives (Fig. 10b). Unequivocal false positives stemming from mucosal compartment model errors represented instances where the epithelial/lamina propria border was identified imprecisely by the model. This resulted in intraepithelial lymphocyte being classified as lamina propria lymphocyte or vice versa (Fig. 10c). For both cell detection model errors and mucosal compartment model errors, most unequivocal errors occurred in WSIs of suboptimal quality (Supplemental Figure S7). Suboptimal focus was the most common quality issue for unequivocal mucosal compartment model errors, while faded staining was the most common quality issue for unequivocal cell detection model errors. Validation errors comprised instances where lymphocytes were positioned on the border of the validation region resulting in disagreement about whether a lymphocyte was part of the validation region (Supplemental Figure S8a). These errors also included instances where abutting or overlapping lymphocytes precluded the unambiguous aggregation of pathologist annotations into reference lymphocytes (Supplemental Figure S8b). In addition, technical validation errors encompassed situations where the distance between a model prediction and the nearest pathologist annotation was marginally higher than the maximum threshold required for colocalization (Supplemental Figure S8c). Notably, these technical validation errors are inherent to the specific validation strategy we used, are not reflective of the true AI model performance, and are not relevant for scenarios outside of validation.
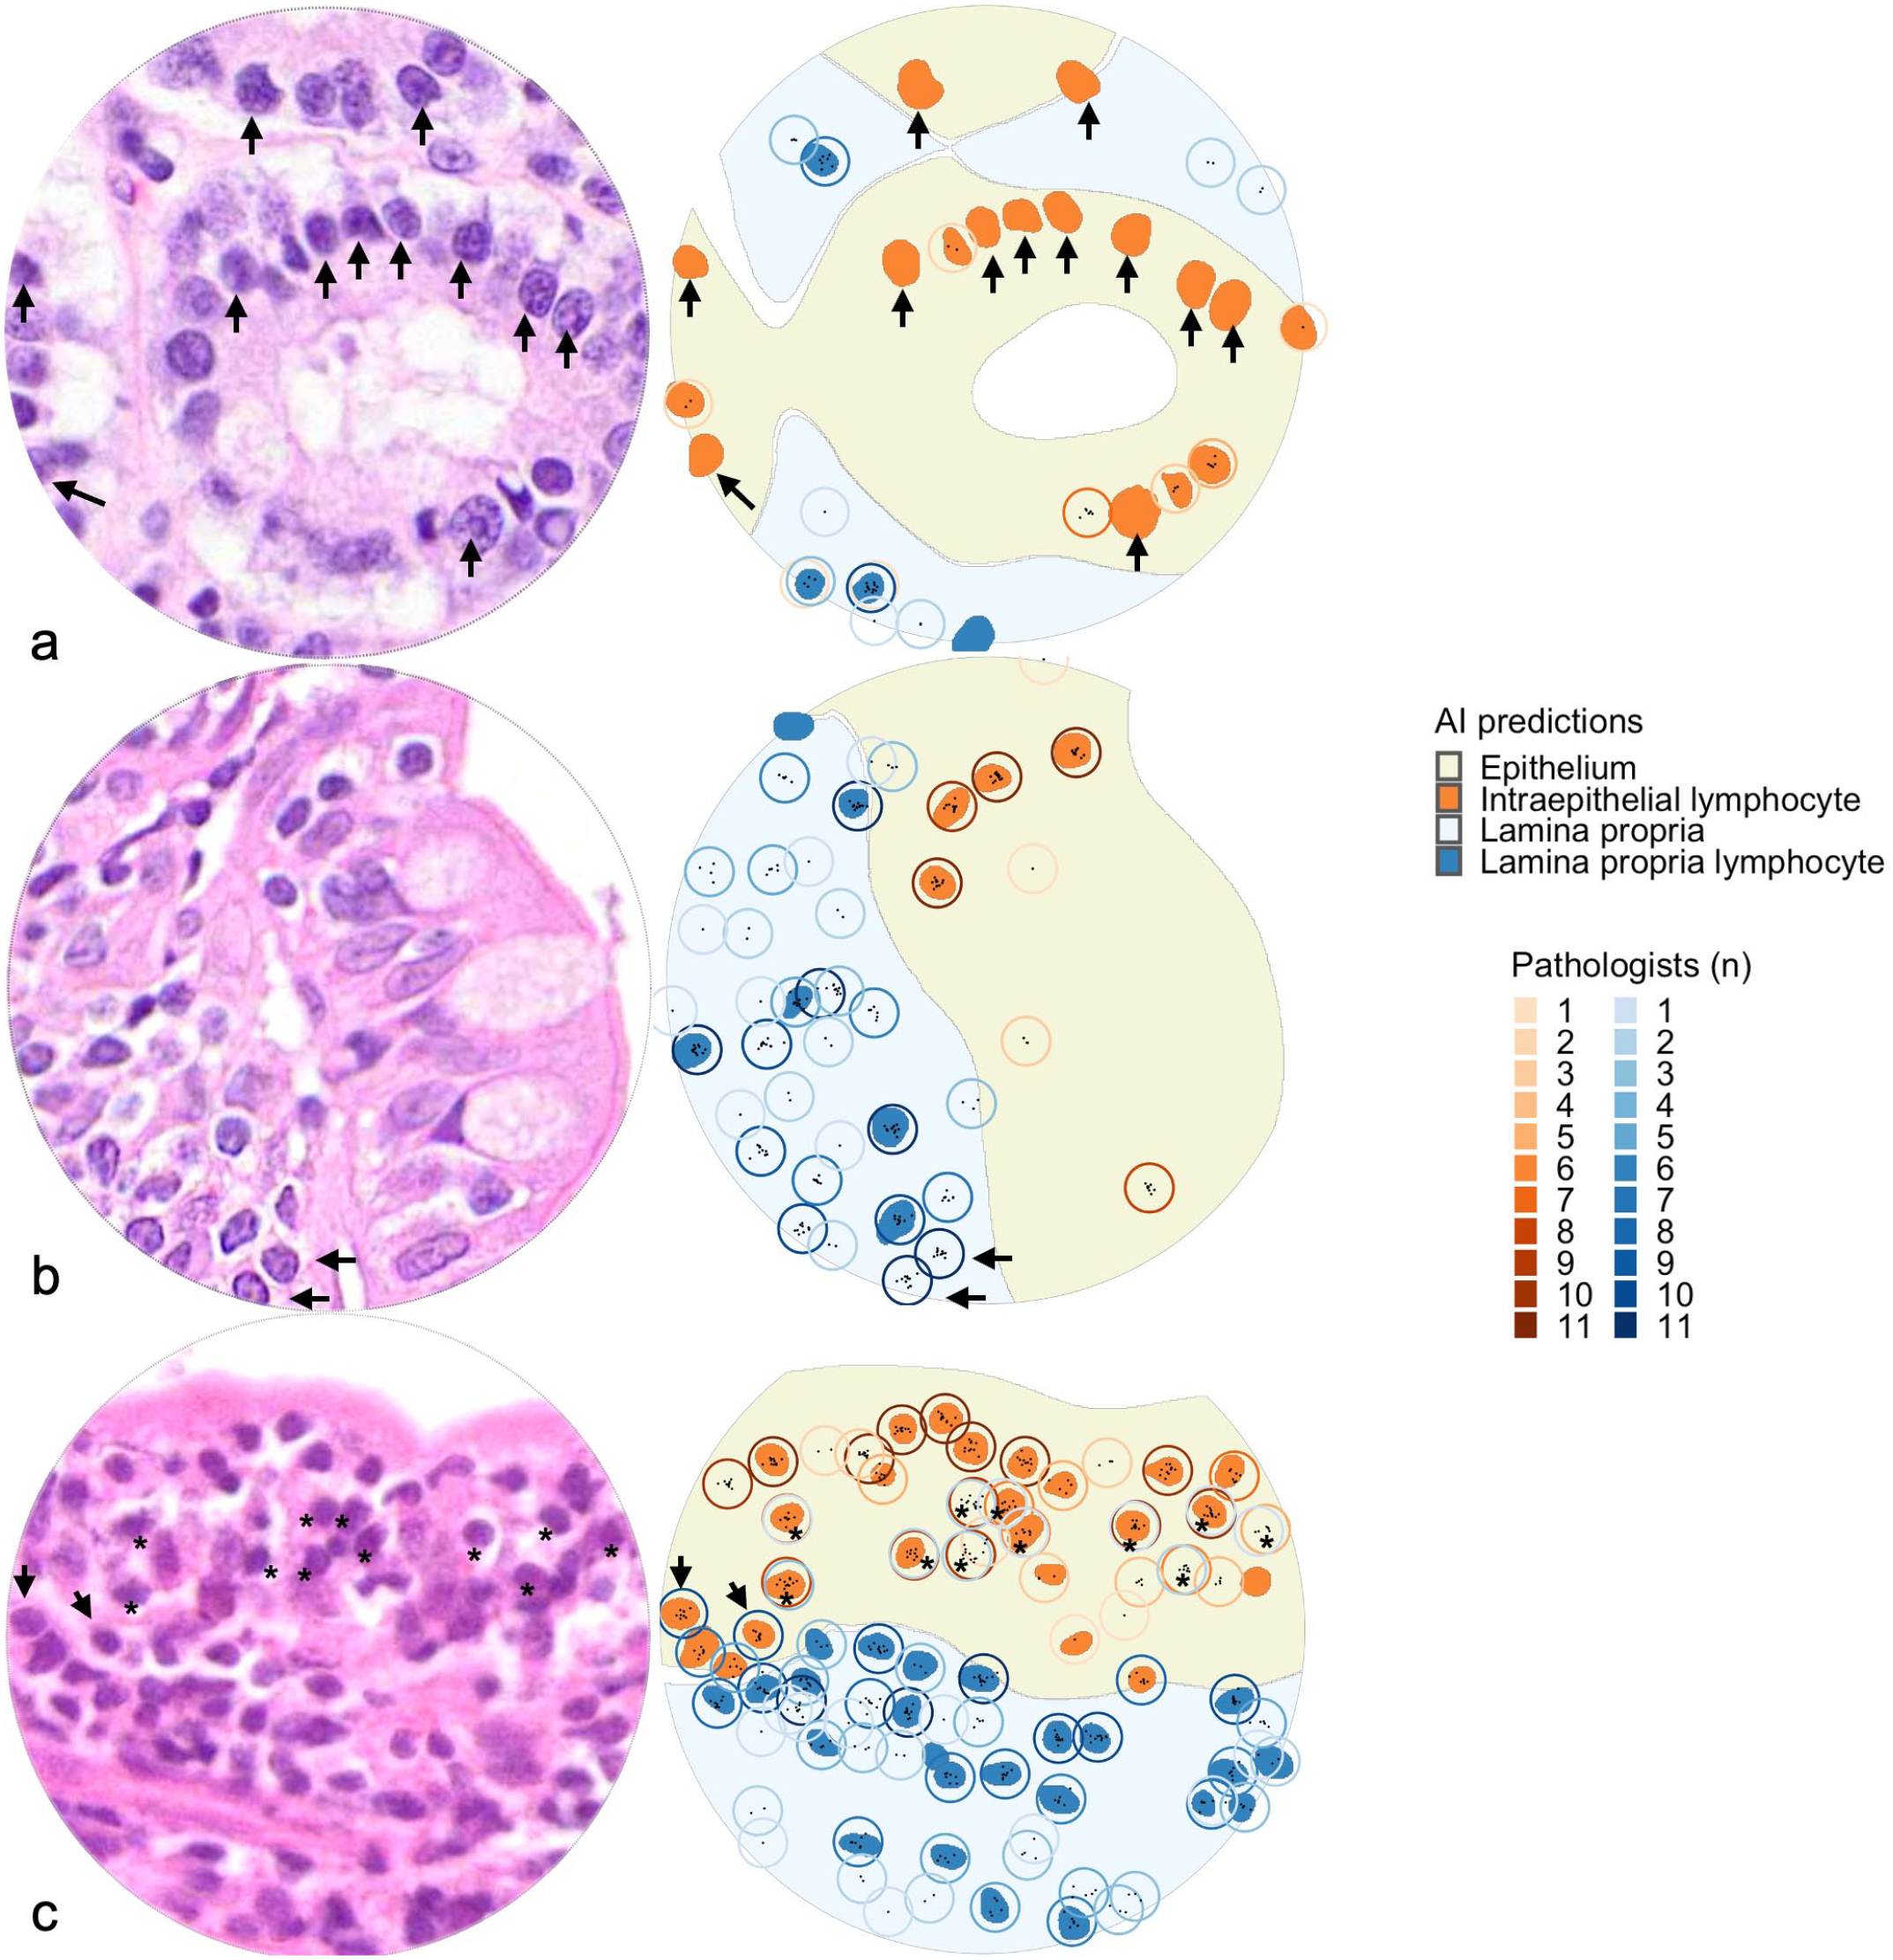
Examples of unequivocal errors in validation regions of test set. Small intestine, cat. Hematoxylin and eosin-stained validation regions (left). Artificial intelligence (AI)-predictions and candidate lymphocytes (right). Solid fills represent AI-predictions (yellow, epithelium; light blue, lamina propria; orange; intraepithelial lymphocytes; dark blue, lamina propria lymphocytes). Circles represent candidate lymphocytes, with color intensities representing number of contributing pathologists (orange circles, candidate intraepithelial lymphocytes; blue circles, candidate lamina propria lymphocytes). Black points represent center coordinates for individual pathologist annotations. (a) Examples of unequivocal false positives. The validation region contains 12 unequivocally false positives (AI-predictions not annotated by any pathologists) targeting epithelial nuclei (arrows). These are categorized as cell detection model errors. (b) Examples of unequivocal false negatives. The validation region contains two unequivocal false negatives (candidate lymphocytes annotated by all pathologists, arrows). These are categorized as cell detection model errors. The stain quality in this whole-slide image was categorized as faded. (c) Examples of unequivocal errors categorized as mucosal compartment model errors. The validation regions contain two candidate lymphocytes that all pathologists annotated as lamina propria lymphocytes, but the AI model predicted as intraepithelial lymphocytes (arrows). Note that the validation region also contains 11 candidate lymphocytes where pathologists disagreed on classification as intraepithelial lymphocytes and lamina propria lymphocytes (asterisks). This slide was categorized as having suboptimal focus quality.
Interobserver Agreement Between Pathologists at the WSI Level
Interobserver agreement at the WSI level revealed frequent and marked disagreement in semiquantitative grades, with only four instances of complete agreement amongst all 11 pathologists (Fig. 11, Supplemental Figure S9). Two instances involved a “normal” grade (both for intraepithelial lymphocytes), and the other two pertained to a “marked” grade (1 each for intraepithelial lymphocytes and lamina propria lymphocytes and plasma cells). These WSIs were characterized by a relatively homogenous lymphocyte distribution across and within tissue fragments. Conversely, 12 WSIs received all 4 grades for at least 1 compartment. Most of these WSIs (10/12, 83%) were characterized by heterogeneous lymphocyte distributions within or across tissue fragments. Of the remaining 2 WSIs, 1 was a large cell lymphoma, and 1 was a small pinch biopsy with villi in cross-section, presumably limiting diagnostic interpretation. The interobserver agreement varied among individual pairs of pathologists, often surpassing what would be expected by random chance. When comparing agreement between pathologist pairs across all WSIs to random chance, the weighted kappa values ranged from no agreement (0.11, 95% CI [0.04, 0.17]) to moderate agreement (0.64, 95% CI [0.53, 0.75]) (Supplemental Figure S10).
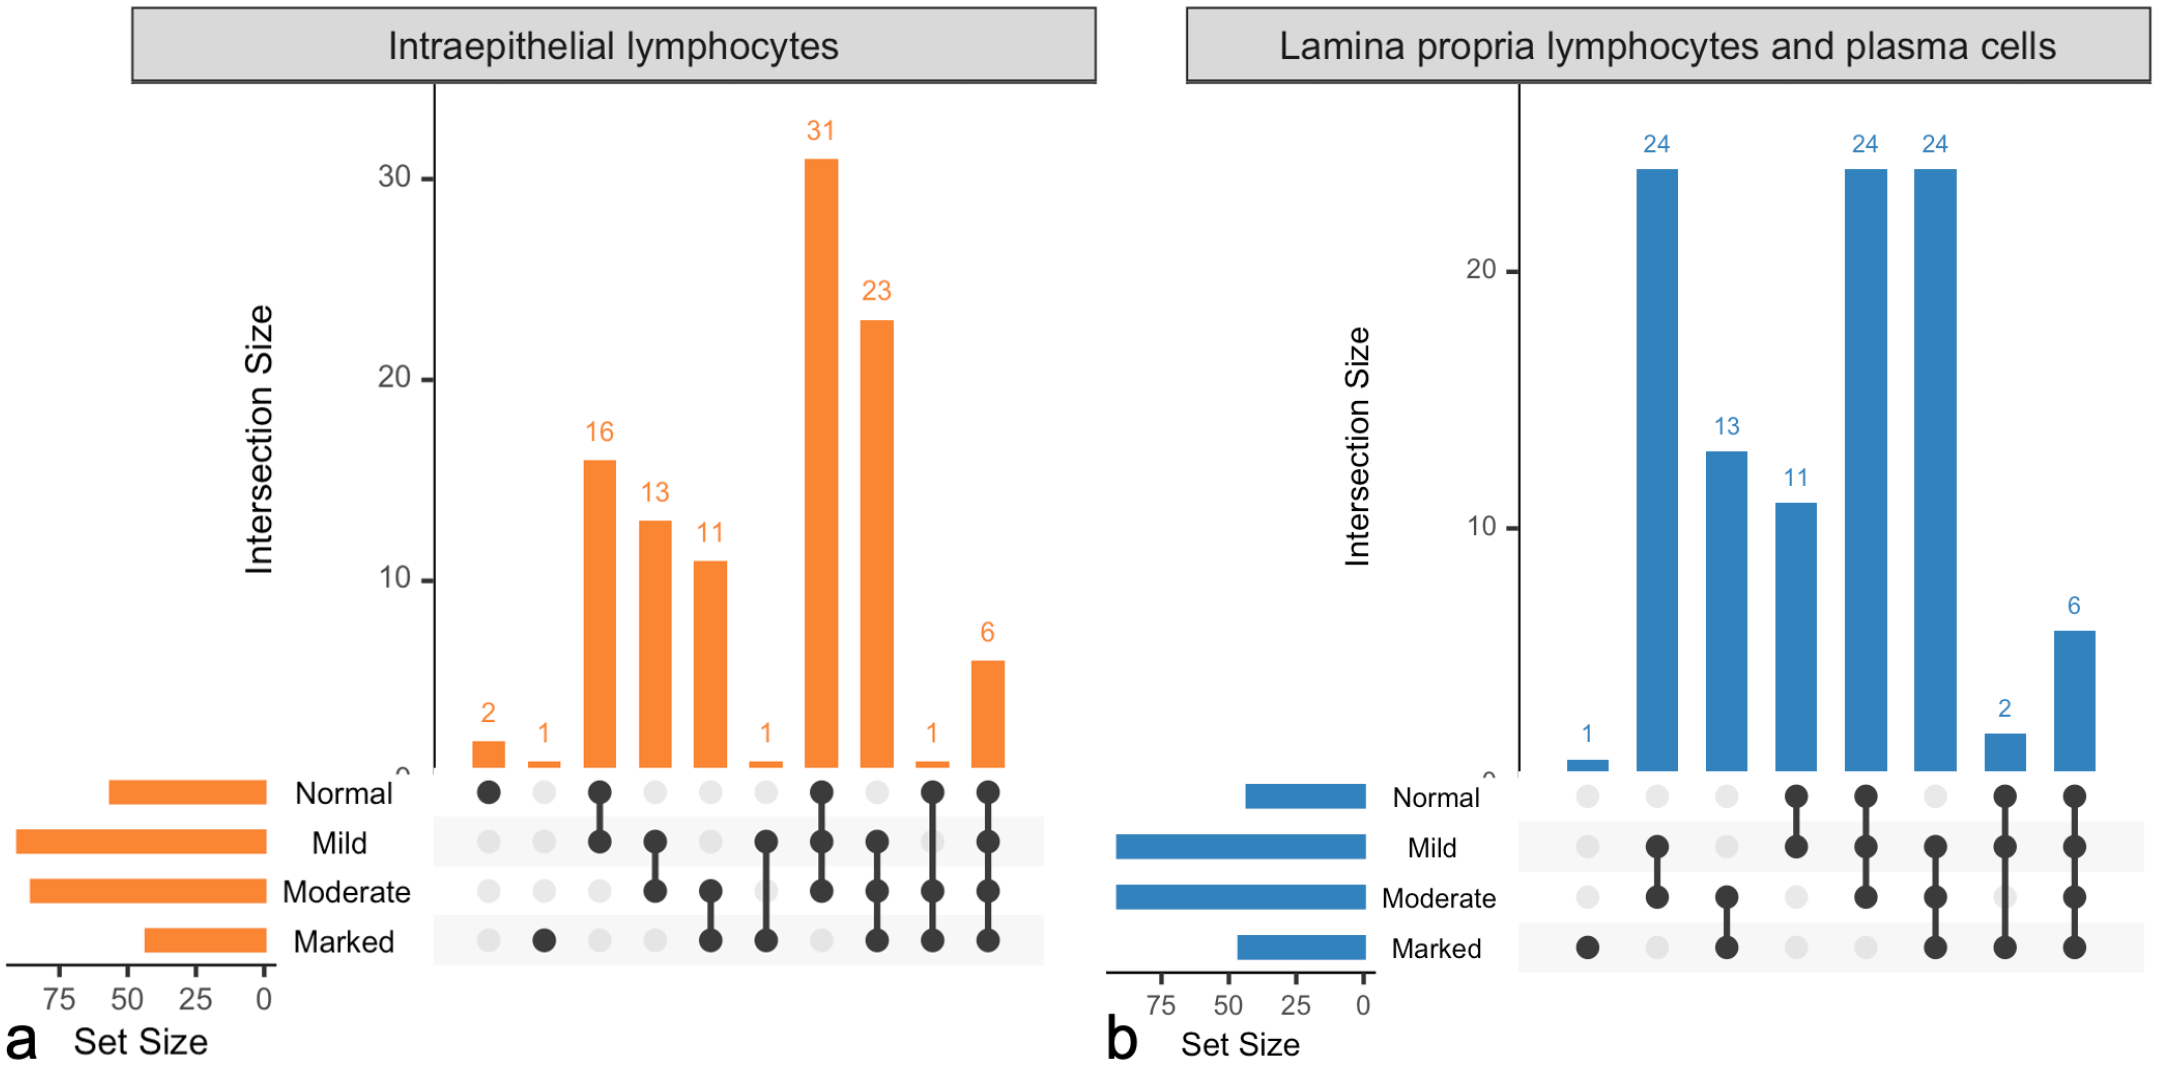
Interobserver agreement between pathologists at the whole-slide image (WSI) level. 105 test slides were graded by 11 pathologists for intraepithelial lymphocyte infiltration (normal, mild, moderate, or marked) and lamina propria lymphocyte and plasma cell infiltration (normal, mild, moderate, or marked). The “set size” scale depicts how many WSIs received at least 1 grade of the categories depicted. The “intersection size” scale depicts how many WSIs in total received combinations of the grades indicated by the interconnected dots. (a) Intraepithelial lymphocytes. All pathologists agreed on the grade for three WSIs. Six WSIs received all four grades. (b) Lamina propria lymphocytes and plasma cells. All pathologists agreed on the grade for 1 slide. Six WSIs received all four grades.
Concordance of AI Model Quantification and Pathologist Grade at the WSI Level
The AI model-derived lymphocyte counts increased with higher median semiquantitative grade but there was a substantial overlap of lymphocyte counts between WSIs with different grades (Fig. 12).
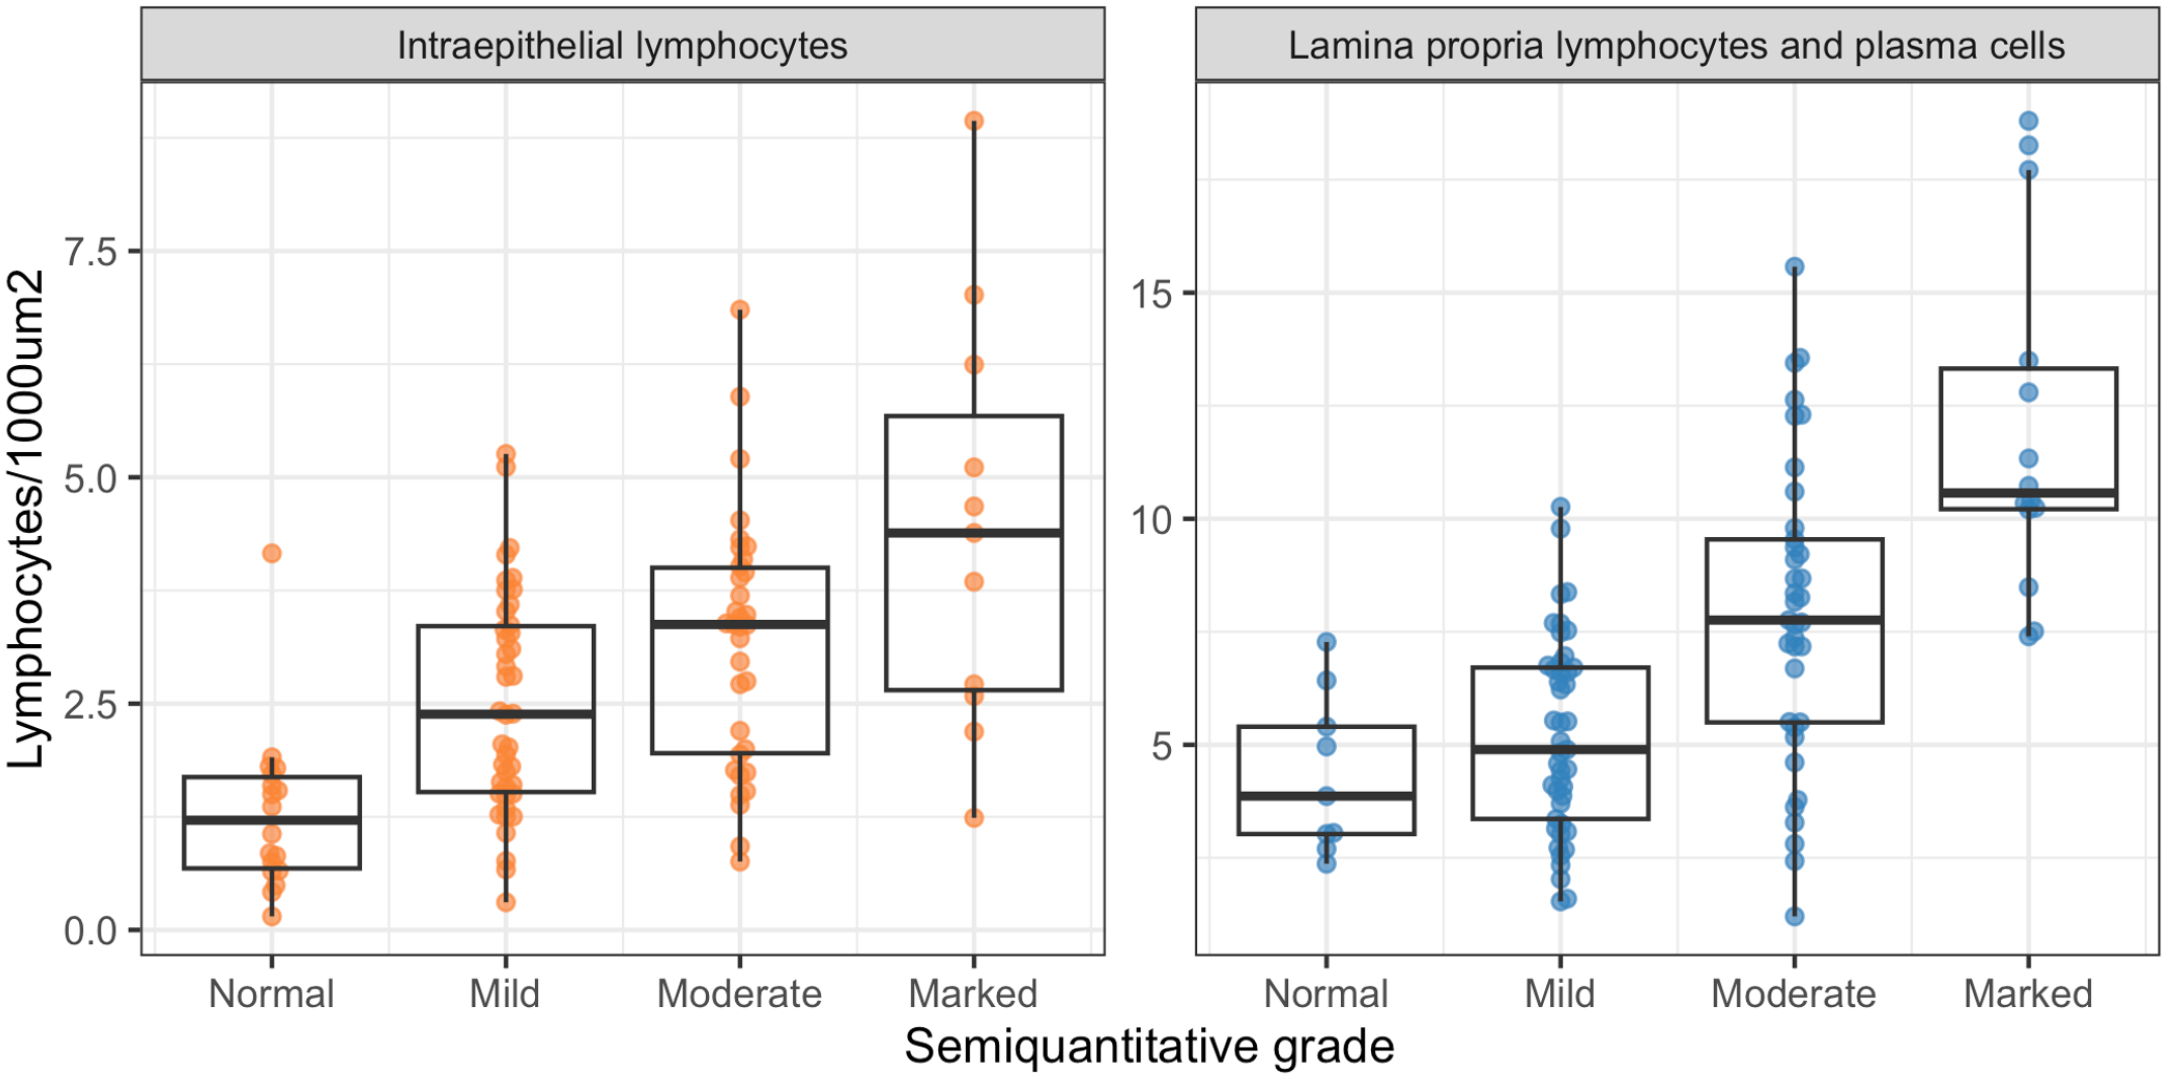
Concordance of artificial intelligence (AI) model quantification and pathologist grade at the whole-slide image (WSI) level. AI-derived lymphocyte counts, calculated per tissue fragment and averaged across the WSI correlated positively with, but displayed a substantial overlap between, the median pathologists’ grades.
Discussion
This study aimed to improve the accuracy and reproducibility of quantifying lymphocytes in intestinal biopsies of cats with FCE using AI. Histopathologic assessment of lymphocyte infiltrates in small intestinal biopsies is used to classify cases as chronic enteritis or low-grade intestinal lymphoma, and to grade the severity of the disease. 14 Given that the definition of and histomorphologic criteria for chronic enteritis and low-grade intestinal lymphoma in cats are controversial, we deliberately did not attempt to diagnose these conditions as a model endpoint. Instead, we focused on improving the quantification of lymphocytes, an important part of the histopathological assessment that suffers from low interobserver agreement and poor reproducibility. 29 This is the first study that utilizes AI to quantify lymphocytes in intestinal biopsies from cats with FCE.
We believe that supporting the pathologist with AI-based detection tools and quantitative data is a more rewarding and transparent strategy than replacing the pathologist with a black-box model. Previous studies have utilized AI to diagnose FCE, either based on histologic assessment on a WSI level, 10 or complete blood counts and biochemistry values. 1 However, safe implementation of AI models into clinical practice requires verification of model output by human experts, who are ultimately responsible for diagnostic decisions. 24 The accuracy of our model output can be gauged by assessing the AI-predictions superimposed as an image mask onto an H&E-stained slide. If the performance of the model is deemed inadequate, the provided quantitative data can be ignored. A recent study applied a similar approach for the diagnostic grading of ulcerative colitis in humans. 17 The model-derived data correlated well with human semiquantitative grades and illustrates the potential benefit of AI-based cell quantification. 17
Validation of our model by comparing AI-generated lymphocyte predictions to pathologist annotations in small validation regions revealed a low interobserver agreement for lymphocyte annotations between pathologists. Only 12% of all candidate lymphocytes were identified by all 11 pathologists and only 43% were annotated by the majority of annotators, suggesting that distinguishing lymphocytes from other cell types is not straightforward. The inconsistent identification of lymphocytes has been recognized as a source of interobserver variability for grading of tumor-infiltrating lymphocytes in human breast cancer but not for grading of feline intestinal biopsies. 12 Given the high variability of annotations across pathologists in this study, determining the level of agreement required for identifying reference lymphocytes presented an important question. The higher the required level of annotator agreement, the fewer the identified reference lymphocytes, the higher the model sensitivity but the lower the PPV. Requiring complete annotator agreement for reference lymphocyte determination yielded a high sensitivity but low PPV and likely underestimated the true number of lymphocytes. Instead, we used a majority decision for reference lymphocyte determination, which balanced sensitivity and PPV and represents a well-established method for resolving rater discrepancies. 6 An alternative approach could have been to use immunohistochemistry-labeled lymphocytes as the reference standard, but this was deemed infeasible for a study of this size. In addition, this strategy might have resulted in greater discrepancies between the number of reference lymphocytes on one hand and the number of AI-predicted or human-annotated lymphocytes on the other hand as, in the authors’ opinion, humans tend to underestimate the number of CD3-positive cells based on H&E slides.
Most false positives observed in our study stemmed from the model detecting equivocal lymphocytes, that is, lymphocytes that were identified by fewer than six pathologists. A less conservative validation approach might have classified these as true positives. Of greater concern were unequivocal false positives, that is, AI-predicted lymphocytes that were not annotated by any pathologist. Enterocyte nuclei, plasma cells and goblet cell nuclei were identified as sources of confusion within this category. A comprehensive evaluation of the AI model’s ability to differentiate between different cell types would require the annotation of various cell types, a task beyond the study’s scope.
Instances of unequivocal false negatives were infrequent in our study and primarily occurred in WSIs with faded stain or suboptimal focus. Our model development strategy leveraged a data set comprised of slides from several diagnostic laboratories, deliberately incorporating variations in image quality and refraining from rescanning WSIs with suboptimal focus. In contrast to the common practice of developing AI models on extensively filtered and cleaned data sets, 24 our approach aimed to maintain diversity. This decision potentially resulted in a lower test performance but will likely mitigate the expected performance drop when transitioning the model into clinical use. With that said, faded stain, while common in archived case material, is not expected in routine diagnostic practice, and out of focus WSIs would have triggered rescanning in a diagnostic laboratory. Limiting the use of the AI model to biopsies of adequate stain quality and image focus is expected to reduce the frequency of false-negative predictions and improve sensitivity without the need for further model improvement.
For this study, we calculated performance metrics separately for each validation region and averaged the results across the test set. In contrast to pooling of results from all validation regions and calculating a single value for each performance metric, our strategy allows for the assessment of performance variability between different WSIs. Choosing smaller validation regions and more slides rather than bigger regions and fewer slides was motivated by providing a sufficiently small area for manual annotation while maximizing the diversity of the tissue assessed. However, this strategy likely contributed to the variability in performance observed between different WSIs.
When comparing semiquantitative grades between pathologists for WSIs, we observed a low interobserver agreement. The current World Small Animal Veterinary Association guidelines for histopathologic grading of intestinal biopsies do not account for variation between different tissue fragments or within a single tissue fragment. 4 Therefore, pathologists may either choose to base their grade on the most severely affected region of a slide or provide an average grade across all tissue fragments. Our findings are in line with a previous study that utilized the same grading scheme and found comparable interobserver agreement. 29 In our study, WSIs with low interobserver agreement often exhibited heterogeneous lymphocyte distributions while WSIs with high interobserver agreement, exhibited relatively uniform lymphocyte distribution. These findings parallel a study on factors influencing interobserver agreement for tumor-infiltrating lymphocytes in human breast cancer, which highlights the heterogeneity in lymphocyte distribution as an important contributing factor. 12 Although our model provides lymphocyte counts per tissue fragment, this resolution is likely insufficient to detect small foci of increased lymphocyte densities. Consequently, future iterations of this model should aim to provide lymphocyte densities in a more granular fashion.
Comparison of semiquantitative grades to AI-derived lymphocyte counts on a whole-slide level revealed substantial overlap of lymphocyte counts between different semiquantitative grades. The current World Small Animal Veterinary Association guidelines are widely used as a gold-standard for assessing the severity of lymphocyte infiltrates in feline small intestinal biopsies, but their application for this study came with several major limitations. First, existing grading schemes are semiquantitative, while our AI model provides quantitative output with no established rules for translation. Second, these grading schemes were established for duodenal biopsies only, whereas our AI model was trained on various small intestinal segments. Third, the lamina propria grading scheme combines lymphocytes and plasma cells whereas our model is intended for quantifying lymphocytes only. In addition to these limitations inherent to the grading scheme, shortfalls of our model likely contributed to the overlap of lymphocyte counts between different semiquantitative grades. First, the AI-generated lymphocyte counts were inaccurate for some WSIs. Second, AI-generated lymphocyte counts represented an average across a tissue fragment while pathologists may have considered regional differences in density of lymphocyte distribution. However, the fact that pathologists provided divergent grades for the same slide in the great majority of cases suggests that the limitations of semiquantitative grading, and a human’s ability to accurately and reproducibly estimate cell numbers might be a bigger source of error than the shortfalls of our model.
The most recent American College of Veterinary Internal Medicine guidelines for diagnosing and distinguishing low-grade intestinal lymphoma from lymphoplasmacytic enteritis in FCE, expands on previous recommendations for grading small intestinal biopsies in cats. 15 The guidelines emphasize the importance of evaluating apical to basal gradients, heterogeneity of lymphocyte distribution, and formation of intraepithelial clusters, features that cannot be assessed by our current model. 15 Future work should focus on improving the consistency of the AI model performance across different WSIs and the spatial resolution of the model. While AI-based identification of spatial histological patterns might not resolve the conundrum of differentiating lymphoma from enteritis, it may enable the discovery of associations between histological features and molecular alterations, clinical signs, response to treatment, or outcome.
This model is only intended for use in specific scenarios and requires output verification by the user. This model was trained and validated using archived cases that were submitted for clonality testing, which affected the composition of our data set. To maximize generalizability, we included cases regardless of the original diagnosis. Specimens primarily consisted of small intestine with infiltrates of small lymphocytes, variable numbers of plasma cells, and no or mild architectural distortion. Cases with large or atypical lymphocytes, nonlymphoid inflammation, or necrosis were markedly underrepresented in the study material. In addition, B-cell lymphomas and nonlymphoid neoplasms were lacking, and no cases exhibited autolysis. Given the underrepresentation of cases with large or atypical lymphocytes, the model is not expected to perform well in cases of nonsmall cell lymphoma. Adequate performance for detecting large or atypical lymphocytes would require additional training. Consequently, the model is expected to perform best on biopsies that are compatible with a diagnosis of lymphoplasmacytic enteritis or small cell lymphoma. Caution should be exercised when applying the model to other conditions and technical confounders such as faded stain or out of focus areas need to be considered. In addition, convolutional neural networks are sensitive to variations in image properties, and we anticipate that the performance of the AI model will decrease when applied to cases from laboratories not included in the training data or to WSIs generated by different slide scanners. 7 Consequently, the model is intended for a “human-in-the-loop” use scenario where the output is verified by a skilled pathologist by examining the lymphocyte mask on an H&E overlay. If these conditions are met, our data suggests that the current model is sufficiently reliable to provide a reproducible and quantitative evaluation of small lymphocytes at a whole-slide level, an outcome that a pathologist cannot currently achieve.
Supplemental Material
sj-pdf-4-vet-10.1177_03009858241286828 – Supplemental material for Artificial intelligence-based quantification of lymphocytes in feline small intestinal biopsies
Supplemental material, sj-pdf-4-vet-10.1177_03009858241286828 for Artificial intelligence-based quantification of lymphocytes in feline small intestinal biopsies by Judit M. Wulcan, Paula R. Giaretta, Sai Fingerhood, Simone de Brot, Esther E. V. Crouch, Tatiana Wolf, Maria Isabel Casanova, Pedro R. Ruivo, Pompei Bolfa, Nicolás Streitenberger, Christof A. Bertram, Taryn A. Donovan, Michael Kevin Keel, Peter F. Moore and Stefan M. Keller in Veterinary Pathology
Supplemental Material
sj-xlsx-1-vet-10.1177_03009858241286828 – Supplemental material for Artificial intelligence-based quantification of lymphocytes in feline small intestinal biopsies
Supplemental material, sj-xlsx-1-vet-10.1177_03009858241286828 for Artificial intelligence-based quantification of lymphocytes in feline small intestinal biopsies by Judit M. Wulcan, Paula R. Giaretta, Sai Fingerhood, Simone de Brot, Esther E. V. Crouch, Tatiana Wolf, Maria Isabel Casanova, Pedro R. Ruivo, Pompei Bolfa, Nicolás Streitenberger, Christof A. Bertram, Taryn A. Donovan, Michael Kevin Keel, Peter F. Moore and Stefan M. Keller in Veterinary Pathology
Supplemental Material
sj-xlsx-2-vet-10.1177_03009858241286828 – Supplemental material for Artificial intelligence-based quantification of lymphocytes in feline small intestinal biopsies
Supplemental material, sj-xlsx-2-vet-10.1177_03009858241286828 for Artificial intelligence-based quantification of lymphocytes in feline small intestinal biopsies by Judit M. Wulcan, Paula R. Giaretta, Sai Fingerhood, Simone de Brot, Esther E. V. Crouch, Tatiana Wolf, Maria Isabel Casanova, Pedro R. Ruivo, Pompei Bolfa, Nicolás Streitenberger, Christof A. Bertram, Taryn A. Donovan, Michael Kevin Keel, Peter F. Moore and Stefan M. Keller in Veterinary Pathology
Supplemental Material
sj-xlsx-3-vet-10.1177_03009858241286828 – Supplemental material for Artificial intelligence-based quantification of lymphocytes in feline small intestinal biopsies
Supplemental material, sj-xlsx-3-vet-10.1177_03009858241286828 for Artificial intelligence-based quantification of lymphocytes in feline small intestinal biopsies by Judit M. Wulcan, Paula R. Giaretta, Sai Fingerhood, Simone de Brot, Esther E. V. Crouch, Tatiana Wolf, Maria Isabel Casanova, Pedro R. Ruivo, Pompei Bolfa, Nicolás Streitenberger, Christof A. Bertram, Taryn A. Donovan, Michael Kevin Keel, Peter F. Moore and Stefan M. Keller in Veterinary Pathology
Footnotes
Acknowledgements
We would like to thank Machelle D. Williams, Department of Public Health Science, University of California Davis, Jonatan Wulcan for technical consultation, Mikael Lundin at Aiforia for assistance with custom output data formats, and Gillian Beamer at Aiforia for manuscript review.
Author Contributions
JMW and SMK designed the study and developed and tested the AI model. PRG, SF, SdB, EEVC, TW, MIC, PRR, PB, NS, CAB and TAD performed validation annotations and semiquantitative gradings of the test set. MKK and PFM contributed to the experimental design. The manuscript was written and revised by JMW and SMK with contributions from the other authors.
Declaration of Conflicting Interests
The author(s) declared no potential conflicts of interest with respect to the research, authorship, and/or publication of this article.
Funding
The author(s) disclosed receipt of the following financial support for the research, authorship, and/or publication of this article: This study was supported by the Center for Companion Animal Health (CCAH), UC Davis, School of Veterinary Medicine grant #2020-3-F. Biostatistical consultation was funded by the UC Davis Comprehensive Cancer Institute (NCI P30CA093373). JMW received support from the UC Davis Charles River Laboratories Digital Pathology Fellowship and the Peter C. Kennedy Endowed Fellowship for Veterinary Anatomic Pathology. Publication charges were funded by the UC Davis Library Open Access Fund and the Center for Companion Animal Health (CCAH), UC Davis, School of Veterinary Medicine.
ORCID iDs
Supplemental Material for this article is available online.
References
Supplementary Material
Please find the following supplemental material available below.
For Open Access articles published under a Creative Commons License, all supplemental material carries the same license as the article it is associated with.
For non-Open Access articles published, all supplemental material carries a non-exclusive license, and permission requests for re-use of supplemental material or any part of supplemental material shall be sent directly to the copyright owner as specified in the copyright notice associated with the article.