
Abstract
Objectives
This study aimed to assess left atrial (LA) size in healthy cats using cardiovascular MRI (cMRI) and to compare this with LA size assessed by two-dimensional echocardiography. The hypothesis was that cMRI would accurately determine LA size in domestic cats.
Methods
A prospective comparative study was performed. Six healthy cats were selected for the study. Standard two-dimensional echocardiography was performed with and without general anaesthesia. cMRI was conducted under general anaesthesia. A comprehensive analysis of LA mass and function measurements was performed to determine the consistency and correlation of LA size and function indicators between two-dimensional echocardiography and cMRI.
Results
Our study found that intraobserver variability for cMRI measurements was lower than that for two-dimensional echocardiography. Compared with cMRI, echocardiography under anaesthesia significantly overestimated maximal LA volume (LAVmax_2D, P <0.01) and significantly underestimated minimal LA volume (LAVmin_2D, P <0.01). The LAVmin measured by two-dimensional echocardiography exhibited the highest consistency (intraclass correlation coefficient = 0.857) and correlation (R = 0.75, P <0.01) with LAVmin measured by cMRI. The linear regression equation was LAVmin_ cMRI = 0.891 × LAVmin_2D + 0.304.
Conclusions and relevance
cMRI represents a reproducible method for assessing LA mass in domestic cats. This study underscored the importance of echocardiography in veterinary cardiology, and the LAVmin measured by two-dimensional echocardiography may reflect the true LAVmin.
Introduction
Left atrium (LA) size plays a critical role in the diagnosis and prognostication of feline cardiovascular diseases, with significant increases in size being associated with the progression of hypertrophic cardiomyopathy.1 –3 Echocardiography is the primary method for assessing LA size in veterinary cardiology, commonly by using the LA to aortic ratio.3 –5 Other echocardiographic techniques, such as the area–length method and Simpson method of discs (SMOD), are also used for precise LA volume evaluations.3,6
The use of cardiovascular MRI (cMRI) is limited in veterinary medicine because of the need for general anaesthesia and high costs, despite being the non-invasive gold standard in human medicine for assessing cardiac structure and function.7,8 The ability of cMRI to capture a realistic cardiac structure without geometric assumptions makes it highly valuable.8,9 While correlations among various imaging techniques and cardiac parameter measurements have been reported in both human and veterinary studies,10 –12 comparative studies of these imaging methods for assessing the LA in cats are lacking.
This study evaluated the consistency and correlation between commonly used two-dimensional echocardiography and cMRI measurements of LA parameters in cats.
Materials and methods
Animals
Six domestic shorthair cats (four males and two females), aged 1–4 years, weighing 3.00–4.76 kg, were included in the study. All cats had been castrated or spayed. Each cat was housed individually in cages with food and water provided ad libitum. A clinical examination, including physical examination, complete blood count and cardiac auscultation, was performed to ensure suitability for anaesthesia. No abnormalities were detected. Echocardiography was conducted before and under general anaesthesia. cMRI was performed after the echocardiography during the same anaesthetic episode. All cats were anaesthetised with an intravenous combination of tiletamine–zolazepam (Zoletil 50; Virbac) at 5 mg/kg and dexmedetomidine (Dexdomitor; Zoetis) at 10 μg/kg. No complications were observed during anaesthesia or recovery. This study was approved by the animal care and use committee of China Agricultural University (protocol code: 31604202-2-1).
Echocardiography
Echocardiography was performed by an experienced ultrasonographer using a premium veterinary diagnostic ultrasound system (Vetus 9; Mindray) with 8–12 MHz transducers. All cats underwent comprehensive echocardiography, which included two-dimensional, M-mode and colour flow Doppler, along with a single-lead echocardiogram (ECG) (lead II). Data acquisition utilised standard right-sided views, with still and dynamic images (covering three to five cardiac cycles) stored for analysis.
LA maximum (LAmax) represented the echocardiographic image obtained directly before opening of the mitral valve, in left ventricle (LV) end systole, one or two frames after the T-wave of the ECG. The diameter and volume measured or calculated from this image represented the LA maximum diameter (LADmax_2D) and LA maximum volume (LAVmax_2D). LA minimum (LAmin) represented the echocardiographic image obtained directly after closing of the mitral valve at the end of LV diastole, one or two frames after the P-wave of the ECG. The diameter and volume measured or calculated from this image represented the LA minimum diameter (LADmin_2D) and LA minimum volume (LAVmin_2D). LADmax_2D, LADmin_2D, LAVmax_2D and LAVmin_2D were measured or calculated using the methods of Linney et al 6 (see supplementary material, Figure S1). LAD was measured from the medial boundary of the atrial septum to the distal free wall on the right parasternal long-axis, four-chamber view, parallel to the mitral annulus. LAV was calculated by the SMOD method from both four-chamber echocardiographic views at end-systole (LAVmax_2D) and end-diastole (LAVmin_2D). The internal border of the LA was traced manually beginning at the septal mitral annulus, around the LA roof and ending at the lateral mitral annulus using the blood–tissue interface.
LA function was assessed by fractional shortening (FS) and ejection fraction (EF) during passive, active and complete emptying phases. Detailed calculations for these functional indices at different intervals are presented in the supplementary material (Table S1). Each measurement was taken three times across different cardiac cycles.
cMRI
cMRI was acquired with a 3T system (MRI, uMR770; United Imaging Intelligence) using phased-array knee coils. Cats were in ventral recumbency with MRI-compatible ECG leads for gating. Scanning sequences and parameters are listed in the supplementary material (Table S2). Medical measurement software (ImageJ, NIH; and Matlab, MathWorks) was used to calculate LAVmax_cMRI and LAVmin_cMRI.
A fast spin echo scan was performed to determine the position of the heart. The LAV was calculated from the Simpson method using a stack of contiguous three-chamber views (Figure 1) covering the entire LA. The most distal slice was defined as the slice that the LA was no longer visible. Each image was acquired at LV end-systole and LV end-diastole, representing LAmax and LAmin, respectively, as previously described for echocardiography. The LA boundary in each slice was manually traced from the dorsal wall of the LA to the atrioventricular junction.

Cardiovascular MRI showing a three-chamber view. (a,b) Left atrium maximum image. The yellow line marks the border of the maximal left atrium area. (c,d) Left atrium minimum image. The yellow line marks the border of the minimal left atrium area
EF (corresponding to the LAV complete EF measured by two-dimensional echocardiography) was then calculated.
EF_cMRI was calculated as:
EF_cMRI (%) = (LAVmax_cMRI – LAVmin_cMRI)/LAVmax_cMRI × 100.
Statistical analysis
Statistical analyses were conducted using SPSS, version 23 (IBM), SPSSAU (https://spssau.com) and GraphPad Prism, version 8.0.2 (GraphPad Software). The Shapiro–Wilk test was used to assess normality. Correlations were analysed using Spearman or Pearson correlation coefficients after data standardisation. Paired-sample t-tests or Wilcoxon rank-sum tests were applied for comparisons.
Intraobserver variability was evaluated by calculating the coefficient of variation (CV) from three repeated measurements per cat, with the average CV taken across all six cats. Bland–Altman analysis and the intraclass correlation coefficient (ICC) were used to assess agreement between methods. Pairwise comparisons of concordance among indicators were conducted across 18 data sets (six cats, three measurements each).
P <0.05 was considered statistically significant. Linear regression was used to quantify the relationship of the parameter with the highest correlation, using the coefficient of determination (R2), where R2 = 1 indicates perfect correlation and R2 = 0 indicates no correlation.
Results
Measurements
Six adult cats (average weight 3.88 ± 0.88 kg) were included. The average heart rate was 213.8 ± 26.6 beats per minute (bpm) when awake. Under anaesthesia, it decreased to 137.83 ± 10.4 bpm during ultrasound and 143.3 ± 28.4 bpm during cMRI. Anaesthesia lasted 70 to 90 mins without any adverse reactions for all cats. Table 1 presents measurements of LA size and function obtained through two-dimensional echocardiography and cMRI. More detailed statistical results from two-dimensional echocardiography and cMRI measurements are provided in the supplementary material (Tables S3 and S4).
Comparison of left atrial measurements by echocardiography and cMRI
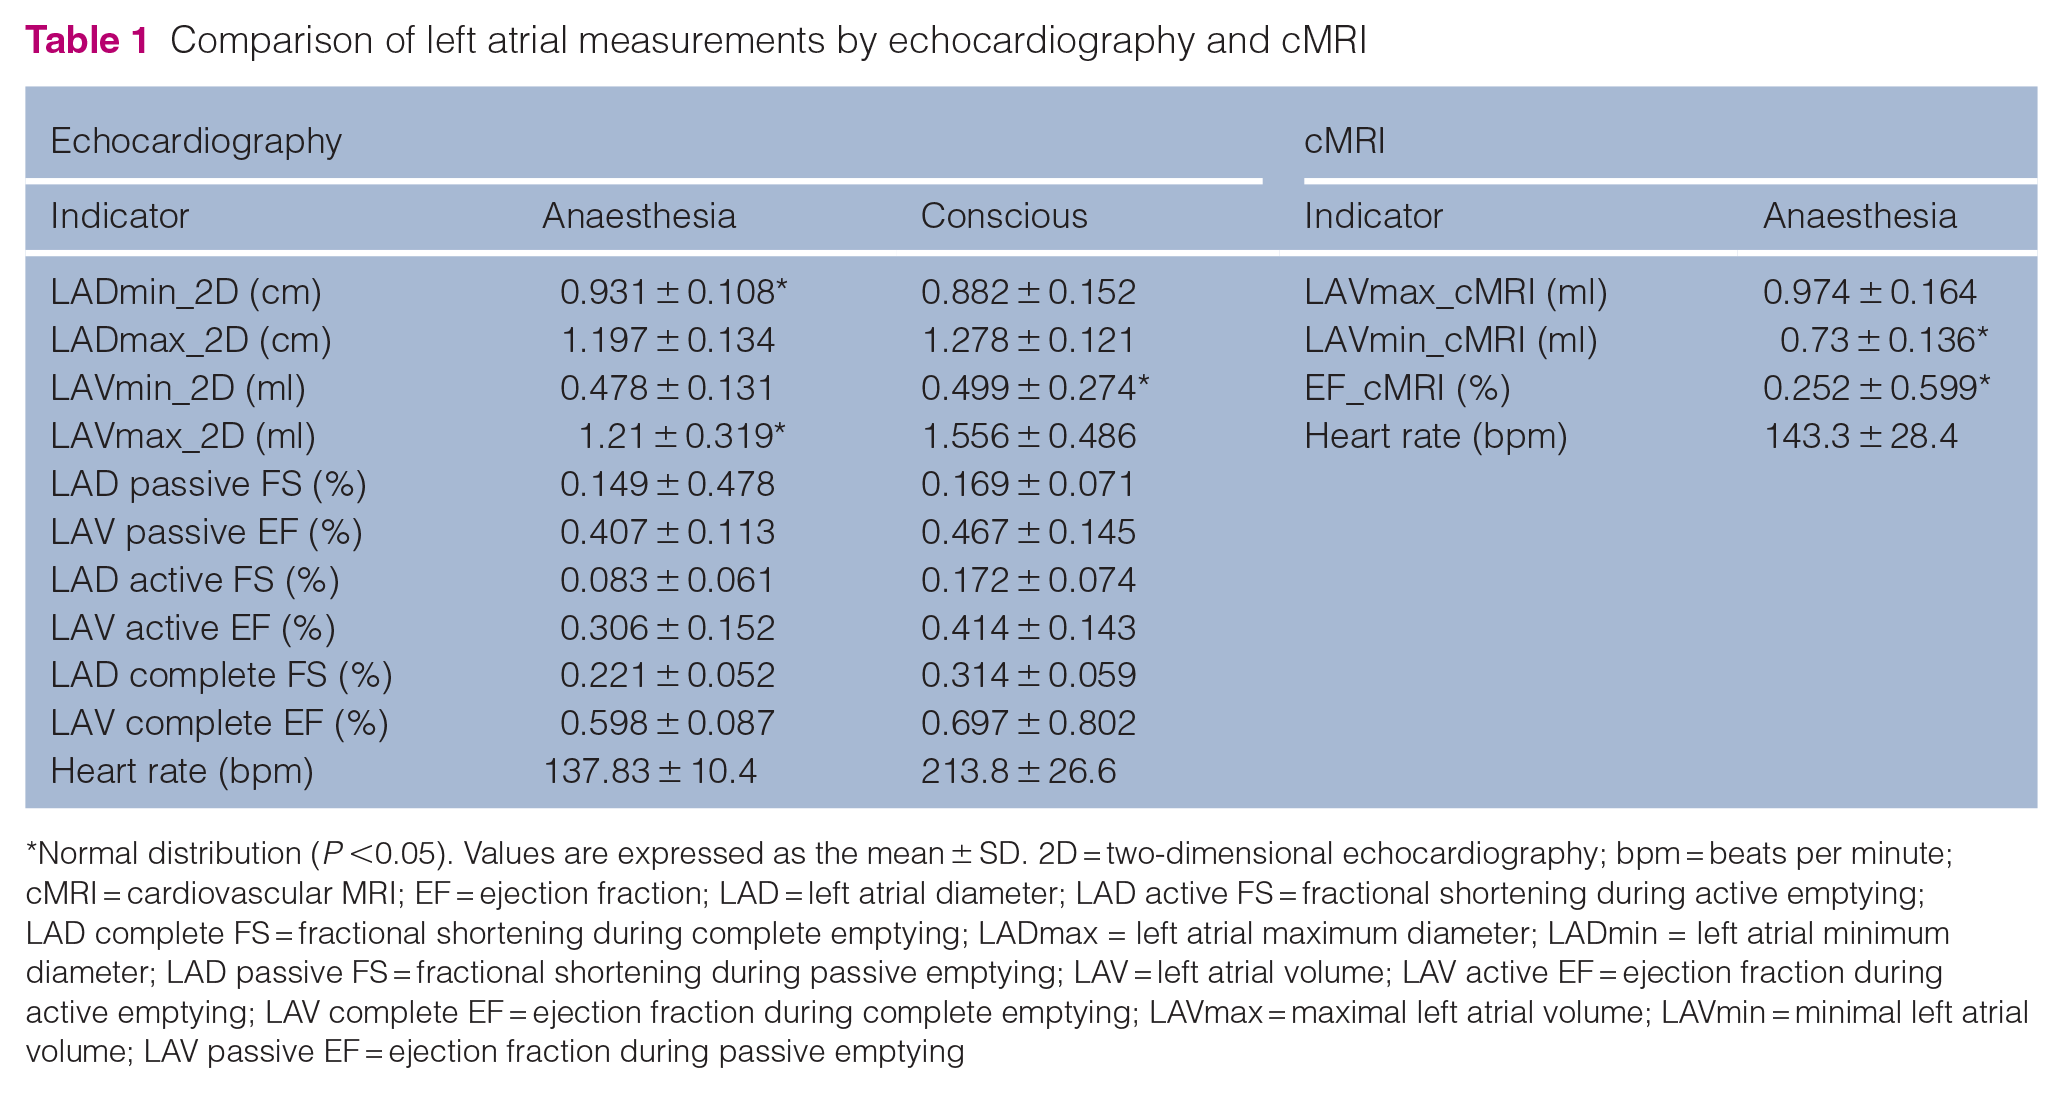
Normal distribution (P <0.05). Values are expressed as the mean ± SD. 2D = two-dimensional echocardiography; bpm = beats per minute; cMRI = cardiovascular MRI; EF = ejection fraction; LAD = left atrial diameter; LAD active FS = fractional shortening during active emptying; LAD complete FS = fractional shortening during complete emptying; LADmax = left atrial maximum diameter; LADmin = left atrial minimum diameter; LAD passive FS = fractional shortening during passive emptying; LAV = left atrial volume; LAV active EF = ejection fraction during active emptying; LAV complete EF = ejection fraction during complete emptying; LAVmax = maximal left atrial volume; LAVmin = minimal left atrial volume; LAV passive EF = ejection fraction during passive emptying
Intraobserver variability
Intraobserver variability was noted in LAVmax_cMRI and LAVmin_cMRI (2.3% and 2.4%, respectively). In echocardiographic measurement indices, the intraobserver variability of LAVmax and LAVmin (5.1–16.2%) was consistently higher than that of LADmax and LADmin (2.3–5.6%). LAVmin showed higher variability than LAVmax in both cMRI and echocardiography (see supplementary material, Tables S3 and S4).
Difference analysis
In comparison with cMRI, both anaesthetised and conscious-state echocardiography significantly overestimated LAVmax and EF, while markedly underestimating LAVmin (P <0.01) (Table 2; see also supplementary material, Figure S2). Compared with the awake state, the LADmin in echocardiographic measurements significantly increased under anaesthesia, while LAVmax, LADmax, LAD active FS, LAD complete FS and LAV complete EF significantly decreased (P <0.01). No significant differences were found in other echocardiographic indices between the two states. Detailed results can be found in Table 3.
Comparison of cMRI measurements and echocardiographic measurements

P <0.01. 95% CI = 95% confidence interval; cMRI = data from cardiovascular MRI; ECHCa = data from echocardiography under anaesthesia; ECHCc = data from conscious echocardiography; EF = ejection fraction; ICC = intraclass correlation coefficient; IQR = interquartile range; LAVmax = maximal left atrial volume; LAVmin = minimal left atrial volume. The mean, SD and IQR were calculated from the difference between the measurements of cMRI and echocardiography, and the ICC was calculated from the raw data
Comparison of measurements obtained by echocardiography during anaesthesia and while conscious

P <0.01. 2D = two-dimensional echocardiography; 95% CI = 95% confidence interval; ICC = intraclass correlation coefficient; IQR = interquartile range; LAD = left atrial diameter; LAD active FS = fractional shortening during active emptying; LAD complete FS = fractional shortening during complete emptying; LADmax = left atrial maximum volume; LADmin = left atrial minimum volume; LAD passive FS = fractional shortening during passive emptying; LAV = left atrial volume; LAV active EF = ejection fraction during active emptying; LAV complete EF = ejection fraction during complete emptying; LAVmax = left atrial maximum volume; LAVmin = left atrial minimum volume; LAV passive EF = ejection fraction during passive emptying. The mean, SD and IQR were calculated from the difference between the measurements of echocardiography during anaesthesia and consciousness, and the ICC was calculated from the raw data
Comparison of consistency
There was good consistency between echocardiographic data gathered during both awake and anaesthetised states and cMRI measurements of LAVmax, LAVmin and EF, with all measurements falling within the 95% consistency limits (Figure 2). ICC indicated a higher correlation between anaesthetised echocardiographic and cMRI measurements vs without anaesthesia. Among these, the consistency between LAVmin_2D measured by echocardiography during anaesthesia and LAVmin_cMRI was the highest, with an ICC of 0.857 (95% confidence interval = 0.660–0.944).

Bland–Altman plots comparing cardiovascular MRI (cMRI) and echocardiography (ECHO) measurements. (a) LAVmax measured by cMRI vs ECHO during anaesthesia; (b) LAVmax measured by cMRI vs ECHO without anaesthesia; (c) LAVmin measured by cMRI vs ECHO during anaesthesia; (d) LAVmin measured by cMRI vs ECHO during without anaesthesia; (e) EF measured by cMRI vs ECHO during anaesthesia; (f) EF measured by cMRI vs ECHO without anaesthesia. The y-axis represents the difference between the measured values of the two methods, and the x-axis represents the average value of the measured values of the two methods. The black solid line represents the mean value of the difference, and the black dashed lines represent the mean value of the difference ± 1.96 times the SD of the difference. The range between the upper and lower black dashed lines represents the 95% limits of agreement. EF = ejection fraction; LAVmax = left atrial maximum volume; LAVmin = left atrial minimum volume
With or without anaesthesia, the ICCs of echocardiographic indices assessing LA function (EF and FS) were lower than those assessing LA size (LAD and LAV). The former had ICCs ranging from –0.618 to 0.402, while the latter had ICCs ranging from 0.497 to 0.729, as detailed in Table 3.
Correlation analysis
LAVmin_cMRI showed the strongest correlation with both LAVmin_2D and LAVmax_2D measured under anaesthesia, with Spearman correlation coefficients of 0.75 (P <0.01). The correlation between LAVmax_cMRI and echocardiographic indices during anaesthesia was weaker compared with LAVmin_cMRI. EF_cMRI showed low correlations with all indices (see supplementary material, Figure S3).
The correlation between the same echocardiographic indices with and without anaesthesia ranged from 0.33 to 0.78, with the highest being LAVmin at 0.78, followed by LADmin at 0.75. LAVmin_2D measured under anaesthesia had the highest consistency (ICC = 0.857) and correlation (r = 0.75) with LAVmin_cMRI. Therefore, this index was chosen for linear regression modelling. The final regression equation is shown in Figure 3. The adjusted R² was 0.720. The regression coefficient for LAVmin_2D was 0.891 (P <0.01), indicating a highly significant positive correlation between LAVmin_2D and LAVmin_cMRI.

Linear regression analysis of left atrial minimum volume (LAVmin) measured by two-dimensional echocardiography (LAVmin_2D) and cardiovascular MRI (LAVmin_cMRI)
Discussion
cMRI, commonly used in human patients, avoids geometric assumptions, capturing the heart’s authentic structure and enabling image acquisition in many orientations. 8 cMRI is considered the non-invasive reference standard for human cardiac function and mass assessment and is the preferred imaging modality for accurate measurement.13 –15 We hypothesised that cMRI could serve as a reference standard for measuring LA size in cats. The results showed that under the current conditions of using a 3T MRI scanner, restricting respiratory movement, maintaining the heart rate around 138 bpm under anaesthesia, and employing a balanced steady-state free precession sequence, clear long-axis, three-chamber cardiac images were obtained. Our study found that the intraobserver CV for cMRI measurements was smaller than that for two-dimensional echocardiography, which was consistent with findings in human studies, 10 demonstrating that cMRI has higher accuracy and reproducibility compared with two-dimensional echocardiography.
We used a combination of 10 μg/kg dexmedetomidine and 5 mg/kg midazolam-zolazepam (1:1 formulation) for anaesthesia. Comparing two-dimensional echocardiographic results between anaesthetised and conscious states, anaesthesia significantly reduced LA emptying function (decreasing LAD complete FS and LAV complete EF). Despite high inherent variability of EF and FS (ICC = 0–0.402), the reduction under anaesthesia remained significant (P <0.01). A significant increase in LADmin (P <0.01) was observed during echocardiography under anaesthesia compared with the conscious state, which may suggest that anaesthesia with the current drug combination reduced heart contractility or elasticity. Anaesthesia also significantly reduced diastolic capacity (decreasing LADmax and LAVmax) during two-dimensional echocardiography compared with the conscious state. These results align with findings in dogs where dexmedetomidine reduced both diastolic and systolic cardiac function.16 –18
Our study found that, compared with cMRI, echocardiography under anaesthesia significantly overestimated LAVmax and significantly underestimated LAVmin. This differs from human studies but aligns with findings in dogs.10,12 Fries et al 11 found that, compared with cMRI, two-dimensional echocardiography and CT overestimated LAVmax while three-dimensional echocardiography underestimated LAVmax in dogs. In human studies, there was a good correlation between cMRI, spiral CT and echocardiography for LAV assessment.19,20 However, echocardiography consistently underestimated LAV, with two-dimensional and three-dimensional transthoracic echocardiography systematically underestimating LAV by 23–34% compared with cMRI, spiral CT or contrast ventriculography.10,21 In cats there have been limited comparative investigations of two-dimensional echocardiography and advanced imaging modalities. Rauch et al 1 found that values for LAVmax and LAVmin obtained from two-dimensional echocardiography were significantly higher than those obtained from three-plane and real-time three-dimensional echocardiography. There have not yet been any comparisons between real-time three-dimensional echocardiography and cMRI in cats. These disparities may result from inherent limitations in measurement methodologies. During echocardiographic scanning, the LA appendage, the area between the mitral annulus plane and the mitral valve leaflets, was not included in the LAV assessment, whereas cMRI measurements included the LA appendage. Additionally, poor image quality and suboptimal acoustic windows may lead to inadequate anatomical depiction of the LA wall with two-dimensional echocardiography. 22 The monoplane SMOD method, initially designed for left ventricular volume estimation, may not accurately estimate LAV in cats, as it assumes the selected region to be composed of discs, which may contradict the true anatomical structure of the feline LA, which is oval-shaped.
Our results demonstrated a high correlation and consistency between LAV measured by cMRI and two-dimensional echocardiography, particularly for LAVmin. Some studies have suggested that LAVmin may be more prone to measurement errors due to its smaller values compared with LAVmax. 1 Recent research showed significant associations between LAVmin and cardiovascular parameters such as left ventricular diastolic dysfunction, 23 end-diastolic pressure 24 and N-terminal pro-B-type natriuretic peptide levels. 25 LAVmin has been found to increase gradually during the early stages of left ventricular diastolic dysfunction, whereas LAVmax only increased in the late stages. 19 Considering that feline cardiac diseases primarily cause diastolic dysfunction, LAVmin can be an early indicator of elevated end-diastolic pressure and the asymptomatic stage of heart failure in cats. 3
However, this study has several limitations. The small sample size, consisting only of healthy research cats, cannot represent the feline population. Additionally, we measured LAV using long-axis three-chamber heart images instead of the short-axis view in cMRI due to suboptimal image quality. To further improve the quality of cMRI measurements of LA size, it may be necessary to further suppress the heart rate and respiratory rate using an external ventilator to control the interference of breathing with image acquisition. Moreover, this preliminary study focused solely on intraobserver variability without assessing interobserver variability. Variations between different observers could introduce uncertainty, affecting the reliability of LAV assessments. Future studies should involve multiple cardiology experts to mitigate this issue.
Conclusions
Our study found that cMRI has the potential to be a reliable tool for feline cardiac assessment. In veterinary practice, LAVmin measured by two-dimensional echocardiography can replace LAVmin measured by cMRI, reflecting the true LAVmin.
Supplemental Material
Table S1
Computing methods of left atrial function indicators.
Supplemental Material
Table S2
cMRI scanning parameters.
Supplemental Material
Table S3
Descriptive statistics of measurements by echocardiography and cMRI during anaesthesia.
Supplemental Material
Table S4
Descriptive statistics of measurements by echocardiography during consciousness.
Supplemental Material
Figure S1
Indices measured on right parasternal long-axis 4-chamber view.
Supplemental Material
Figure S2
Comparison of cMRI measurements and echocardiographic measurements during anaesthesia and consciousness.
Supplemental Material
Figure S3
Correlation matrix of indicators of cMRI, echocardiography during consciousness and during anaesthesia.
Footnotes
Acknowledgements
We thank the staff of the Imaging Center of China Agricultural University Veterinary Teaching Hospital for their help with the manuscript.
Conflict of interest
The authors declared no potential conflicts of interest with respect to the research, authorship, and/or publication of this article.
Funding
This work was funded by The Talent Fund of China Agricultural University Veterinary Teaching Hospital (Beijing Zhongnongda Veterinary Hospital Co, Ltd) (Grant Number: 1051-2224003).
Ethical approval
The work described in this manuscript involved the use of experimental animals and the study therefore had prior ethical approval from an established (or ad hoc) committee as stated in the manuscript.
Informed consent
Informed consent (verbal or written) was obtained from the owner or legal custodian of all animal(s) described in this work (experimental or non-experimental animals, including cadavers, tissues and samples) for all procedure(s) undertaken (prospective or retrospective studies). No animals or people are identifiable within this publication, and therefore additional informed consent for publication was not required.
Supplementary material
The following files are available as supplementary material:
Table S1: Computing methods of left atrial function indicators.
Table S2: cMRI scanning parameters.
Table S3: Descriptive statistics of measurements by echocardiography and cMRI during anaesthesia.
Table S4: Descriptive statistics of measurements by echocardiography during consciousness.
Figure S1: Indices measured on right parasternal long-axis 4-chamber view.
Figure S2: Comparison of cMRI measurements and echocardiographic measurements during anaesthesia and consciousness.
Figure S3: Correlation matrix of indicators of cMRI, echocardiography during consciousness and during anaesthesia.
References
Supplementary Material
Please find the following supplemental material available below.
For Open Access articles published under a Creative Commons License, all supplemental material carries the same license as the article it is associated with.
For non-Open Access articles published, all supplemental material carries a non-exclusive license, and permission requests for re-use of supplemental material or any part of supplemental material shall be sent directly to the copyright owner as specified in the copyright notice associated with the article.