
Abstract
Objectives
The aims of this study were to compare signalment and laboratory parameters between diabetic (D) and non-diabetic (ND) cats and poorly-controlled diabetic (PD) and well-controlled diabetic (WD) cats in Germany.
Methods
Laboratory data from Antech Lab Germany between 2015 and 2018 were retrospectively analysed. Age, sex, red blood cell count (RBC), creatinine (CREA), alkaline phosphatase (AP), alanine aminotransferase (ALT), bilirubin (BILI), cholesterol (CHOL), triglycerides (TRI), glucose (GLU) and total thyroxine (TT4) were compared between D (fructosamine ⩾340 µmol/l) and ND cats, and PD (fructosamine >500 µmol/l) and WD (fructosamine 340–500 µmol/l) cats. The proportion of cats with anaemia (RBC ⩽4.21 ×10¹²/l), CREA >250 µmol/l, ALT >455 U/l, AP >315 U/l, BILI ⩾35 µmol/l and TT4 > reference interval (RI) was compared between PD and WD cats. Data are presented as median and interquartile range (IQR) and analysed using non-parametric tests. Significance was P<0.05, and effect size was assessed by Cramér V or r.
Results
In total, 129,505 cats were included (D: n = 9334 [prevalence 7.2%], WD: n = 5670/9334 [60.7%]). The median age of D and ND cats was 12 years (IQR D 9–14; ND 9–15); there was no difference in sex. A significant difference was found between groups (D vs ND; PD vs WD) for all parameters studied. Considering the effect sizes and medians outside the RI, the only relevant difference was higher CHOL, TRI, AP and GLU in PD compared with WD (CHOL: PD 7.46 [5.85–9.32] vs WD 5.44 [4.32–6.97] mmol/l, P<0.001, r = 0.39; TRI: PD 1.44 [0.84–3.66] vs WD 0.78 [0.5–1.35] mmol/l, P <0.001, r = 0.35; AP: PD 66 [47–92] vs WD 35 [23–59] U/l, P <0.001, r = 0.39; GLU: PD 23.7 [20.15–27.3] vs WD 6.89 [5–11.31] mmol/l, P <0.001, r = 0.69).
Conclusions and relevance
Laboratory changes in diabetic cats were mild and mainly associated with lipid derangements.
Introduction
Diabetes mellitus (DM) is one of the most common endocrinopathies in cats. Estimates of prevalence in the range of 0.08–1.24% have been reported for a few countries, such as the UK, Sweden, Australia and the USA,1–5 but for most countries, the prevalence is unreported. Older age (usually >11 years) has been uniformly identified as a risk factor in numerous studies.2,4–8 Furthermore, in most studies, the male sex was overrepresented and considered a risk factor for DM.1,3,5,6,8–10 In contrast, O’Neill et al 2 could not detect a significant difference between the sexes after taking the effects of other risk factors (body weight) into account. Discrepancies between studies also exist regarding the influence of neutering. Although McCann et al 1 detected an increased risk for neutered cats to develop DM, Prahl et al 5 did not.
The use of different databases (first opinion practice, large hospitals, universities) and different statistical methods might explain the wide range of reported prevalences and some variation in risk factors; however, true regional differences might also exist. Given the differences in reported data across studies, knowledge of local prevalence and risk factors might be useful to veterinarians and researchers, as well as other parties involved in veterinary care (eg, insurance companies, pharmaceutical companies).
In most diabetic cats, laboratory tests are performed at the time of diagnosis and/or at follow-up visits; however, studies reporting on clinicopathological findings other than the expected hyperglycaemia and elevated fructosamine are scarce. One older investigation evaluated laboratory submissions of 104 diabetic cats between 1992 and 1994 and found that most cats with DM had hypercholesterolaemia and elevation of at least one liver enzyme. 9 Furthermore, a review on the interpretation of clinical pathology findings in geriatric veterinary patients stated that in the presence of DM, activity of alanine aminotransferase (ALT), alkaline phosphatase (AP) and gamma-glutamyl transferase (GGT) is often increased, and in some cases, prerenal azotaemia can be found as a result of dehydration. 11 Unfortunately, the primary reference was not provided in this publication. Otherwise, information on laboratory findings in diabetic cats can only be found in veterinary textbooks.12–14 Here, it is described that haematological abnormalities are usually mild and include non-regenerative normochromic anaemia or stress leukogram. Common biochemical abnormalities include up to a five-fold increase in ALT, up to a three-fold increase in AP, up to a two-fold increase in bilirubin concentration (BILI) and up to a three-fold increase of concentration of cholesterol (CHOL) and triglycerides (TRI). It is also reported that creatinine and urea are expected to be normal in uncomplicated DM. Again, original references were not provided in those textbooks.12–14 The description of clinicopathological findings in D cats is therefore not supported by large studies.
The aims of our study therefore were three-fold: (1) to determine the prevalence of feline DM in a large laboratory convenience sample in Germany and evaluate age, sex and neuter status; (2) to describe the occurrence of changes in selected haematological and biochemical variables in diabetic (D) cats compared with non-diabetic (ND) cats; and (3) to compare selected haematological and biochemical variables between poorly-controlled diabetic (PD) and well-controlled diabetic (WD) cats.
Materials and methods
Laboratory data and inclusion criteria
This was a retrospective, cross-sectional study using data from laboratory submissions to a large commercial laboratory, Antech Lab Germany (formerly SYNLAB.vet), with five locations in Germany between 2015 and 2018. All submissions for routine haematology (ADVIA 2120i; Siemens Diagnostics) and serum biochemistry (AU 5800, AU 680; Beckman Coulter), including fructosamine (measured using the abovementioned biochemistry analysers) and total thyroxine (TT4) (IMMULITE 2000 XPi Immunoassay System; Siemens Medical Solutions Diagnostics) from cats within this period were included as long as the fructosamine measurement was available. The fructosamine measurement was part of the routine serum biochemistry profile and did not have to be requested separately by a submitting veterinarian, but cats with missing fructosamine as a result of insufficient sample material were excluded. Cats in which other blood parameters were occasionally missing (because of insufficient sample material) were included as long as the fructosamine measurement was performed. Where multiple blood samples from the same cat were submitted during the study, only the submission with the highest measurement of fructosamine was included. Age, sex and neuter status, as well as selected haematological and biochemical parameters (see below), were provided by the laboratory.
Diagnosis of DM and glycaemic control
Cats were considered diabetic if they had fructosamine concentrations above the upper laboratory reference interval (RI) (⩾340 µmol/l). Increased fructosamine concentrations have been shown to be highly specific for DM diagnosis in cats. 15 Information about clinical signs was not available and could not be used to make a diagnosis of DM. Although hyperglycaemia is a hallmark of DM, glucose concentration was not used to differentiate between D and ND cats in this study because of several limitations of glucose measurement. First, hyperglycaemia can occur in ND cats because of stress (including stress of blood sampling) and therefore is not a reliable marker of DM in cats. Second, D cats treated with insulin can be normoglycaemic; therefore, DM cannot be excluded based on normal glucose concentration. Finally, information on pre-analytical sample handling, such as time lapsed between blood sampling and centrifugation, was not available. A longer period between sampling and sample processing can lead to a decrease in blood glucose due to in vitro glycolysis. 16
Cats with fructosamine concentrations >500 µmol/l were classified as PD cats, in agreement with previous studies.12,17–22 Data on clinical signs were not available and could therefore not be used for this classification. Glucose concentration was not used to assess the quality of glycaemic control because spot blood glucose measurements are not recommended to assess the quality of glycaemic control according to current DM management guidelines.23,24
Comparison of selected laboratory parameters between D and ND, and PD and WD
The following laboratory parameters were compared between D and ND cats as well as PD and WD cats: red blood cell count (RBC); creatinine concentration (CREA); glucose concentration (GLU); AP; ALT; BILI; CHOL; TRI; and TT4. RBC rather than haematocrit (HCT) value or packed cell volume (PCV) was evaluated because those two latter parameters are affected by erythrocyte swelling during storage, which can lead to a significant increase in HCT/PCV within 12 h of blood collection. 25 The proportion of cats with at least moderate anaemia (RBC ⩽4.21 ×10¹²/l), CREA >250 µmol/l (azotaemia indicating significant kidney disease likely associated with clinical signs, ie, International Renal Interest Society [IRIS] stage 3 or 4), 26 ALT >455 U/l (5× upper RI of the laboratory), AP >315 U/l (5× upper RI of the laboratory), BILI ⩾35 µmol/l (indicating clinically detectable icterus) 27 and increased TT4 (above laboratory RI, indicating uncontrolled hyperthyroidism) was compared between PD and WD. The cut-off of 4.21 ×10¹²/l RBCs for the diagnosis of moderate anaemia was calculated using the following equation:

where MCV is mean cell volume, and a MCV of 47.5 fl and HCT of 20%, indicating moderate anaemia, were assumed. 28 Reticulocyte count was only available in less than 50% of the submissions; therefore, further classification of anaemia (regenerative vs non-regenerative) was not attempted.
Statistical analysis
The statistical analysis was carried out using SPSS version 28.0 (IBM). The data were assessed for normality by visual inspection of histograms. Graphical inspection was preferred over formal statistical tests in the evaluation of normal distribution since it avoids the pitfalls of misusing the P values in formal tests, especially in large sample sizes. 29 As most data were not normally distributed, the data are reported as median (interquartile range [IQR]). The prevalence of DM is reported as the proportion (in %) of diabetic cats among laboratory submissions and 95% confidence interval (CI). The Mann–Whitney U-test was applied to compare the age (D vs ND) and laboratory parameters between the different groups (D vs ND, WD vs PD). Categorical variables (sex, neuter status, proportions of cats with anaemia and elevation of selected laboratory parameters above a certain cut-off as described above) were compared using the χ2 test. P <0.05 was considered significant. A Bonferroni correction was applied to the P value when assessing the differences in sex and neutering status between D and ND cats because these variables are not independent from each other. To assess the effect size, r was determined following the Mann–Whitney U-tests 30 and Cramér V following the χ2 test. 31 With a large sample size, as in this study, minimal differences between study groups/populations might be significant based on P value, and effect sizes r or Cramér V help interpret the relevance of any significant results. 32 According to Cohen, r or V of 0.1, 0.3 and 0.5 indicate a small, medium and large effect, respectively.33–35 For numerical variables, besides the P value and the effect size, the medians in relation to the laboratory RI were also used to interpret the results.
Results
Age, sex and neuter status
Fructosamine concentration was missing in 426 cats; therefore, 129,505 cats were included in the analysis. Of these, 9334 cats were diabetic, resulting in a DM prevalence of 7.2% (95% CI 7.0–7.4) in this population of cats based on laboratory submissions (Figure 1).
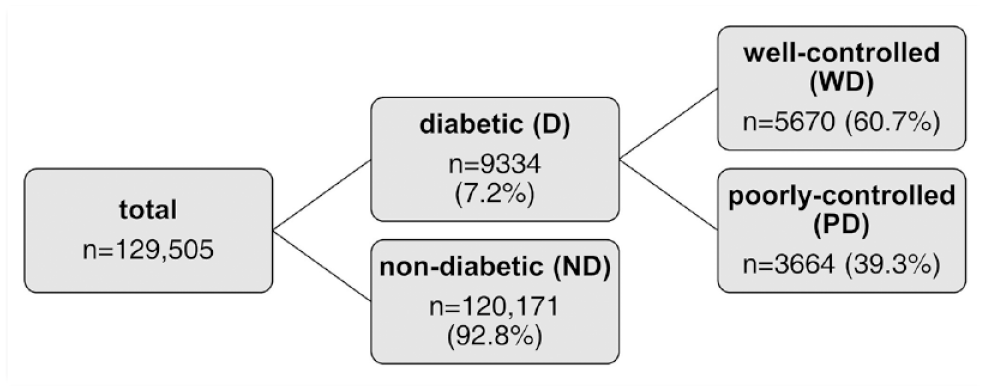
Classification of cats based on the presence or absence of diabetes (cats with fructosamine concentrations ⩾340 μmol/l were classified as diabetic [D]) and within the diabetic population into well-controlled diabetic (WD) and poorly-controlled diabetic (PD) individuals (cats with fructosamine concentrations >500 μmol/l were considered poorly controlled)
Despite equal medians (D: 12 years, IQR 9–14; ND: 12 years, IQR 9–15), there was a significant difference in the age of D and ND cats (P <0.001). However, based on r = 0.02, indicating a negligible effect size, this difference was considered not relevant. Most cats in both groups were aged ⩾9 years (D: 6490 [79.8%]; ND: 83,201 [78.3%]). Information regarding sex was provided in 118,668 (91.6%) cats (60,897 male [51.3%], 57,771 female [48.7%]). At the time of blood testing, 56,834 (93.3%) male cats and 52,225 (90.4%) female cats were neutered. The distribution of sexes, including neuter status, in D and ND cats is presented in Figure 2.
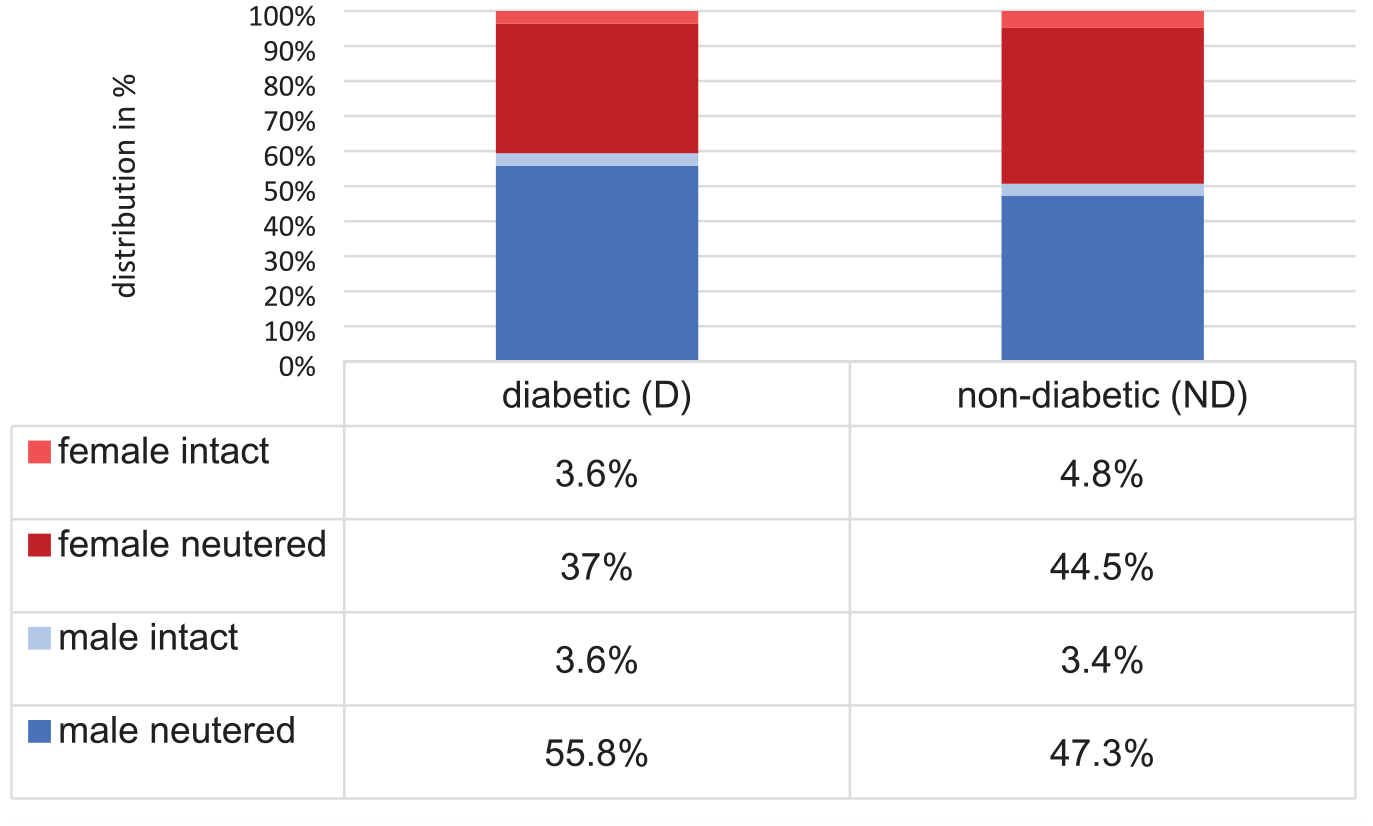
Distribution (in %) of sex and neutering status in diabetic (D) (n = 9334) and non-diabetic (ND) (n = 120,171) cats
The results of the statistical analysis comparing the proportions of sexes, including neuter status, between D and ND cats are shown in Table 1. Although there was a significantly higher proportion of male cats among the D cats than the ND cats, as well as a lower proportion of female intact cats and a higher proportion of male neutered cats (Figure 2, Table 1), these differences were of negligible effect sizes and therefore not considered relevant.
Comparison of sex and neuter status between diabetic (D) and non-diabetic (ND) cats
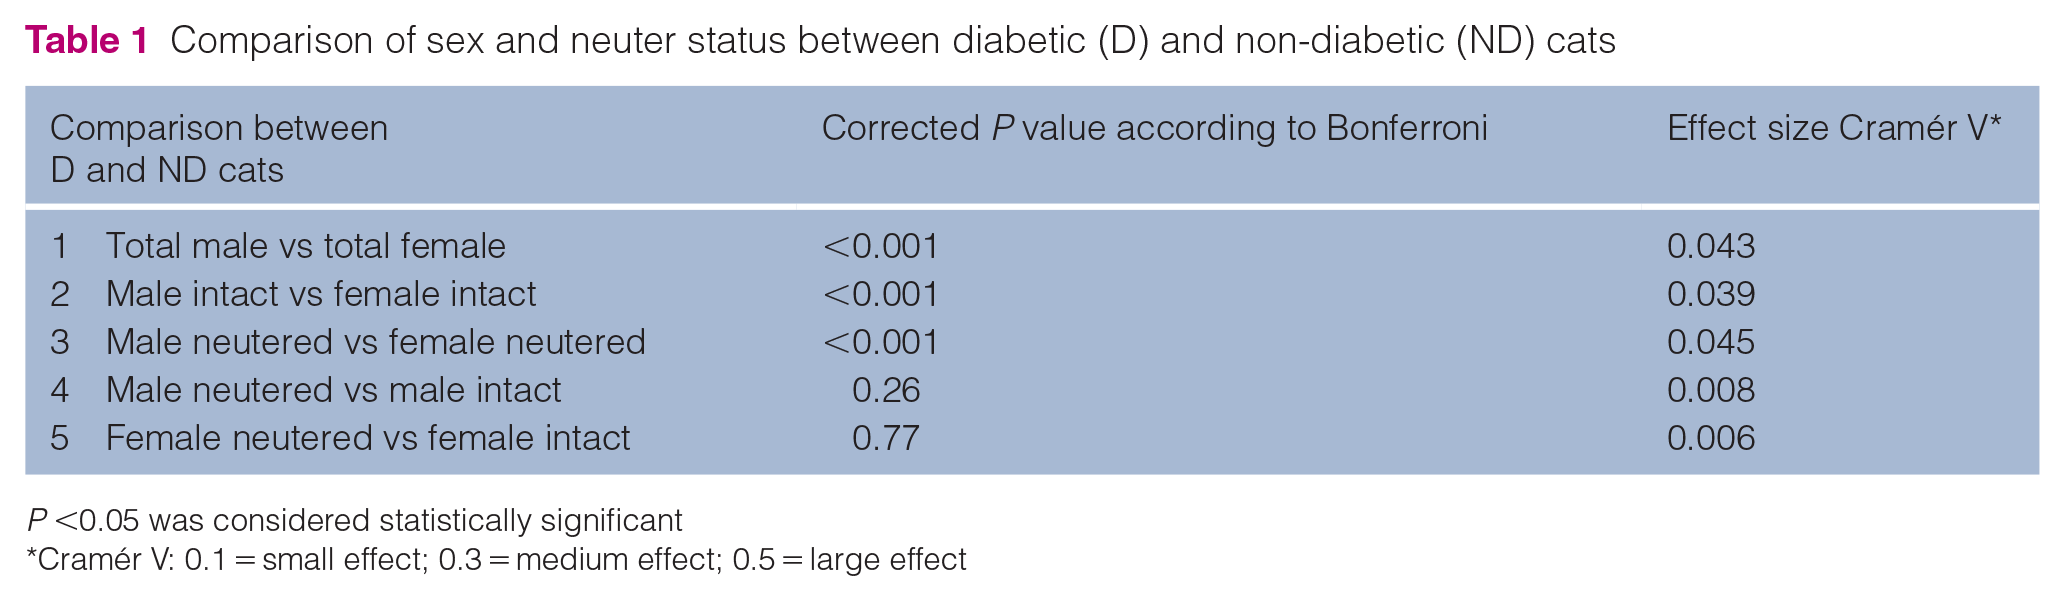
P <0.05 was considered statistically significant
Cramér V: 0.1 = small effect; 0.3 = medium effect; 0.5 = large effect
Comparison of selected laboratory parameters between D and ND cats
Significant differences between D and ND cats were detected for all selected haematological and biochemical parameters based on a P value <0.05 (Table 2).
Comparison of selected laboratory parameters between diabetic (D) and non-diabetic (ND) cats
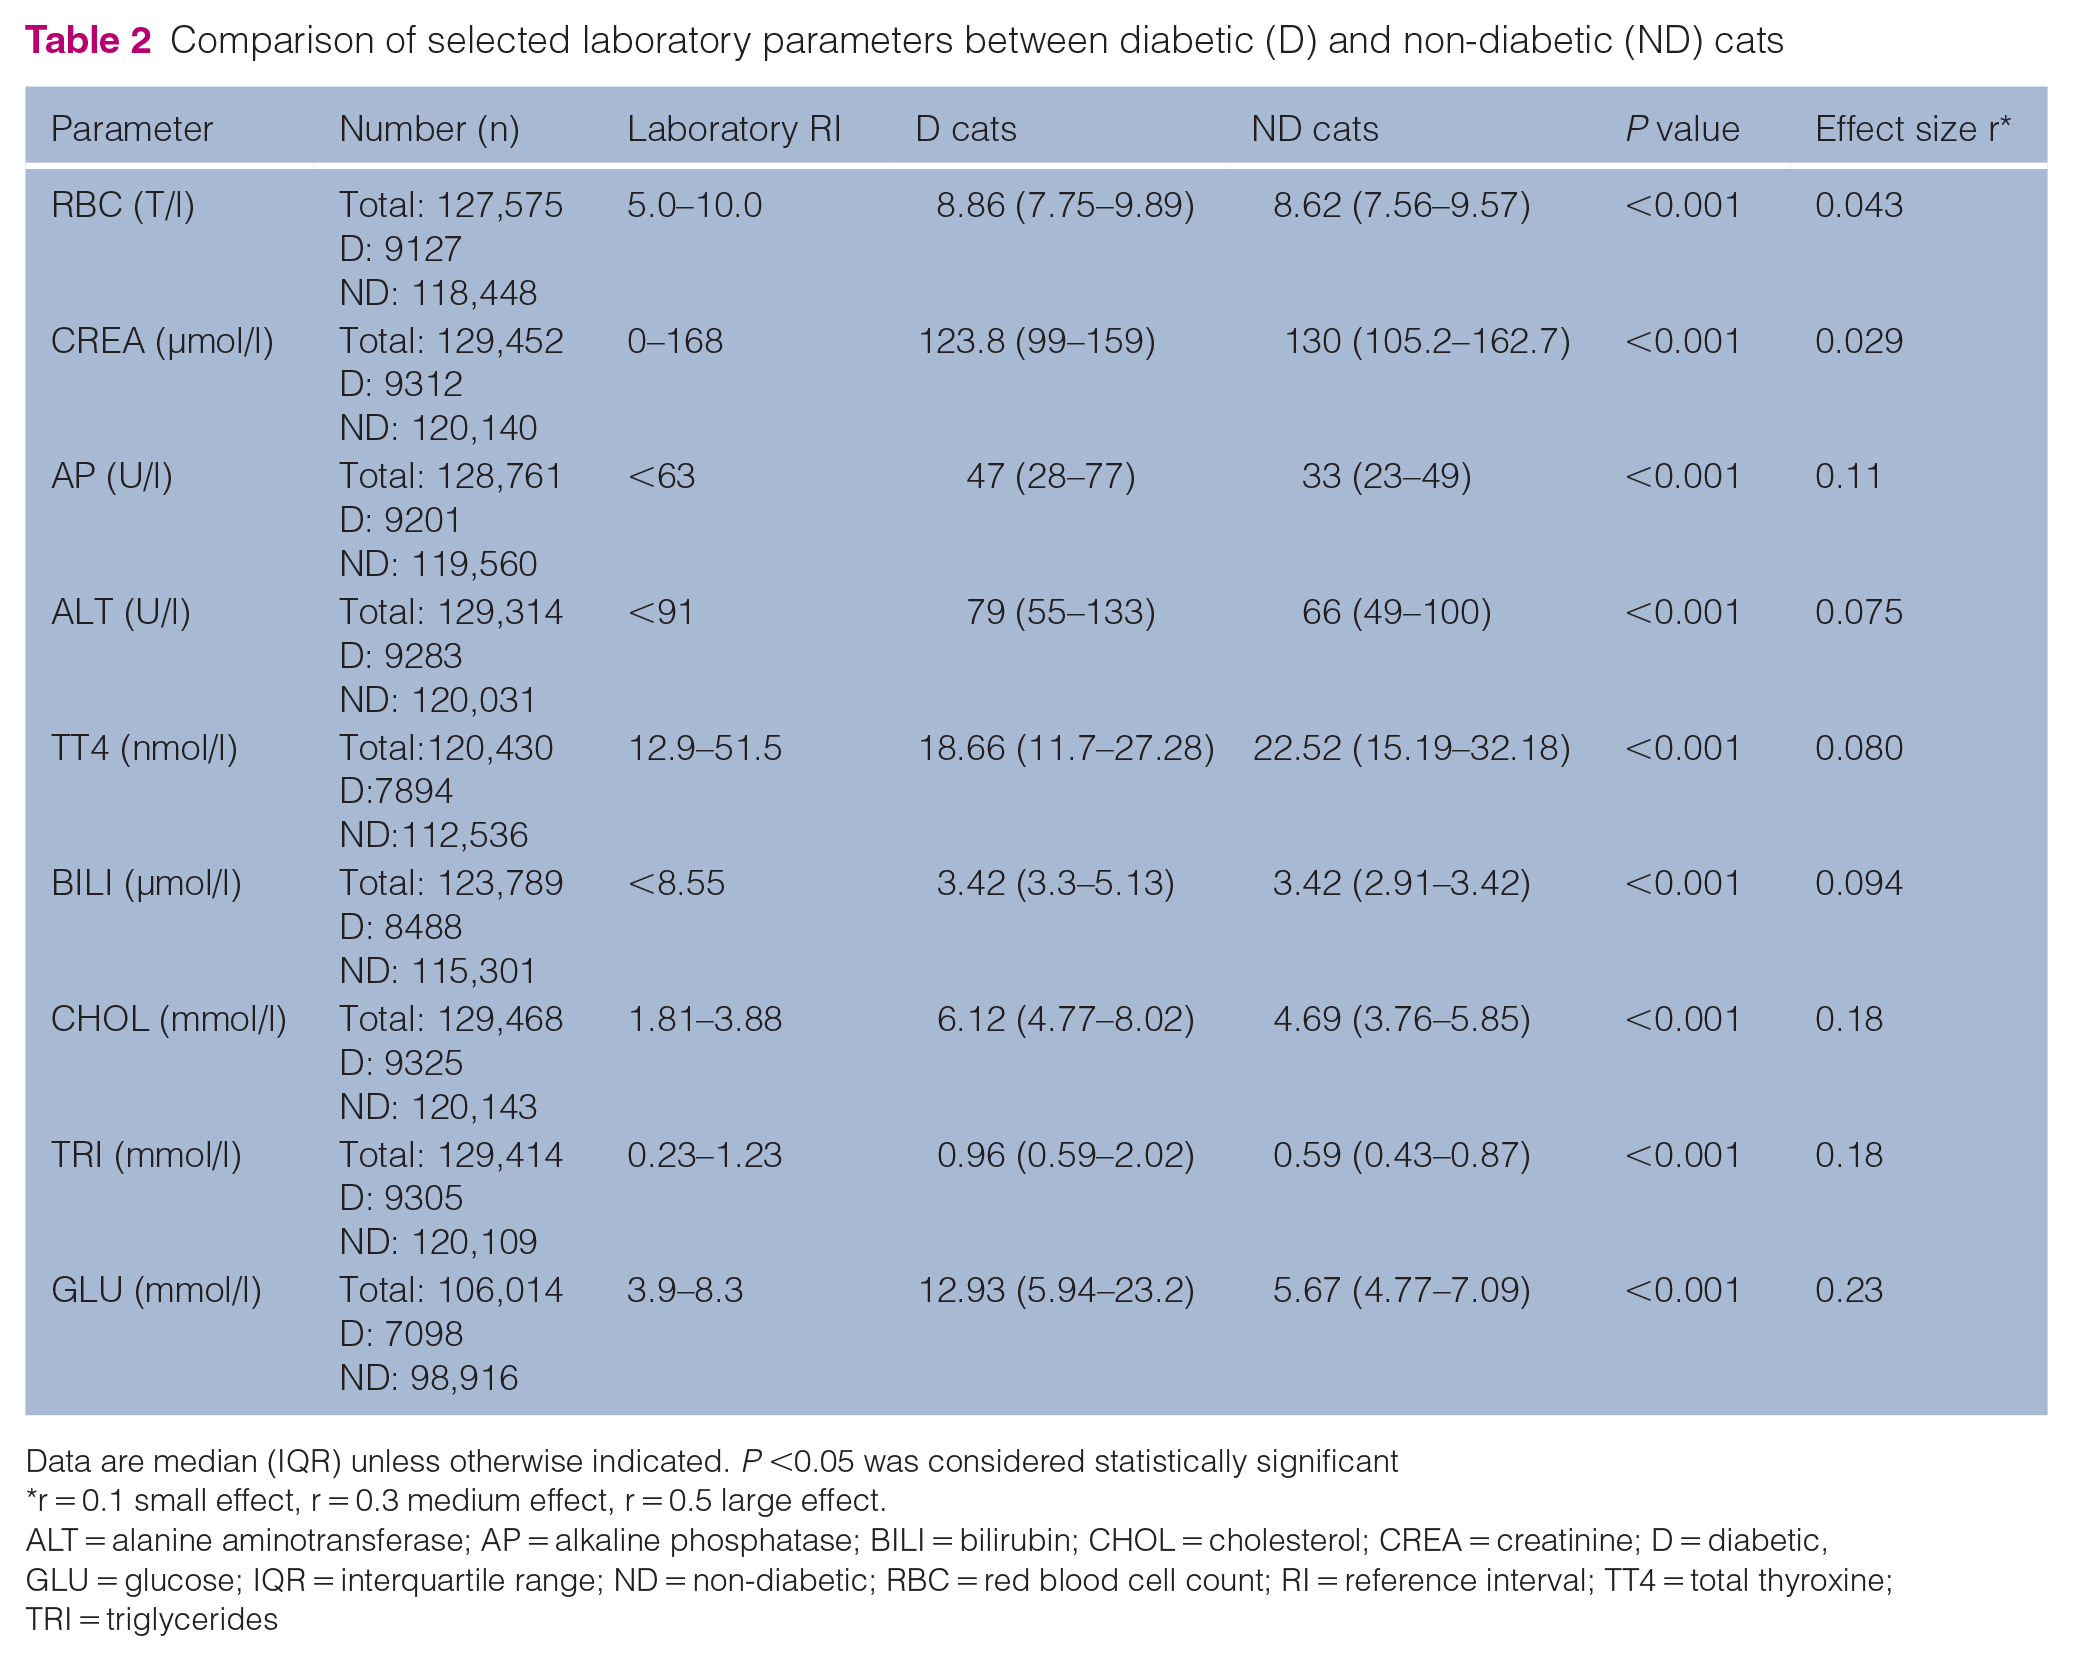
Data are median (IQR) unless otherwise indicated. P <0.05 was considered statistically significant
r = 0.1 small effect, r = 0.3 medium effect, r = 0.5 large effect.
ALT = alanine aminotransferase; AP = alkaline phosphatase; BILI = bilirubin; CHOL = cholesterol; CREA = creatinine; D = diabetic, GLU = glucose; IQR = interquartile range; ND = non-diabetic; RBC = red blood cell count; RI = reference interval; TT4 = total thyroxine; TRI = triglycerides
RBC, AP, ALT, CHOL, TRI and GLU were higher in the D cats, while CREA and TT4 were lower. However, for all tested variables apart from CHOL and GLU, the medians lay within the RI in both groups. The medians of CHOL were outside (above) the laboratory RI in both groups and the median of GLU was above the laboratory RI in the D. Furthermore, the effect sizes were negligible (r <0.1) for all parameters but AP, CHOL, TRI and GLU (Table 2). In these four, r in the range of 0.1–0.3 indicated a meaningful but small relevance. Taken together, the most significant and relevant finding was the higher CHOL in D cats when compared with ND cats. As expected, GLU was higher in D cats when compared with ND cats.
Comparison of selected laboratory parameters between WD and PD
Of the diabetic patients, 60.7% (n = 5670, 95% CI 59.8–61.7) were well controlled and 39.3% (n = 3664, 95% CI 38.3–40.3) were poorly controlled based on a fructosamine concentration ⩽500 μmol/ or >500 μmol/l, respectively. Similar to the comparison between D and ND cats, significant differences between WD and PD were detected for all selected laboratory parameters based on P <0.05 (Table 3).
Comparison of selected laboratory parameters between well-controlled diabetic (WD) and poorly-controlled diabetic (PD) cats with effect size r
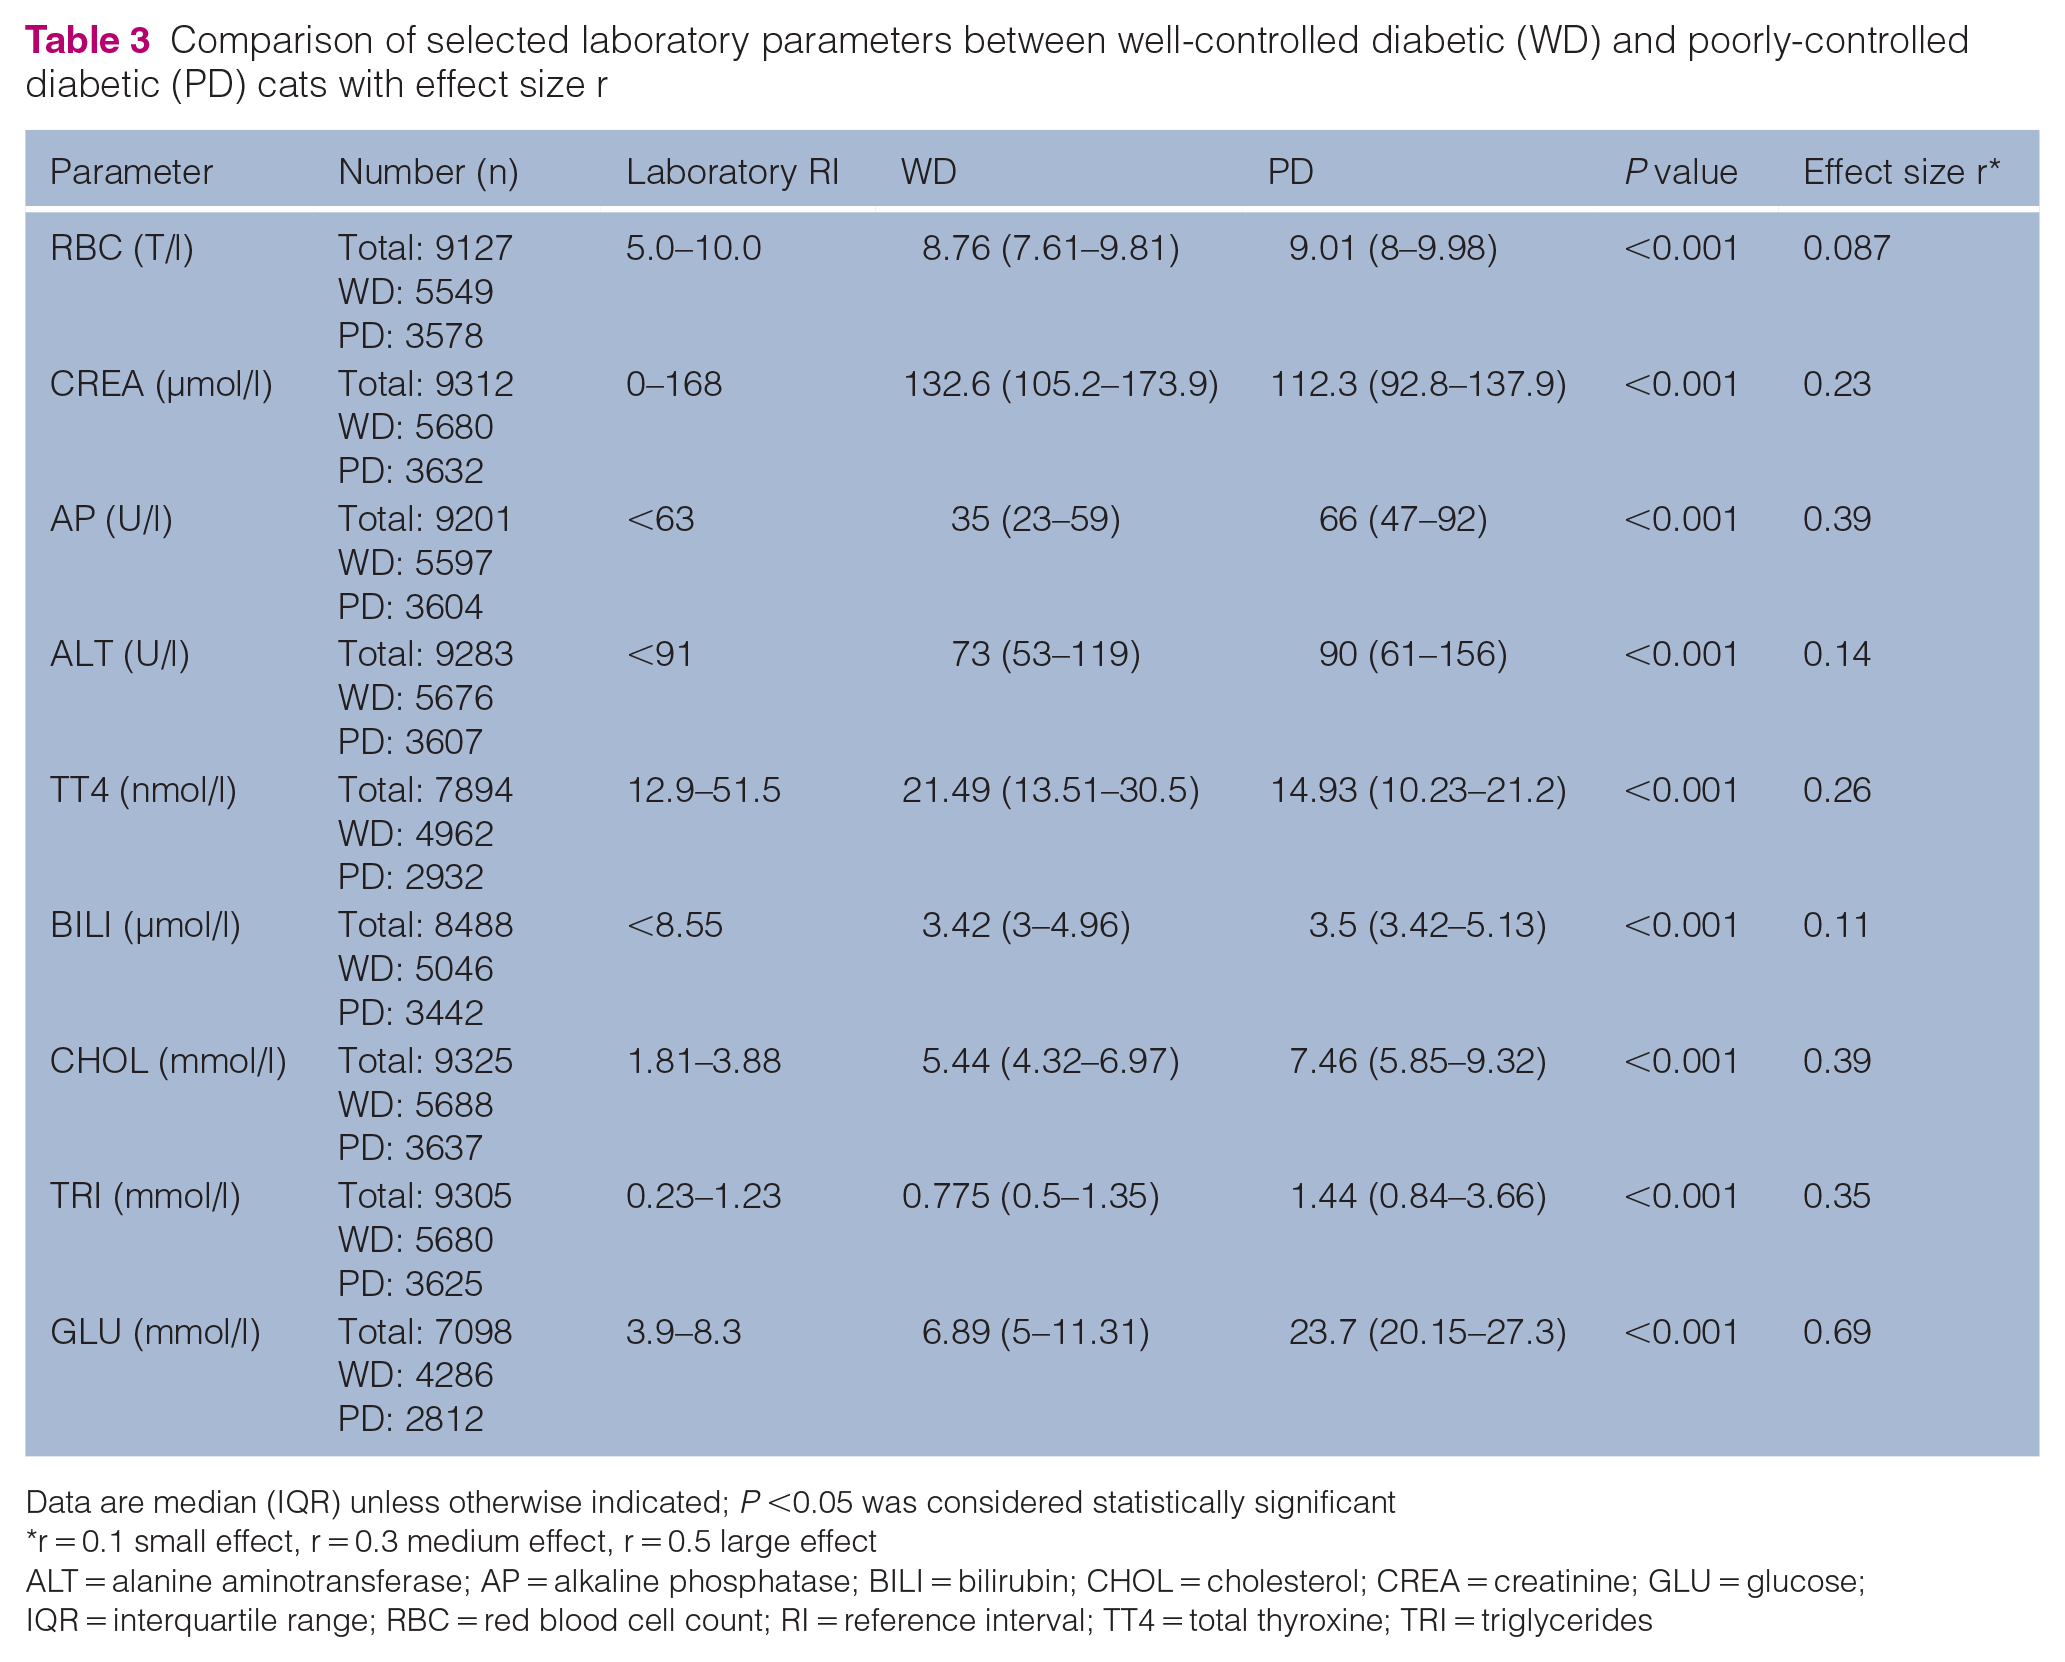
Data are median (IQR) unless otherwise indicated; P <0.05 was considered statistically significant
r = 0.1 small effect, r = 0.3 medium effect, r = 0.5 large effect
ALT = alanine aminotransferase; AP = alkaline phosphatase; BILI = bilirubin; CHOL = cholesterol; CREA = creatinine; GLU = glucose; IQR = interquartile range; RBC = red blood cell count; RI = reference interval; TT4 = total thyroxine; TRI = triglycerides
RBC, AP, ALT, BILI, CHOL, TRI and GLU were higher and CREA and TT4 were lower in PD compared with WD. Again, most medians lay within the RI, but CHOL in both groups and AP, TRI and GLU in PD were increased (ie, above the upper limit of the RI). Based on effect sizes, the difference in CREA, ALT, TT4 and BILI had a small effect, while the difference in AP, CHOL and TRI had a medium effect and the difference in GLU had a large effect. Based on the effect sizes and medians outside of the RI, the higher AP, CHOL, TRI and GLU in PD when compared with WD were considered the most relevant findings.
Frequencies of selected laboratory abnormalities between WD and PD
Frequencies of at least moderate anaemia, azotaemia indicating significant kidney disease (IRIS stage 3 or 4), significant increase in ALT and AP activities (at least five-fold), hyperbilirubinaemia associated with clinically detectable icterus and increased TT4 indicating uncontrolled hyperthyroidism in WD and PD are summarised in Table 4.
Frequencies of at least moderate anaemia, azotaemia, increase in liver enzyme activities, hyperbilirubinaemia, indicating clinically detectable icterus, and increased total thyroxine, indicating uncontrolled hyperthyroidism in well-controlled diabetic (WD) and poorly-controlled diabetic (PD) cats with effect size Cramér V
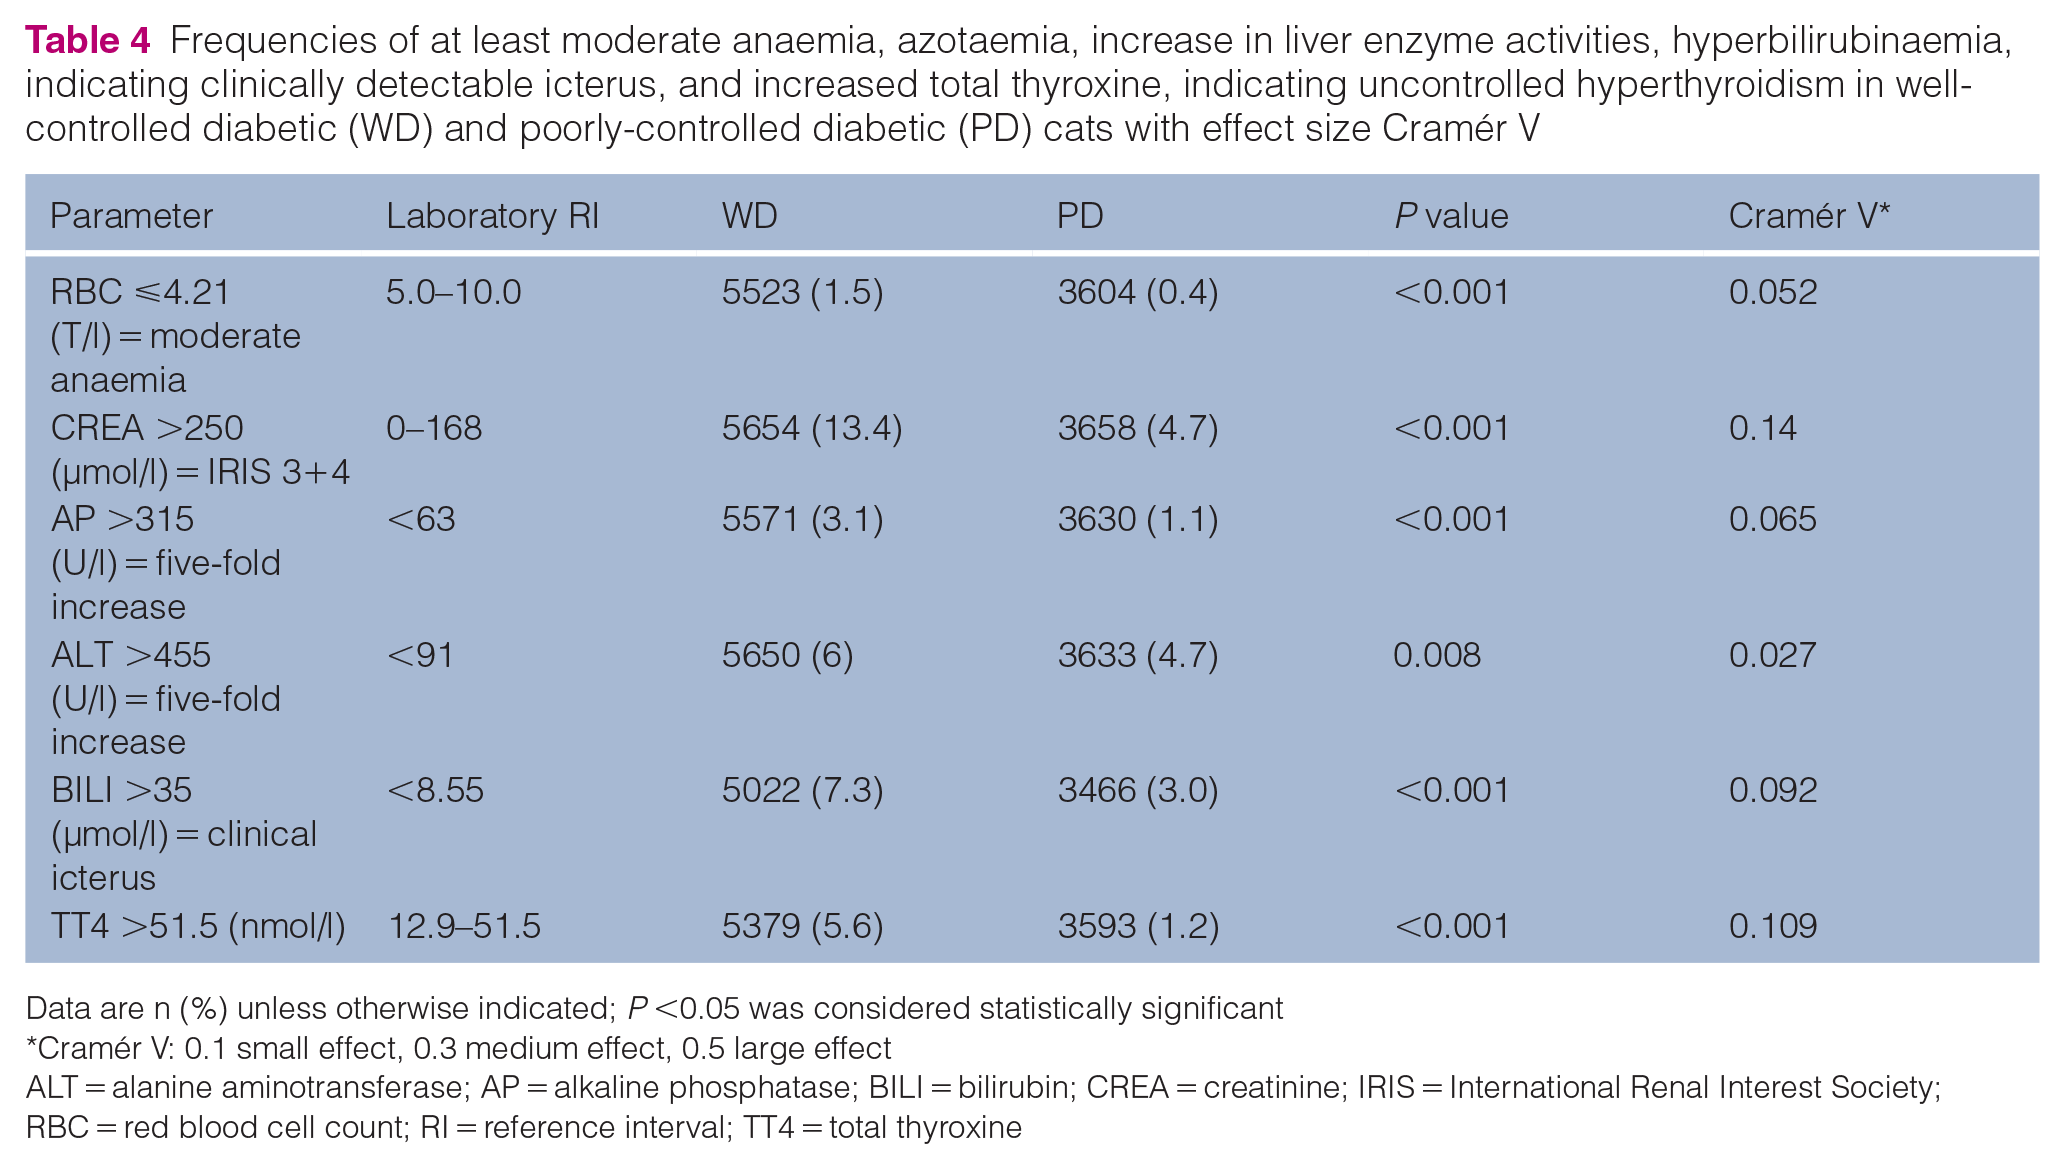
Data are n (%) unless otherwise indicated; P <0.05 was considered statistically significant
Cramér V: 0.1 small effect, 0.3 medium effect, 0.5 large effect
ALT = alanine aminotransferase; AP = alkaline phosphatase; BILI = bilirubin; CREA = creatinine; IRIS = International Renal Interest Society; RBC = red blood cell count; RI = reference interval; TT4 = total thyroxine
All abnormalities were more frequently present in WD; however, although significant differences were detected between WD and PD based on P<0.05, Cramér V indicated negligible relevance for all parameters but azotaemia and proportion of cats with increased TT4 (both small effect).
Discussion
In this large laboratory convenience sample in Germany, 7.2% of cats were diabetic. As this is the first large-scale study evaluating laboratory abnormalities in diabetic cats, this finding cannot be directly compared with other studies, interrogating different populations. Other investigators examined insurance records 1 and data from primary care practices, 2 large feline-only clinics 4 or veterinary teaching hospitals,3,5 where 0.08–1.24% of cats were diabetic. None of the studies perfectly represent the population of diabetic cats in a particular geographic region or country. However, nationwide registers of diabetic animals do not exist and therefore information is currently only available for those abovementioned subpopulations.
The median age of both diabetic and non-diabetic cats was 12 years, indicating that the results reflect a prevalence of DM within the older population rather than the general cat population in Germany. As age is a well-known risk factor for DM,2,4–8 a higher prevalence is expected in older cats. Although some blood samples might have been submitted for health checks, a recent study revealed that blood tests are not routinely performed as a part of preventive healthcare in German veterinary practices. 36 It is therefore likely that the majority of laboratory submissions are from sick animals. Older cats are more likely to suffer from diseases, explaining the higher age of population examined in the present study. The prevalence of DM might have been lower if younger cats were included; however, DM is a multifactorial disease potentially influenced by the presence of comorbidities 37 and can therefore occur at any age.
The median age of diabetic cats in this study population, 12 years, is comparable to previous reports and further supports increasing age as a risk factor.2,4–8 There were more males (5071, 59.4%) than females (3470, 40.6%) within the diabetic study population; however, based on Cramér V, this difference was of negligible effect size and therefore not relevant. This is in contrast to various previous reports, where male sex was identified as a risk factor for DM in cats.1,3,5,6,8–10 To the authors’ knowledge, Cramér V was not determined previously; however, in most reports, the percentages of male diabetic cats were in the range of 62.6–85%, considerably higher than in our study.1,3,5,10
Regarding the effect of neuter status on diabetes risk, contradictory information exists. While some studies found an increased risk of DM in neutered cats regardless of sex, 1 others did not. 5 In the present study, neutered cats were not significantly overrepresented among diabetics. Weight gain after neutering38–40 has been discussed as the reason for an increased risk of DM in neutered animals, with obesity being a well-known risk factor for DM.1–3,5,10 In a small experimental study, however, although neutered animals gained weight, this had minimal effects on the indices of glucose tolerance, 41 indicating that neutering alone might not substantially impact the risk of DM development. Indeed, multiple risk factors for DM in cats exist, including obesity2,5,6,10 and older age,5,6 as discussed above, as well as reduced physical activity/indoor confinement1,10 and in some studies also feeding dry food. 10 These factors likely interact; therefore, it is difficult to estimate the impact of a single variable such as sex on DM risk in an individual cat.
Another objective of this study was to describe clinicopathological abnormalities in diabetic cats and their association with poorly controlled DM. As expected, glucose concentration was higher in D cats when compared with ND cats, and in PD when compared with WD. Although significant differences between D and ND as well as between WD and PD were also detected for the remaining tested variables, few differences were considered relevant based on effect sizes and medians outside (above) the RI. PD cats had increased CHOL, TRI and AP, with medium effects sizes, indicating a relevant difference between PD and WD. Although the median for CHOL lay above RI in ND cats too, TRI and AP were not increased in this group. The reason for increased CHOL in ND cats cannot be established from a retrospective analysis of laboratory data, but the combination of increased CHOL, TRI and AP in PD cats could suggest the presence of hepatic lipidosis, 12 which has been described to occur in DM cats. 42 This combination of laboratory findings has been described in the literature to commonly occur in diabetic cats,9,11–14 but their association with poor diabetic control has not been reported; however, to the authors’ knowledge, this has not yet been specifically examined. On the other hand, no clinically relevant increase in bilirubin was detected in this study. Although hyperbilirubinaemia in addition to increased AP and/or ALT is a common finding in hepatic lipidosis, its absence does not exclude the disease. 42 Interestingly, in one study, diabetic cats with higher cholesterol were also less likely to develop diabetic remission, which fits with our findings of higher cholesterol in PD cats. 43
An interesting finding in this study was the increased frequency of azotaemia (creatinine >250 µmol/l, indicating IRIS stage 3 or higher) 26 in WD compared with PD cats. In humans, so-called diabetic nephropathy with proteinuria is one of the feared complications of DM.44,45 Currently, there is no evidence for diabetic nephropathy in cats, 46 and a clear link between DM and chronic kidney disease (CKD) could not be established in previous investigations.46,47 One study identified shorter survival in diabetic cats with higher creatinine concentrations at DM diagnosis. 48 In the present study using laboratory submissions, the time of DM diagnosis and survival was unknown and the reason for the higher proportion of cats with azotaemia in WD in comparison with PD could not be determined. Future studies are needed to assess this finding, ideally in a prospective manner.
Medians of TT4 were within the RI in both PD and WD cats, but 5.6% and 1.2% of cats with WD and PD, respectively, had TT4 above the RI, indicating uncontrolled hyperthyroidism. Other studies reported that approximately 4.5% of diabetic cats suffer from concurrent hyperthyroidism, 49 which is similar to this investigation. However, because of the study design (lack of clinical information), we were only able to detect cats with uncontrolled hyperthyroidism. Cats with hyperthyroidism controlled by antithyroid drugs or other treatment options could not be identified, likely underestimating the true prevalence of hyperthyroidism in this population of D cats based on laboratory submissions. The lower proportion of cats with uncontrolled hyperthyroidism among the PD cats might also be the result of the effect of non-thyroidal illness (ie, DM in this study). 50
The main limitation of this study is its retrospective character and the use of laboratory data with no clinical information available. The diagnosis of DM therefore relied on serum fructosamine alone, and this parameter can be falsely decreased in cats with hypoproteinaemia 51 or hyperthyroidism, 52 and can also be within RI in diabetic cats with tight glycaemic control. 37 In dogs, fructosamine concentration can be falsely increased in hypothyroidism, 53 but this condition is extremely rare in cats 54 and it is unlikely that it has had any meaningful impact on the results of the present study. Other conditions leading to falsely increased fructosamine concentrations have not been identified by a search of the literature. Given the large sample size in our study, the number of falsely classified cats is likely negligible. Unfortunately, as a result of the effect of stress, hyperglycaemia is not a reliable indicator of DM in cats, 55 and could not be used to identify diabetic cats misclassified by fructosamine.
A further limitation is that glycaemic control could only be assessed on the basis of fructosamine concentration. This would ideally be judged based on assessment of clinical signs;23,24 however this information was not available because of the study design. A single study using laboratory submissions to assess feline pancreatic lipase (fPLI) in diabetic cats also made use of fructosamine to assess the quality of glycaemic control. 56 Although that study attempted to obtain clinical information using questionnaires, such information could only be obtained in a proportion of cats. In the present study, information on clinical signs could not be acquired as anonymised data was provided by Antech Lab Germany, in alignment with data protection, therefore submitting veterinarian or cat owners could not be contacted. In addition, contacting over 100,000 veterinarians or owners would not have been possible and information collected retrospectively might not have been recalled correctly.
Another limitation is that it is not known whether cats were fasted before blood sampling and postprandial hyperlipidaemia might have affected the results. This might have contributed to hypercholesterolaemia detected in both D and ND cats; however, postprandial hypertriglyceridaemia would also be expected, 57 but was not present in this study, making the effect of feeding less likely. Furthermore, diseases other than DM might have impacted the observed laboratory changes (CHOL, TRI and AP). However, the diseases that might impact those parameters in cats are either rare (hypothyroidism, Cushing’s disease)57,58 or uncommon (cholangiohepatitis) 59 and therefore unlikely to have occurred at any higher frequency in the present study. The effect of hepatic lipidosis secondary to disease other than DM cannot be excluded.
In addition, given the cross-sectional study design and lack of clinical data, the effect of prerenal causes (ie, dehydration) on creatinine concentration cannot be ruled out, and the cut-offs were purely chosen based on their clinical utility and not to claim that the cats truly had IRIS 3 or 4 CKD. For staging, at least two creatinine values in a stable, well-hydrated patient would have been needed. 26
Conclusions
To the authors’ knowledge, the present study is the first large investigation of DM-associated laboratory changes in a large laboratory convenience sample. The age of German diabetic cats (median 12 years) in this study using laboratory submissions was similar to other previously reported populations, but male and neutered cats were not overrepresented. Similar to information provided in book chapters based mainly on experts’ opinions, clinicopathological abnormalities in diabetic cats identified in the present large-scale study were mild. The most relevant findings were hypercholesterolaemia, hypertriglyceridaemia and increased AP in PD cats, which could suggest the presence of hepatic lipidosis in this group. Laboratory reassessment might be indicated after the stabilisation of DM, because any clinicopathological changes were more common in poorly-controlled diabetic cats.
Footnotes
Acknowledgements
The authors would like to thank Hendrik Lehmann for help with data processing in Excel and Johannes Herrmann for statistical advice.
Author note
The study results were presented at the 31st Annual Meeting of the German Veterinary Association (DVG) ‘Internal Medicine and Clinical Laboratory Diagnostics (InnLab)’, 3–4 February 2023 in Göttingen, Germany.
Conflict of interest
The laboratory data used in this study was provided by Antech Lab Germany. Judith Langenstein is an employee of Antech Lab Germany.
Funding
The authors received no financial support for the research, authorship, and/or publication of this article.
Ethical approval
The work described in this manuscript involved the use of non-experimental (owned or unowned) animals. Established internationally recognised high standards (‘best practice’) of veterinary clinical care for the individual patient were always followed and/or this work involved the use of cadavers. Ethical approval from a committee was therefore not specifically required for publication in JFMS. Although not required, where ethical approval was still obtained, it is stated in the manuscript.
Informed consent
Informed consent (verbal or written) was obtained from the owner or legal custodian of all animal(s) described in this work (experimental or non-experimental animals, including cadavers) for all procedure(s) undertaken (prospective or retrospective studies). No animals or humans are identifiable within this publication, and therefore additional informed consent for publication was not required.