
Abstract
Objectives
The aim of this study was to evaluate performance of a feline-specific ELISA for the measurement of alpha-1-acid glycoprotein (AGP) and to establish a reference interval (RI).
Methods
Surplus serum samples with low (~200 µg/ml), medium (~450 µg/ml) and high (~745 and 930 µg/ml) AGP concentrations were used to assess the intra- and inter-assay coefficients of variation (CVs). The quality goal for bioanalytical method validation was a CV of <20%. Linearity was assessed by serial dilution of a sample with a high AGP concentration. Spike recovery was evaluated by mixing samples with low, medium and high AGP concentrations at different ratios. To establish the RI, residual serum samples from 51 healthy adult cats that were presented for health examinations or blood donation between August 2020 and June 2021 were included.
Results
The intra-assay CV was 8.5%, 4.3% and 4.0%, and the inter-assay CV was 18.8%, 15.5% and 11.5% for serum samples with low, medium and high AGP concentrations, respectively. Excellent linearity (R2 = 0.98) was demonstrated for AGP concentrations ranging between 251.6 and 954.4 µg/ml. Average recovery was 95.0–99.7%. The right-sided RI for AGP was 328 µg/ml (90% confidence interval 300–354). Age had a statistically significant impact (increasing values with older age, P = 0.0026), but sex did not (P = 0.44), on AGP concentrations.
Conclusions and relevance
The ELISA was accurate and showed acceptable precision with the modification of dilution used in this study. AGP concentrations in this population appeared to increase with increasing age.
Introduction
Acute-phase proteins (APPs) are highly sensitive biomarkers of inflammation, frequently used in both human and veterinary medicine to aid diagnosis and monitor various disease conditions.1 –5 In cats, alpha-1-acid glycoprotein (AGP) is one of the major APPs, along with serum amyloid A (SAA) and its concentration increases early in cats with inflammation, trauma, excessive stress, neoplasia or infectious diseases.1,6 Research concerning feline APPs has focused on infectious diseases, particularly feline infectious peritonitis (FIP), which, until recently, was considered to have an invariably fatal outcome, and might also be difficult to diagnose while the patient is still alive. It has been shown in several studies that a high AGP concentration might help in distinguishing FIP from other diseases with similar clinical presentations, or support the diagnosis of FIP.2,3,7 –9 Measurement of AGP concentrations in body cavity effusions is also useful in making a diagnosis of FIP and differentiating FIP from other diseases.9,10
Until a few years ago, a species-specific test for the measurement of feline AGP, based on single radial immunodiffusion (SRID), was commonly used and commercially available.2 –4,11 –14 Furthermore, an immunoturbidimetric assay run on automated laboratory analysers has been developed and validated for use in cats. 10 Unfortunately, the automated test is not commercially available and has only been used in one other study, 15 and the SRID test has been taken off the market.
Recently, a feline-specific ELISA-based test became available. However, to our knowledge, independent validation studies and reference intervals (RIs) have not yet been published in the peer-reviewed literature, making use of this assay in research and in clinical patients difficult.
The aim of our prospective study was threefold: (1) to evaluate the performance characteristics, including precision, linearity, recovery rate and lower limit of detection (LoD) of the feline AGP ELISA; (2) to provide RIs; and (3) to assess the impact of age and sex on the RI.
Materials and methods
Animals and samples
For this study, only surplus serum samples of client-owned cats presented to the Clinic for Small Animals, Justus-Liebig-University of Giessen, Germany, for health examinations, blood donation or diagnostic purposes between August 2020 and June 2021 were used. Owner consent was provided on admission; in addition, ethical approval for the use of residual blood was given by the regional authority (Regierungspräsidium Giessen, V 54–19 c20-15 [1] GI 18/17).
For assessment of the performance characteristics of the feline AGP ELISA, residual serum from one healthy cat, one cat with pyelonephritis and four cats with diabetic ketoacidosis was used. To establish the RI for feline AGP, surplus serum samples from 51 healthy cats were used. Cats were deemed healthy based on unremarkable histories and physical examinations, as well as unremarkable haematology and biochemistry results. Age was classified as young adult (1–6 years) and mature adult (7–10 years), according to the joint feline life stage guidelines of the American Association of Feline Practitioners and American Animal Hospital Association (AAFP–AAHA). 16 Only adult cats aged between 1 and 10 years were included in the study.
Venous blood was drawn into plain serum collection tubes (1.3 ml; Sarstedt) and sera separated by centrifugation at 1500 × g for 5 mins within 60 mins of collection. The samples were stored either at −20°C (if the analysis was to be performed within 3 weeks) or at −80°C if the storage time until analysis exceeded 3 weeks (median 7 months; range 3 weeks to 11 months). The good long-term stability of frozen APP samples has been shown previously.17,18 Where repeated measurement of AGP concentration was needed as a part of the assay performance assessment, serum was aliquoted before freezing to prevent variation owing to multiple freeze–thaw cycles.
AGP assay
A species-specific, commercially available immunometric ELISA (Cat Alpha-1-Acid Glycoprotein ELISA, AGP-8; Life Diagnostics) was used in this study. This assay uses affinity purified antibodies against feline AGP to bind AGP contained in a serum sample to the wall of a microtiter plate well. Horseradish peroxidase (HRP)-conjugated cat AGP antibodies and substrate 3,3’,5,5’-tetramethylbenzidine (TMB) are used to detect the bound AGP (Life Diagnostics package insert). 19
The assay was performed according to the manufacturer’s instructions (Life Diagnostics package insert), with some adjustments regarding the sample dilution (see the supplementary material for details on the sample dilution steps). Initially, AGP stock (Cat-a1-AGP lyophilised stock) provided with the kit was reconstituted using distilled water, and standards of AGP concentrations of 50, 25, 12.5, 6.25 and 3.13 ng/ml were prepared by two-fold serial dilution using the diluent provided with the kit. To determine the most appropriate dilution factor to enable measurement of AGP concentrations in patient/healthy cat samples, the samples were initially diluted by a factor of 10,000, as advised by the manufacturer. However, with a dilution factor of 10,000, optical density (OD) values of some samples were outside of the range of the calibration curve, indicating that a higher dilution factor was needed. Therefore, 16,000-, 32,000- and 64,000-fold dilutions were applied and the samples reanalysed. Based on this preliminary experiment, a 32,000-fold dilution seemed to be the most appropriate for patient/healthy cat samples and was used in all further experiments. Diluted samples were thoroughly mixed by vortexing and 100 µl of each diluted sample was transferred in duplicate into the wells of a 96-well ELISA plate coated with cat AGP antibodies. The plate was incubated for 45 mins at 150 rpm at 25°C on a microplate shaker (VWR) and then washed with the wash solution provided by the manufacturer using an automated plate washer (Hydroflex; Tecan). Afterward, 100 µl HRP-conjugated cat AGP antibodies were added into each well of the 96-well plate, incubated for another 45 mins on the plate shaker at 150 rpm at 25°C, and then washed using the automated plate washer to remove all unbound conjugate. Subsequently, 100 µl TMB was added into each well and incubated for 20 mins at 150 rpm at 25°C before applying 100 µl of the stop solution containing 1 N hydrochloric acid, causing a colour change from blue to yellow. Absorbance was measured within 5 mins at 450 nm using an automated plate reader (Sunrise; Tecan). The mean OD obtained from the five standards assessed in duplicates on each plate was used to establish a four-parameter logistic curve by the data analysis software integrated into the plate reader (Magellan; Tecan). Sample AGP concentration was derived from the calibration curve with the software, using the mean OD of duplicates and by multiplying the concentration by the dilution factor. Only reagents provided with the kit were used in all experiments, and all steps were performed by a single trained operator (principal author). All plates used in the study were of the same batch (identical lot number).
Assessment of the analytical performance
To evaluate assay precision, within-run (intra-assay) and between-run (inter-assay) variation was assessed. Intra-assay precision was determined by measuring AGP concentrations in three surplus serum samples with expected low, medium and high AGP concentrations 20 times within one analytical run. For the assessment of inter-assay precision, aliquots of the same samples with low and medium concentrations, and of a different sample with a high concentration, were analysed on 10 consecutive working days using 10 different ELISA plates. Plate-to-plate variability was evaluated by the assessment of repeatability of the standard curves on 10 different plates.
Owing to the lack of a gold standard, a reference or comparative method, or control material, the accuracy of the assay was indirectly evaluated by assessment of linearity under dilution and recovery studies. To assess linearity, a serum sample with a high AGP concentration (935.7 µg/ml) was serially diluted with the diluent buffer provided with the ELISA kit to achieve specimens with dilution factors of 1, 0.75, 0.5 and 0.25. Measurements were performed in triplicate. For recovery studies, four serum samples were used: one with a low (266 µg/ml), one with a medium (533.8 µg/ml) and two with a high (980.2 and 1025.9 µg/ml) concentration of AGP, respectively. The samples with a high concentration of AGP were mixed in ratios of 1:0, 3:1, 1:1, 1:3 and 0:1, with the low or medium concentration samples and measured in duplicate. The LoD was calculated from 20 replicate measurements of the ELISA diluent buffer.
Statistical analysis
All statistical analyses were performed with commercially available software packages (GraphPad Prism 6, MedCalc Version 20.019 and Microsoft Excel Version 16.631.1).
Analytical performance study and quality specifications
Performance goals were set according to the total allowable error (TE) guidelines of the American Society of Veterinary Clinical Pathology (ASVCP). 20 Although no final TE for AGP was proposed, recommendations for the analytical coefficient of variation (CV) and TE based on biological variation were provided in the ASVCP guidelines for dog AGP. For canine AGP, the minimal acceptable analytical CV (CVMin) was reported as 7.20%, and the desirable TE (TEdes) was 24.84%. 20 However, this is based on a different assay and not an ELISA, and is recommended for dog AGP (not cat). In the current study, the cut-offs rounded to one decimal place were used. In addition, the guideline on bioanalytical method validation of the European Medicines Agency (EMA) was used to assess acceptable performance (CV <20%). 21
For assay precision mean, SD and CV were calculated as follows in Microsoft Excel 2016:

To assess acceptable precision, the calculated CVs were compared with the previously set quality goals described above.20,21
Linearity under dilution was evaluated by computing the mean, SD and CV, and performing ordinary linear regression analysis to compare the observed and expected AGP concentrations. The percentage of recovery was calculated according to the following formula as a ratio of the observed (measured) and expected concentration:

Based on linearity and spike-recovery studies, the accuracy of the assay was considered acceptable if the percentage of recovery ranged between 80 and 120%.21,22 Furthermore, the bias (%) between the expected and measured mean AGP concentrations was calculated and compared with the quality goal TEdes of 24.8%. The calculated CVs were also compared with the previously set quality goals.20,21 The LoD was estimated as the mean of 20 replicate measurements of the diluent plus 2 SD. 23
Establishment of the RI
The concentration of AGP was measured in duplicate in surplus serum samples from 51 healthy cats presented for health checks or blood donations, to establish a population-based RI for AGP. To calculate the RI, the data were first assessed for normality by visual inspection of a histogram and by means of a Shapiro–Wilk test. 23 Owing to the normal distribution of the data, the right-sided 95% RI was calculated using a robust method, specifying the 90% confidence interval (CI), as recommended by the ASVCP and Clinical and Laboratory Standards Institute guidelines.24,25 To assess the impact of age on AGP concentrations, a weighted polynomial regression analysis was performed. An unpaired t-test was carried out to investigate the effect of sex on AGP concentrations. For all analyses, the level of significance was set at P <0.05.
Results
Assessment of the analytical performance
The intra-assay CVs were 8.5%, 4.3% and 4%, and the inter-assay CVs were 17%, 15.6% and 7.4% for serum samples with low, medium and high AGP concentrations, respectively (Table 1). The intra-assay CV for the sample with a low AGP concentrations and the inter-assay CV of all samples exceeded the pre-set performance goal of CVMin <7.2% but remained within the general recommendation by the EMA guidelines for a CV of <20%. The repeatability of the standard curve was excellent, with CVs of 2.2%, 3.3%, 3.7%, 4.8% and 14% for the standards of 50 ng/ml, 25 ng/ml, 12.5 ng/ml, 6.25 ng/ml and 3.12 ng/ml, respectively. Linearity under serial dilution of a serum sample with a high AGP concentration was demonstrated with a coefficient of determination (R2) of 0.98 (Figure 1). Based on the ratio of the measured and expected concentrations in the linearity study, recovery ranged from 96.2 to 107.6% (mean 101.6%; Table 2). Average recovery after mixing samples with low, medium and high AGP concentration was 95% and 99.7% for the two sample sets, respectively. All recoveries fulfilled the pre-set acceptability range of 80–120% and bias was below the TEdes of 24.8% (Table 3). The LoD was 2.55 ng/ml (0.00255 μg/ml).
Intra-assay precision of alpha-1-acid glycoprotein (AGP) determined with 20 consecutive measurements of feline serum samples with a low, medium and high AGP concentration, as well as inter-assay precision determined by measuring AGP in samples with low, medium and high AGP concentrations on 10 consecutive working days using 10 different ELISA plates

Coefficient of variation (CV) not fulfilling the quality specification CVMin <7.2% 20

Linearity under dilution of a serum sample with high alpha-1-acid glycoprotein (AGP) concentration measured in triplicate was demonstrated with a significant coefficient of determination (R2 = 0.98)
Linearity and recovery rates of a serially diluted serum sample with high alpha-1-acid glycoprotein (AGP) concentration, measured in triplicate
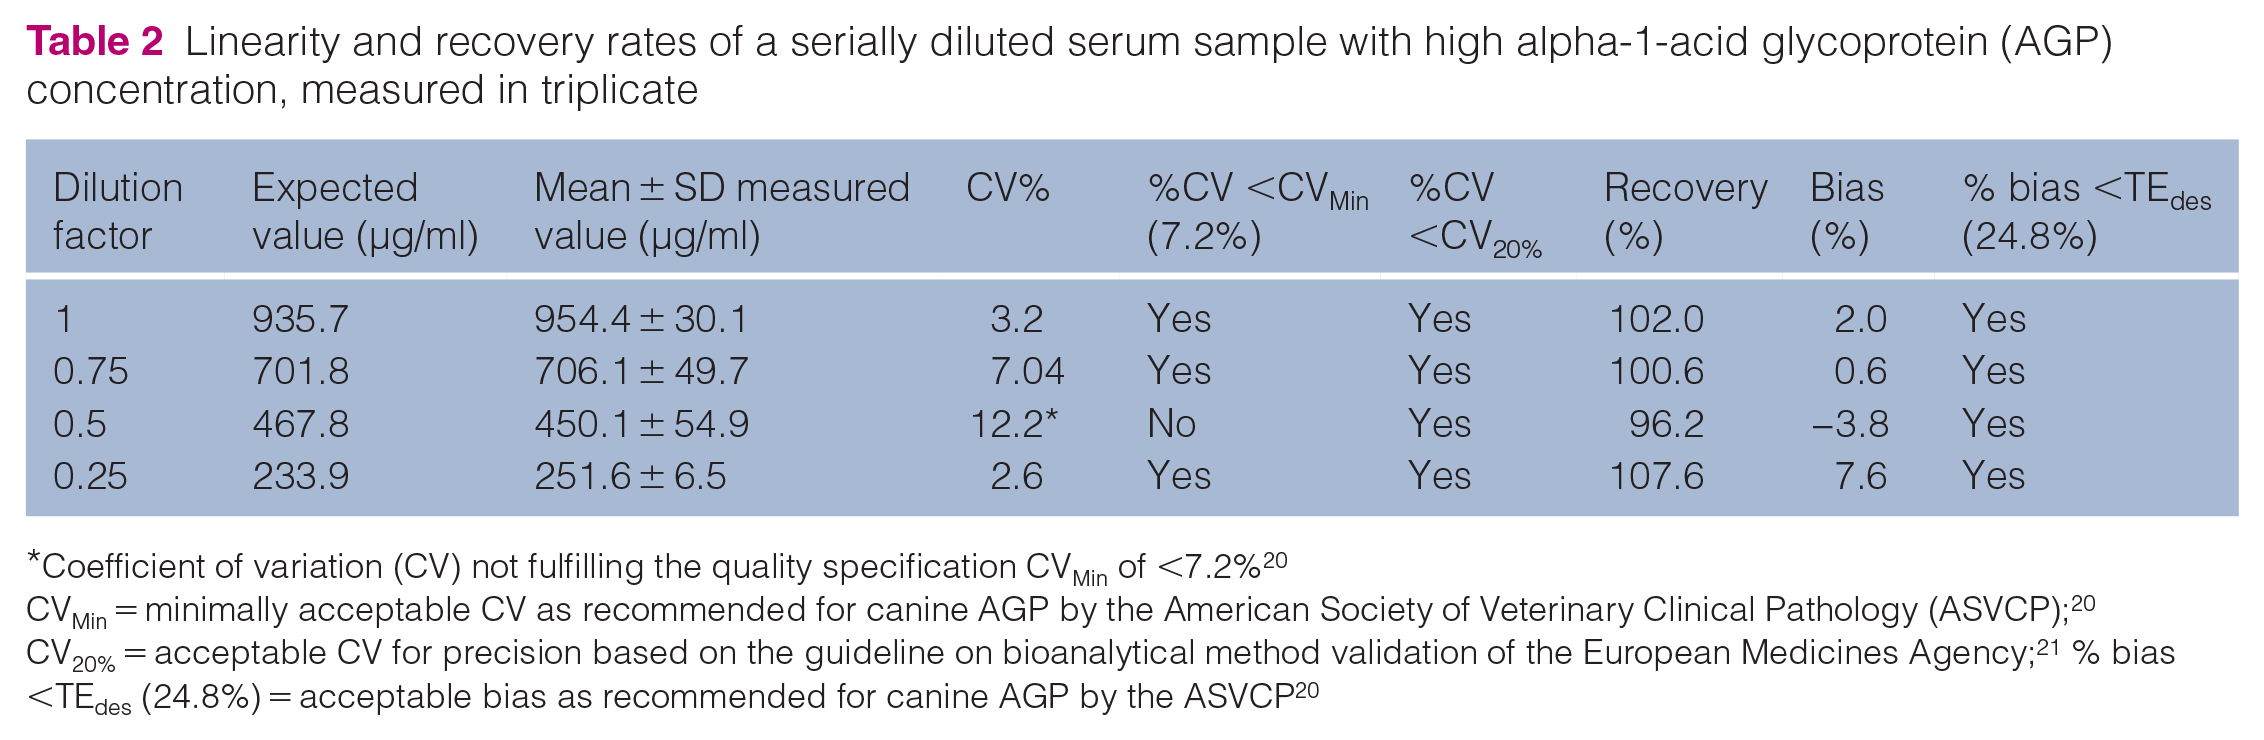
Coefficient of variation (CV) not fulfilling the quality specification CVMin of <7.2% 20
CVMin = minimally acceptable CV as recommended for canine AGP by the American Society of Veterinary Clinical Pathology (ASVCP); 20 CV20% = acceptable CV for precision based on the guideline on bioanalytical method validation of the European Medicines Agency; 21 % bias <TEdes (24.8%) = acceptable bias as recommended for canine AGP by the ASVCP 20
Recovery expressed as a percentage after mixing two sets of serum samples of high and low/medium alpha-1-acid glycoprotein (AGP) concentration at different ratios, measured in duplicate

Coefficient of variation (CV) not fulfilling the quality specification CVMin of <7.2% 20
CVMin = minimally acceptable CV as recommended for canine AGP by the American Society of Veterinary Clinical Pathology (ASVCP); 20 CV20% = acceptable CV for precision based on the guideline on bioanalytical method validation of the European Medicines Agency; 21 % bias <TEdes (24.8%) = acceptable bias as recommended for canine AGP by the ASVCP 20
Establishment of the RI
AGP concentrations of 51 healthy cats (29 neutered females and 22 neutered males) were used to establish the RI. Overall, 12 cats were young adult (1–6 years) and 39 were mature adult (7–10 years), according to the AAFP–AAHA guidelines. 16 Twenty-two cats were pedigree cats (10 British Shorthair, five Maine Coon, three Bengal, two Ragdoll, one Norwegian Forest Cat and one Siberian), 27 were domestic shorthair cats and two were mixed breed. The AGP concentrations of the 51 enrolled cats had normal distribution based on visual inspection of a histogram and Shapiro–Wilk test (P = 0.33; Figure 2). The right-sided RI was 328.2 µg/ml (90% CI 300.1–354.7). A significant age dependence of AGP concentrations (increasing values with older age) was seen in this study cohort via a scatter plot of the weighted polynomial regression analysis (P = 0.0026; Figure 3). There was no impact of sex on AGP concentrations (P = 0.44; Figure 4).

Histogram indicating normal distribution of alpha-1-acid glycoprotein (AGP) concentrations in 51 healthy cats used to establish reference interval for AGP
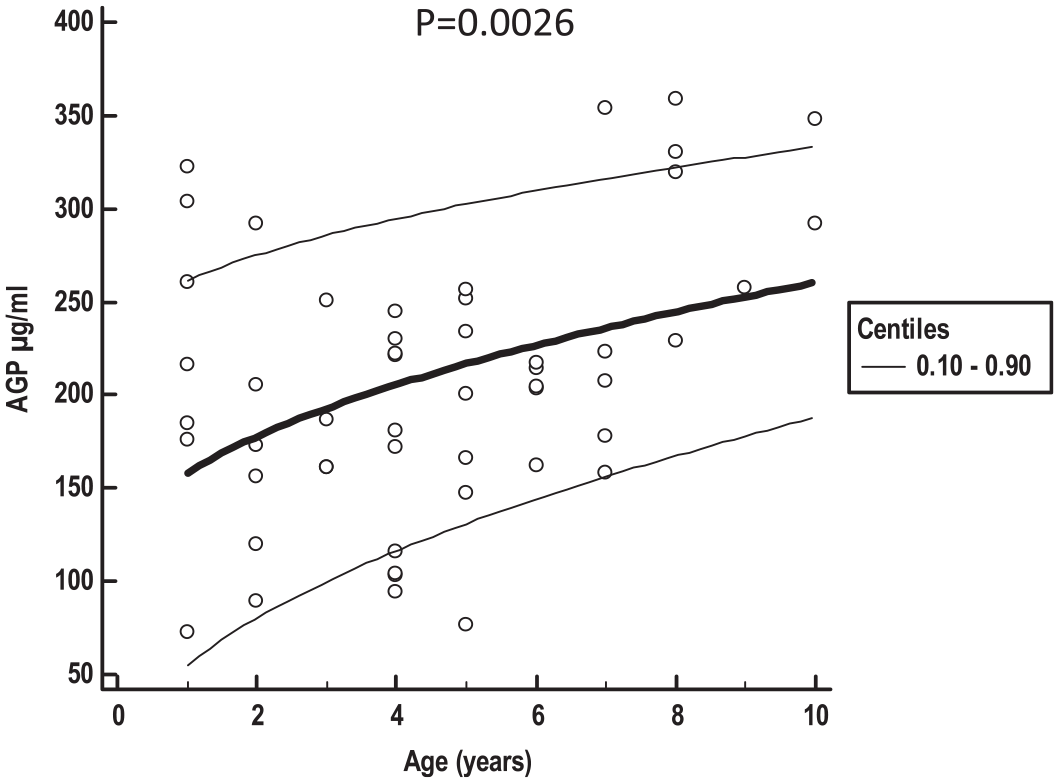
Scatter plot with calculated mean (central bold line) and 0.10–0.90 centile curves (thin lines) illustrates a significant age dependency of alpha-1-acid glycoprotein (AGP) concentration (concentrations increase with age)

Box-and-whisker plot illustrating no impact of sex on alpha-1-acid glycoprotein (AGP) concentration. The central line represents median, the box represents the 25th and 75th percentiles, and the whiskers the minimum and maximum
Discussion
Overall, the commercially available feline AGP ELISA showed acceptable analytical performance in terms of precision and accuracy. The within-run precision was excellent (CVs <5%) for samples with both medium and high AGP concentrations, fulfilling the strict ASVCP performance goal (CVMin 7.2%). 20 The within-run CV in the lower RI was 8.5% and therefore exceeded CVMin but was considered acceptable based on the EMA guidelines (CV <20%).20,21 A higher CV of the sample with a low AGP concentration could be caused by the high dilution factor (32,000-fold), which was needed to remain within the range of the calibration curve of the ELISA. However, in clinical settings, increased imprecision of measurement for samples with AGP concentrations in the lower RI is most likely not relevant and unlikely to lead to misdiagnosis. Between-run precision was higher than within-run precision but still fulfilled EMA requirements.20,21 It should be noted that the stricter CVmin criterion from the ASVCP guidelines was established based on a method other than ELISA, which is why the EMA guidelines on ELISA validation were additionally used for precision assessment.20,21 All ELISAs were performed over a period of 10 consecutive working days, and samples were stored as aliquots, making an effect of sample storage on CV less likely. Lower inter-assay repeatability owing to increased plate-to-plate variability could not be excluded with certainty, but seemed negligible based on the excellent repeatability of the calibration curve on each plate. The higher inter-assay CV vs the intra-assay CV could also have been caused by the daily requirement for the manual dilution of the aliquoted serum samples. Unfortunately, the effect of dilution can only be determined by future adjustment of the test by the manufacturer or by automation of the ELISA method. Further studies are needed to investigate this possible preanalytical error by preparing prediluted aliquots. The given performance criteria for linearity under serial dilution and spike recovery were fulfilled, demonstrating good assay accuracy21,22 when a sample dilution factor of 1:32,000 is used. While recovery tended to be increased for sample 1, it tended to decrease for sample 2. The most likely reason for the different behaviour of the recovery rates of samples 1 and 2 is the fact that no known amount of feline AGP was added to the initial sample, but the initial concentration was determined by ELISA measurement. Therefore, the measurement of the initial concentration is also subject to ELISA-induced imprecision and inaccuracy. Although the addition of defined amounts of the substance under investigation is the preferred method of a recovery study, this is not always possible due to the unavailability of the pure substance, which was the case in the present study. The SD found in the recovery study was highly variable, also due to the probable imprecision of the ELISA created by the high dilution factor. The LoD of 2.55 ng/ml (0.00255 μg/ml) was low enough to detect AGP in healthy animals, as seen in the RI study, thus indicating sufficient sensitivity for clinical use. A certain limitation of the study is that an interference study to further investigate systematic errors was not performed.
As AGP is a positive APP, only a right-sided RI was determined, which is not affected by higher imprecision in the lower concentration range. The calculated RI for AGP in our study (328 µg/ml, 90% CI 300–354) was lower than in most previously published studies, where AGP concentrations in healthy cats reached values >1000 µg/ml. However, comparison is problematic due to different measurement methods and study design. In the majority of previous studies, fewer than 40 healthy cats were included (Giordano et al: 3 mean ± SD 1200 ± 620 µg/ml; Correa et al: 11 median 220 µg/ml [range 100–440]; Kann et al: 12 median 515 µg/ml [range 195–1120]; Winkel et al: 26 median 270 µg/ml [range undetectable–536]), a number considered too low to calculate a RI. 24 Thus, mainly median (range) or mean ± SD have been reported previously. Only in one study using the SRID AGP assay was a RI of 100–480 µg/ml established in 40 healthy cats. 2 The upper reference limit obtained in that study was slightly higher than the RI established here. However, in the previous study, a two-sided RI was calculated using a non-parametric method that included the 2.5th and 97.5th percentiles. 2 When applying the same method to our data, a two-sided RI ranging between 74 and 437 µg/ml would have been obtained, which is comparable to the RI reported previously. 2 However, considering that AGP is a positive APP and that there are no known diseases leading to a decrease in AGP, we chose to calculate a right-sided RI.
In the current study, a significant increase in AGP concentration with increasing age was detected, but this age dependence might have been confounded by the small number of cats and inclusion of cats of different breeds, and therefore requires further validation. Also, the group size was too small to establish RIs specific to the respective age groups. Based on ASVCP guidelines, RIs can be established with as few as 20 cats. Our budget was sufficient for 51 cats, which is the reason for the sample size reported here. However, only the group of cats aged 7–10 years old (‘mature adult’) included >20 animals, which is why age group specific RIs could not be determined. Larger studies including higher numbers of cats per age group are needed to establish age group-specific RIs. An increase with age has already been described previously for feline SAA. 12 That study also described higher SAA values in females than in males. An effect of sex was not identified in our study, similarly to recently published data for SAA and AGP in hyperthyroid cats. 27
A major limitation of this study is the lack of a gold standard or reference method for measurement of feline AGP. Comparison with the previously used SRID assay would be desirable but could not be performed as this assay ceased to be produced some years ago. As no reference method is currently commercially available, at least one RI was established to make the test applicable in the clinic and is comparable to RIs obtained in other studies. Unfortunately, no specific recommendations exist for performance goals for feline AGP. Clinicians need to be aware that the same method should be used for serial monitoring in the future if other assays become available. Users should also be aware that owing to the need for sample dilution even at normal AGP concentrations, this ELISA is more cumbersome, and the high dilution increases assay imprecision, especially at low AGP concentrations. Furthermore, studies including diseased animals are needed to establish clinical decision limits.
Conclusions
Overall, the ELISA was accurate and acceptable when a sample dilution factor of 1:32,000 was used. However, between-run imprecision ranging from 11.5% to 18.8% should be kept in mind when using it for patient monitoring. Despite the manufacturer’s recommendation of a dilution factor of 1:10,000, an initial sample dilution factor of 1:32,000 is recommended by the authors, based on our results. The RI was defined for this assay, with the proposal to further establish age group-specific RIs.
Supplemental Material
Supplemental Material
Sample dilution
Footnotes
Acknowledgements
We would like to thank laboratory technician, Michaela Henkel, for her expertise and support in performing the ELISA measurement.
Supplementary material
The following file is available online:Sample dilution.
Conflict of interest
The authors declared no potential conflicts of interest with respect to the research, authorship, and/or publication of this article.
Funding
The authors received no financial support for the research, authorship, and/or publication of this article.
Ethical approval
The work described in this manuscript involved the use of non-experimental (owned or unowned) animals. Established internationally recognised high standards (‘best practice’) of veterinary clinical care for the individual patient were always followed and/or this work involved the use of cadavers. Ethical approval from a committee was therefore not specifically required for publication in JFMS. Although not required, where ethical approval was still obtained, it is stated in the manuscript.
Informed consent
Informed consent (verbal or written) was obtained from the owner or legal custodian of all animal(s) described in this work (experimental or non-experimental animals, including cadavers) for all procedure(s) undertaken (prospective or retrospective studies). No animals or people are identifiable within this publication, and therefore additional informed consent for publication was not prescribed.
References
Supplementary Material
Please find the following supplemental material available below.
For Open Access articles published under a Creative Commons License, all supplemental material carries the same license as the article it is associated with.
For non-Open Access articles published, all supplemental material carries a non-exclusive license, and permission requests for re-use of supplemental material or any part of supplemental material shall be sent directly to the copyright owner as specified in the copyright notice associated with the article.