
Abstract
Objectives
Hypertrophic cardiomyopathy (HCM) is the most common heart disease in cats. Electrocardiographic (ECG) analysis can help with the diagnosis of HCM and also in the investigation of the secondary consequences of the disease. This study investigated ECG markers of QT interval variability (total instability [TI], short-term instability [STI], long-term instability [LTI], QT variance [QTv]), mean QT interval (QTa) and QT interval corrected for heart rate (QTac), as well as the duration (QRSd) and dispersion (QRSv) of the QRS interval in healthy cats and in those with HCM.
Methods
Data were collected from 63 domestic cats: 40 in the control group and 23 in the HCM group. Fifty consecutive QT intervals were recorded for all cats and then QTa, QTac, QTv, TI, LTI and STI were calculated. QRSd and QRSv were also obtained for all animals. A Mann–Whitney U-test was used for group comparison. Receiver operating characteristic curves were plotted to evaluate the sensitivity and specificity of all markers for HCM. Logistic regression analysis was performed to assess the risks of cats having HCM, based on the studied indexes.
Results
QTa (P <0.01), QTac (P <0.01), QRSd (P <0.01) and STI (P = 0.02) were higher in the HCM group. QTa >158.8 ms, QTac >27.4 ms and QRSd >0.045 s had an accuracy of 77.4%, 68.2% and 80.9%, respectively, in detecting HCM. Logistic regression showed that cats with QTa >158 ms, QTac >27.4 ms and QRSd >0.045 s had a 1.58-, 1,23- and 6.5-fold higher risk, respectively, of developing HCM.
Conclusions and relevance
Cats with HCM had higher ventricular instability as assessed by STI and showed a prolongation of the QT and QRS intervals via the QTa, QTac and QRSd markers. These markers show potential as ancillary screening tools for identifying the presence of HCM.
Introduction
Hypertrophic cardiomyopathy (HCM) is the most common heart disease in cats, with a reported prevalence of up to 14.7%. 1 Several secondary consequences of HCM have been reported, such as congestive heart failure (CHF), arterial thromboembolism and sudden cardiac death (SCD).2,3 It is already known that electrical instability in CHF and SCD may be related to an increase in the dispersion of ventricular repolarization due to abnormalities in ion channels.4,5
Electrocardiography and Holter monitors have been used to investigate arrhythmias in cats with cardiac abnormalities.6,7 The dispersion of the QRS complex represents the difference in duration between the widest and narrowest complex between leads, and is considered to have potential value for diagnostic investigation of human patients with a range of clinical conditions, including cardiomyopathies. 8
Similarly, parameters that reflect ventricular repolarization have also been used as indicators of several cardiac diseases.9,10 For example, the QT interval is considered to be a risk indicator for the development of arrhythmias and SCD in humans.10–12 However, since this index can be influenced by depolarization disturbances, 13 the use of a novel marker called QT interval variability has been proposed. 14
This parameter can be used to assess ventricular repolarization by measuring the QT differences between cardiac cycles in the same lead, and has shown promising results. One study identified increased QT variability in human patients with ischemic and non-ischemic dilated cardiomyopathy 14 vs healthy individuals. In another study, high variability was shown to have an independent predictive value for mortality in people with heart failure. 15 Other indexes that can help investigate the variability between cardiac cycles have been proposed, such as total and short-term QT interval instability.16,17 In animals, our research group was the first to evaluate the QT variability in dogs with myxomatous mitral valve disease, finding that QT instability increases with disease progression and is associated with a higher risk of developing arrhythmias, and thus has potential as a prognostic marker. 18
To our knowledge, no studies have investigated these markers of depolarization and ventricular repolarization in cats. This study aimed to evaluate myocardial depolarization markers, linked to the QRS complex, and repolarization indicators, related to the QT interval, in both healthy cats and those with HCM. Moreover, we also sought to estimate the usefulness of these indexes to differentiate healthy cats from cats with an HCM phenotype. We hypothesized that cats with heart disease would have greater ventricular electrical instability, which may be identified by the parameters measured in this study.
Materials and methods
Animals
This was a retrospective study. The medical records of cats seen at a veterinary teaching hospital between November 2020 and November 2021 were analyzed. Domestic cats of any breed, sex, age and weight were selected. Cats with HCM diagnosed by echocardiography, with or without clinical manifestations, were placed in the HCM group; clinically healthy cats (ie, those without evidence of heart disease on echocardiography) were placed in the control group. Individuals with known systemic arterial hypertension, hyperthyroidism or poor-quality electrocardiographic (ECG) records (eg, multiple tracing artefacts) were excluded. Cats were not sedated for clinical, echocardiographic or ECG evaluation. All procedures were previously approved by the Ethics Committee on Animal Use (CEUA) of the respective university (protocol no. 028/2020).
Echocardiography
Echocardiographic examination was performed using a Philips Affiniti 50 ultrasound system (equipped with 4–12 MHz phased-array transducers; Phillips), following the recommendations previously described for cats. 19 Measurements of transmitral flow maximal velocity (E max), left atrium to aorta diameter ratio (LA:Ao) and shortening fraction (SF), as well as interventricular septal thickness (IVSd) and the internal diameter (LVEDd) and posterior wall thickness (LVFWd) of the left ventricle in diastole were obtained. E max was obtained by Doppler assessment in the left parasternal window using the apical four-chamber view. Left atrial and aortic root diameters were measured from the right parasternal window using short-axis images in the last frame before opening of the aortic valve. Left ventricular diameters in diastole and SF were also assessed by M-mode in short-axis views. IVSd and LVFWd were used to categorize cats into healthy (control) or disease (HCM) groups. Individuals with echocardiographic parameters within the reference intervals for the species were considered healthy. 20 For the HCM group, cats with an IVSd or LVFWd ⩾6 mm were included and categorized by disease stage (A, B1, B2, C or D) following the consensus recommendations for the diagnosis and classification of feline cardiomyopathies proposed by the American College of Veterinary Internal Medicine. 21
Electrocardiography
ECG recordings were acquired for 3–5 mins using digital equipment (TEB – ECG v. 3.2; Tecnologia Eletrônica Brasileira), with the animals positioned in right lateral decubitus and the electrodes attached to the limbs to obtain recordings from all six leads (I, II, III, aVR, aVL and aVF), according to Bailey’s system. 22 The conventional parameters were measured in lead II (heart rate [HR], P wave amplitude and duration, PQ interval duration, QRS interval amplitude and duration, and QT interval duration).
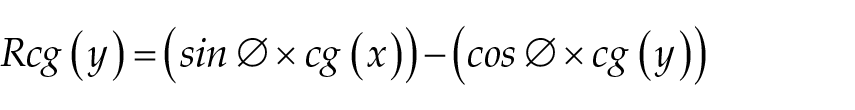
For each cat, assessment of ventricular repolarization markers was based on 50 consecutive QT intervals of sinus origin, measured in lead II, always starting from the second minute of ECG monitoring. After collecting 50 QT intervals, they were corrected for HR using the formula QTc = QT/(HR)1/3, proposed by Friedericia. 23 Then, the corrected and uncorrected QT intervals were used to calculate the mean QT interval (QTa) and corrected QT interval (QTac). The QT variance (QTv), total instability (TI), short-term instability (STI) and long-term instability (LTI) were calculated using the technique proposed by Van der Linde et al 16 from Poincaré graphs. The calculation of such indices was based on the following equations:


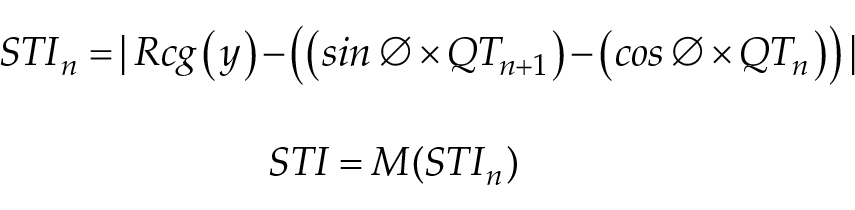
where M represents the median of the distance of the 50 points from the center of gravity of the data group; cg represents the center of gravity; Rcg represents the rotated center; and ∅ = 45°. These parameters had been previously obtained from the following equations:


Three consecutive electrical cycles were analyzed in lead II to evaluate the duration of the QRS complex (QRSd), defined as the time from the beginning of the Q wave to the end of the S wave. The QRS dispersion (QRSv) was defined as the difference between the largest and smallest QRS interval duration obtained from the recorded leads (I, II, III, aVR, aVL, aVF). All analyses were performed in triplicate, considering the arithmetic mean as the result.
Statistical analysis
Statistica software (Statistica Single User version 13.2; TIBCO Software) was used to analyze all data. First, the normality of data was checked using the Shapiro–Wilk test. The quantitative variables were submitted to a Mann–Whitney U-test to compare the control and HCM groups. The χ2 test was used to evaluate the presence of arrhythmias among the groups studied. Spearman’s test was used to evaluate the correlation between echocardiographic and general ECG data with the QTa, QTac, QTv, TI, LTI, STI, QRSd and QRSv indexes. For test interpretation, the degree of magnitude of correlation adopted was weak (r <0.3), moderate (r = 0.3–0.5), moderately strong (r = 0.6–0.8) and strong (r >0.8). Receiver operating characteristic (ROC) curves were constructed to investigate the sensitivity and specificity of the variables to differentiate cats with or without HCM. Uni- and multivariable logistic regression analyses were performed to evaluate the relationship of echocardiographic and electrocardiographic parameters with the risk of cats presenting with HCM. For the interobserver influence assessment, 20% of the cats in each group were randomly selected and all ECG parameters were re-evaluated by another observer without knowledge of the previous results; the Cronbach alpha coefficient was then calculated. For interpretation of the results, the following criteria were employed: α <0.5 (poor), 0.5> α <0.7 (acceptable), 0.7> α <0.9 (good) and α ⩾0.9 (excellent). The significance level adopted for all analyses was P <0.05.
Results
Sixty-three cats were evaluated and allocated to either the control group (n = 40) or the HCM group (n = 23). In the control group, most animals were female (67.5%), with a mean ± SD age of 9 ± 4.3 years and a mean ± SD weight of 4.1 ± 0.8 kg. In the HCM group, most animals were male (65.2%), with a mean ± SD age of 10 ± 4.2 years and a mean ± SD weight of 4.3 ± 1.4 kg. Most cats were crossbreeds (n = 48), but Persian (n = 8), Siamese (n = 4) and Sphynx (n = 3) cats were also included. Following the proposed staging for the HCM group, the animals were classified into stages B1 (n = 17), B2 (n = 5) and C (n = 1). None of the cats in the control group or those with HCM in stage B1 were receiving any medications; of those in stage B2, two were receiving thromboprophylactic therapy with clopidogrel; the cat in stage C was receiving clopidogrel, furosemide and pimobendan.
Cats in the HCM group had a statistically significantly higher R wave amplitude (P = 0.03), QRS interval duration (P <0.01) and QT interval duration (P <0.01) than healthy cats. The mean values for R wave amplitude and QRS and QT interval duration were 0.4 mV, 0.047 s and 0.174 s, respectively, for HCM-affected cats and 0.3 mV, 0.04 s and 0.154 s, respectively, for healthy individuals. Similarly, the echocardiographic parameters of IVSd (P <0.01), LVFWd (P <0.01), LA/Ao (P <0.01) and E max (P <0.01) were higher in the animals with HCM. The mean values for IVSd, LVFWd, LA/Ao and E max were 6.7 mm, 5.6 mm, 1.6 mm and 92.4 cm/s, respectively, for HCM-affected cats and 3.8 mm, 3.9 mm, 1.2 mm and 70.8 cm/s, respectively, for healthy individuals. All parameters derived from echocardiography and ECG are provided in Table 1.
Echocardiographic and electrocardiographic general measurements in healthy (control) cats and cats with hypertrophic cardiomyopathy (HCM)

Data are expressed as mean ± SD
Statistically significant
bpm = beats/min; IVSd = interventricular septum thickness in diastole; LVEDd = left ventricular internal end-diastolic diameter; LVFWd = left ventricle posterior wall thickness in diastole; SF = shortening fraction; LA:Ao = left atrium to aorta diameter ratio; E max = maximal early diastolic transmitral flow velocity
Sinus rhythm was the predominant rhythm in the control group (n = 38), with only two cats presenting with sinus tachycardia (HR >220 beats/min [bpm]). Some ECG abnormalities were observed in this group, namely leftward mid-axis shift (n = 1), right bundle branch block (n = 1) and left anterior fascicular block (n = 1). In the cats with HCM, sinus rhythm was also more frequent (n = 21), with only two patients presenting with sinus tachycardia (HR >220 bpm). Other changes in this group included right bundle branch block (n = 2), isolated premature ventricular complexes (n = 4) and left anterior fascicular block (n = 2), characterizing a higher number of ECG changes vs the control group (P = 0.018).
The results obtained from the ECG markers of ventricular conduction and repolarization evaluated in our study are shown in Figure 1. The values for the variables QTa (P <0.01), QTac (P <0.01), STI (P = 0.02) and QRSd (P <0.01) were statistically significantly higher in the HCM group compared with the control group. The mean values for QTa, QTac, STI and QRSd were 174 ms, 30.7 ms, 5.33 ms and 0.047 s, respectively, for HCM-affected cats and 154 ms, 26.3 ms, 3.96 ms and 0.04 s, respectively, for the control group. There was a moderate positive correlation between QRS complex duration and IVSd (r = 0.42) and LVFWd (r = 0.38); QTa had a moderate positive correlation with LVFWd (r = 0.38) and a weak correlation with LA:Ao (r = 0.27); QTac had a weak positive correlation with both LVFWd (r = 0.26) and LA/Ao (r = 0.24). The most significant correlations found were for QTv, which had a strong positive correlation with TI (r = 0.84) and a moderately strong correlation with LTI (r = 0.71) and STI (r = 0.70).

Boxplots showing the electrocardiographic variables of (a) duration and (b) dispersion of QRS interval, (c) QT interval average, (d) QT interval average (heart rate corrected), (e) QT interval variance and (f) total, (g) long-term and (h) short-term QT interval instability. *Statistically significant difference (P <0.05) between groups. HCM = hypertrophic cardiomyopathy
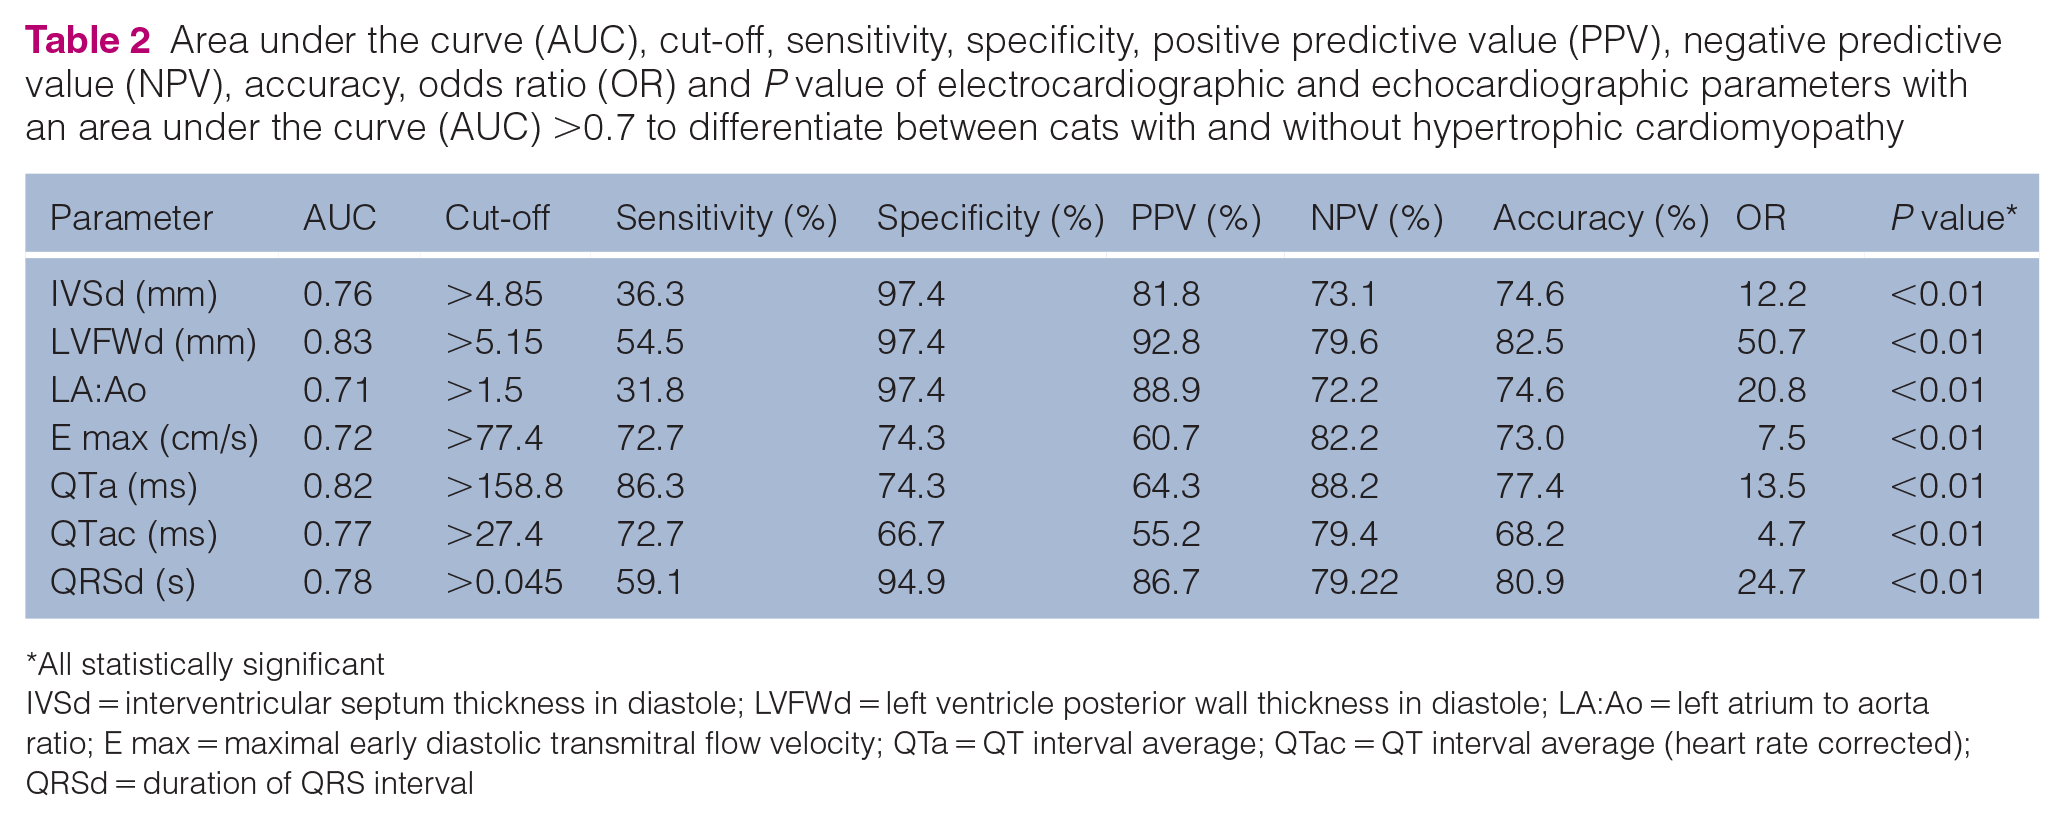
ROC curves were constructed to investigate the sensitivity and specificity of the variables to differentiate between cats with or without HCM. The area under the curve (AUC) for each of the echocardiographic variables with the best results was 0.71 (LA:Ao), 0.72 (E max), 0.76 (IVSd) and 0.83 (LVFWd); the AUCs of the ECG parameters were 0.82 (QTa), 0.77 (QTac), 0.63 (TI), 0.61 (LTI), 0.68 (STI), 0.78 (QRSd) and 0.63 (QRSv). The parameters with AUC >0.7, with their respective cut-off values, sensitivity, specificity, positive and negative predictive values, accuracy, odds ratio and P values, are provided in Table 2.
Area under the curve (AUC), cut-off, sensitivity, specificity, positive predictive value (PPV), negative predictive value (NPV), accuracy, odds ratio (OR) and P value of electrocardiographic and echocardiographic parameters with an area under the curve (AUC) >0.7 to differentiate between cats with and without hypertrophic cardiomyopathy
All statistically significant
IVSd = interventricular septum thickness in diastole; LVFWd = left ventricle posterior wall thickness in diastole; LA:Ao = left atrium to aorta ratio; E max = maximal early diastolic transmitral flow velocity; QTa = QT interval average; QTac = QT interval average (heart rate corrected); QRSd = duration of QRS interval
The significant results of the univariable analysis of echocardiographic and ECG parameters are provided in Table 3. There were statistically significant values only for QTa, QTac and QRSd. The multivariable analysis did not provide significant results for the target ECG variables.
Results of the univariate logistic regression analysis showing the associations between electrocardiographic and echocardiographic parameters and the risk of a cat having hypertrophic cardiomyopathy

All statistically significant
IVSd = interventricular septum thickness in diastole; LVFWd = left ventricle posterior wall thickness in diastole; LA:Ao = left atrium to aorta diameter ratio; E max = maximal early diastolic transmitral flow velocity; QTa = QT interval average; QTac = QT interval average (heart rate corrected); QRSd = duration of QRS interval
The result of the Cronbach alpha coefficient, used to assess the reliability and repeatability of measurements between two different observers, showed that all ECG indices measured in this study had score coefficients considered to be good (0.7–0.9) or excellent (>0.9), confirming that they are reproducible measures with little inter-observer variability. The coefficient values of all parameters measured were 0.9 (QRSd), 0.92 (QRSv), 0.81 (QTa), 0.85 (QTac), 0.8 (QTv), 0.91 (TI), 0.83 (LTI) and 0.79 (STI).
Discussion
In this study, we sought to evaluate ventricular conduction and repolarization indicators and electrical instability markers obtained by ECG examination in healthy cats and cats with HCM. The aim was to identify factors that contribute to the diagnosis and prognostic stratification of cardiac patients. The abnormalities identified via conventional ECG parameters, such as the QRS prolongation and increased R wave amplitude, found in this study have been previously reported in cats with ventricular hypertrophy, with a previous study showing these findings in 24.6% of 61 cats with HCM. 24
As previously mentioned, QRSv has been used to evaluate human patients with several conditions, including cardiomyopathies, 8 and a potential predictive value for cardiac death has been reported in humans. 25 No statistically significant difference in this marker was found between the groups in our study. Interestingly, one study that enrolled people with HCM found an increased QRSv in the affected group only when 12-lead recordings were made. 26 In our study, we assessed only the limb leads, which may have compromised the results since the QRS interval duration is subject to alteration, being longer in the precordial leads.27,28
The values for QTa and QTac were higher in cats with HCM, which has been previously reported in cats with left ventricular hypertrophy, 7 and also in humans with HCM, 29 who share relevant similarities in the manifestations of this disease. 30 As previously discussed, the QT interval variability evaluated in consecutive cardiac cycles in the same lead reflects the instability of ventricular repolarization, allowing not only determination of the presence of instability but also its quantification. In the present study, only STI showed a statistically significant difference between the groups.
It is known that humans with HCM have increased QT interval variability. 31 Furthermore, a significant increase in short-term variability has also been observed and was positively correlated with the degree of ventricular hypertrophy. 32 The authors of that study speculated that the assessment of short-term QT interval variability allows the identification of the impairment in reserve and temporal instability of repolarization in humans. 32 It has been reported that HCM causes a decrease in repolarization capacity in people, leading to marked impairment in repolarization reserve and increasing susceptibility to arrhythmias. 33 The reason for the increase in QT interval variability in these patients is not yet fully understood, and it is unlikely that a single parameter can be used to detect hemodynamic, electrophysiological, anatomic and functional changes that may play a role in these changes.
Some authors who have evaluated humans with left ventricular hypertrophy have suggested that patients had an abnormal response to autonomic changes mediated by altered function of beta-adrenergic receptors in hypertrophied ventricles.34–36 Another plausible explanation would be that myocyte hypertrophy, combined with an increase in the interstitial collagen matrix, is linked to an increase in action potential duration and a reduction in its amplitude.37–39 Authors have inferred that alterations involving sodium currents are related to repolarization changes in dogs with heart failure. 40 The same elements of electrical remodeling have also been noted in people with HCM, although, in that study, the subjects did not have heart failure. 41 All the previously mentioned histological and action potential alterations may be related to the QT interval prolongation and variability reported in our study.
Although one study has shown a correlation of STI with left ventricular hypertrophy in humans, 32 this is in contrast to our results. However, other authors that evaluated ECG parameters in humans with HCM showed no correlation of any parameters with myocardial thickness, suggesting that factors not yet fully identified may contribute to the appearance of cardiac electrical changes. 41 Some of these factors may be related to genetic manifestations, since investigations have indicated that mutations in HCM genes in people might be directly involved in this process; changes in the temporal dynamics of repolarization have been documented in these individuals.42–44 An increase in the short-term variability of the QT interval has also been described in human congenital long QT interval syndrome, showing that this change does not occur only in structural heart diseases and may have considerable genetic influence. 45 Genetic similarities have been described between HCM in human patients and in cats, in particular with regard to myosin-binding genes (MYBPC3), 46 encouraging further studies to investigate the relationship between these changes in cats with HCM.
ROC curves were constructed to assess the sensitivity and specificity of the markers for differentiating between cats with and without HCM. The ECG markers reported in our study show similar results when compared to echocardiographic parameters commonly used as diagnostic criteria for HCM (Table 2). The QTa in our study had a sensitivity of 86.3% and specificity of 74.3% in identifying cats with HCM. These results are similar to those reported in a previous study that evaluated feline patients with left ventricular hypertrophy. 7 Additionally, univariable logistic regression analysis in our study showed that QTa, QTac and QRSd markers could be helpful as an auxiliary measurement for identifying the risk of individuals having heart disease (Table 3). Our inter-observer analysis showed that all measures had good reliability and repeatability, suggesting that these indexes can be included in clinical practice.
Finally, it was not possible to identify the relationship between increased STI and arrhythmic events in cats with heart disease. However, previous reports have demonstrated this relationship in human patients and dogs, with predictive and prognostic values.18,32 Further studies of this index in cats with HCM are indicated to investigate the relationship of QT interval variability with arrhythmic events in this species. This study has a number of limitations, including the small number of cats with HCM and the unequal distribution of the HCM stages. The retrospective nature of the study, the absence of data on blood gas and electrolytes analysis, the failure to identify of all causes of ventricular hypertrophy and the lack of ECG records with the precordial leads could have impaired our analysis and results.
Conclusions
Cats with HCM showed QT interval prolongation and instability in electrical activity evaluated via QTa, QTac, QRSd and STI markers. These indexes show potential usefulness as ancillary screening tools for investigating cats with an HCM phenotype. Further studies are required to increase understanding of the relationship of these indexes with disease progression and the development of CHF and arrhythmias, with the aim of identifying possible prognostic values as identified in other species.
Footnotes
Conflict of interest
The authors declared no potential conflicts of interest with respect to the research, authorship, and/or publication of this article.
Funding
The authors are grateful for the financial support provided by Coordenação de Aperfeiçoamento Pessoal de Nível Superior (CAPES) and Conselho Nacional de Desenvolvimento Científico e Tecnológico (CNPq).
Ethical approval
The work described in this manuscript involved the use of non-experimental (owned or unowned) animals and procedures that differed from established internationally recognised high standards (‘best practice’) of veterinary clinical care for the individual patient. The study therefore had prior ethical approval from an established (or ad hoc) committee as stated in the manuscript.
Informed consent
Informed consent (verbal or written) was obtained from the owner or legal custodian of all animal(s) described in this work (experimental or non-experimental animals, including cadavers) for all procedure(s) undertaken (prospective or retrospective studies). No animals or people are identifiable within this publication, and therefore additional informed consent for publication was not required.