
Abstract
This report describes a simple, non-invasive electronic device that employs a compact accelerometer integrated circuit to transduce movements in the chest wall of an anaesthetized animal into an analogue signal that can be used to calculate the rate and relative depth of respiration. The device requires amplification by signal processing hardware/software which are common to most experimental laboratories. We assessed the sensitivity of the device by its ability to detect changes in respiratory patterns produced by modulating the depth of anaesthesia in isoflurane-anaesthetized Wistar rats. It is widely accepted that many anaesthetic agents affect respiratory patterns, especially respiratory rate (RR), which is often used as an important index of anaesthetic depth. Respiratory parameters obtained with the device were compared with concurrently recorded electroencephalographic and cardiac measures. Different concentrations of anaesthetic agent produced four depths of anaesthesia, identified using established electroencephalographic criteria. The accelerometer was attached easily and securely to the location of maximal chest wall movement and produced a strong respiratory signal that was detectable in all four anaesthetic stages. Deepening the anaesthesia produced a gradual decrease in RR, a decrease in dominant spectral frequency of the electroencephalogram (EEG) but no change in the heart rate. There was a significant correlation between RR and the dominant spectral frequency of the EEG, indicating that one useful application of the monitor could be to identify anaesthetic stages. The results demonstrate that respiratory parameters can be recorded using a simply constructed, low-cost device and suggest an application in the monitoring of anaesthetic depth.
Over one-third of the three million animal experiments that take place annually in the UK involve some form of anaesthesia (UK Home Office Statistics, 2006). Unless appropriately monitored, there is always a risk that the depth of general anaesthesia may drift to unacceptable limits at both ends of the spectrum, leading to excessive depression of physiological parameters if the animal becomes too deep, and the potential for awareness if the animal becomes too light. Veterinary surgeons and scientists alike never cease in their efforts to improve anaesthesia protocols and pain management in such procedures and, currently, there is much information available to enable stable and appropriate anaesthesia, provided the animal is carefully monitored. 1 Of the various physiological measures that can be recorded from a subject, brain activity, respiration and cardiac function are among the most informative in the assessment of physiological stability and anaesthetic depth. 2–4
Our laboratory required a monitoring device that would provide a continuous measurement of physiological stability as well as an index of anaesthetic depth. Although brain activity is considered to provide one of the best indices of anaesthetic depth and can be measured using an electroencephalogram (EEG), this necessitates the invasive implantation of electrodes in the majority of commonly used laboratory animal species, largely restricting its use to surgical procedures in which the cranium is already exposed and only enabling recordings some time into the surgical procedure. Various parameters of cardiac function, such as blood pressure and heart rate (HR), are occasionally used to monitor anaesthetic depth, yet tend to be more helpful in the assessment of anaesthetic stability rather than depth, with poor correspondence exhibited between cardiac parameters and anaesthetic plane. 5,6 Respiration, on the other hand, is already widely used in veterinary practice to provide an indication of physiological stability during procedures performed under anaesthesia and has proven to be a very reliable index of anaesthetic depth in animals. 7
Three respiratory parameters can be observed: rate, depth and pattern. 1 Of these, respiratory rate (RR) is the easiest to record and interpret. Although several different methods of RR monitoring are available, some have financial drawbacks and not all are appropriate to a wide range of surgical settings and animal species. 4 Monitoring methods include: (1) direct observation by personnel; (2) capnography; (3) thermal recording of expiration; or (4) a chest wall movement sensor. Direct observation is not precise and is not always practicable, for example where the animal is covered by surgical drapes, or experimental techniques restrict access/vision (such as optical imaging that requires dark conditions). Capnography is primarily used to measure expired carbon dioxide and thus gives an indication of the function of the respiratory system in terms of gas exchange. It can also be used to measure RR (though not respiratory depth [RD]) but is relatively expensive (the cheapest units currently available in the UK are ∼£1500 [£1 = approx. US$1.47, €1.17 on 3 December 2008]) and is only accurate when the animal is intubated. Furthermore, many capnographs have sampling rates that are too high for smaller patients, such as rats, and must be used in open circuits to avoid creating a negative pressure that would impede respiratory function. The disadvantage of the open-circuit design is that expiratory samples are diluted by the ambient air. Thermistors can be used to sense temperature changes due to expiration but are not always sensitive enough to be reliable in animals of all sizes and can have high resistance when placed ‘in-circuit’. Chest wall movement sensors that are currently available suffer a similar problem by only being reliable when used with large animals that have relatively high forces of expiration. Consequently, there is a requirement for a simple, non-invasive device that is compact enough to preclude obstructions to ongoing surgical procedures and provides reliable, realtime information regarding respiratory parameters and, potentially, anaesthetic depth from a range of species. For reasons outlined above, we suggest that such a device should utilize signals from the respiratory system.
This article describes and evaluates such a respiratory monitoring device that uses an accelerometer-integrated circuit (IC) to transduce chest wall movement into RR and RD. Accelerometers are micro-electro-mechanical devices that measure acceleration forces and have recently been incorporated into more elaborate behavioural and physiological monitoring equipment for human use. 8 Raw respiratory signals from anaesthetized rats were visually inspected to ensure sufficiently high signal-to-noise ratio could be obtained that would enable RR and RD measurements to be obtained. Then, in order to confirm reliable performance of the device, as well as success in the identification of anaesthetic depths, respiratory parameters at multiple levels of anaesthesia were compared with HR, via electrocardiogram (ECG) recordings, as well as to EEG.
Animals, materials and methods
Respiratory monitor design
The respiratory monitor was designed with the following requirements in mind: to be cost-effective, compact, portable and have minimal contact with the animal. Using an accelerometer as the primary sensor was the most prudent design choice as they are now available in very small sizes (e.g. currently ∼3 mm2) enabling attachment to an animal of almost any size with relative ease. The accelerometer also requires low power that negates the need for a large, heavy power supply that allows portability and removes a potential source of electrical noise for scientific experiments. The device consumes approximately 320 µA, giving long battery life. A relatively small (4 × 4 × 1.45 mm) three-axis accelerometer was chosen (ADXL330KCPZ, Analog Devices, Norwood, MA, USA) but only the z-axis was used (Figure 1). The accelerometer operated via two 1.5 V, type C batteries that were housed, together with the associated circuitry, in a compact metal casing (Figure 2). This was connected to the accelerometer by 30 cm of light, flexible, single core wire wrap wire (Farnell, Leeds, UK). The signal output, which for most species will be within several hundred millivolts, is via a Bayonet Neill-Concelman (BNC) connector, which can be connected to any commonly available analog-to-digital converter unit and displayed through signal processing software (such as the open-source software WinWCP, available from the University of Strathclyde, UK).
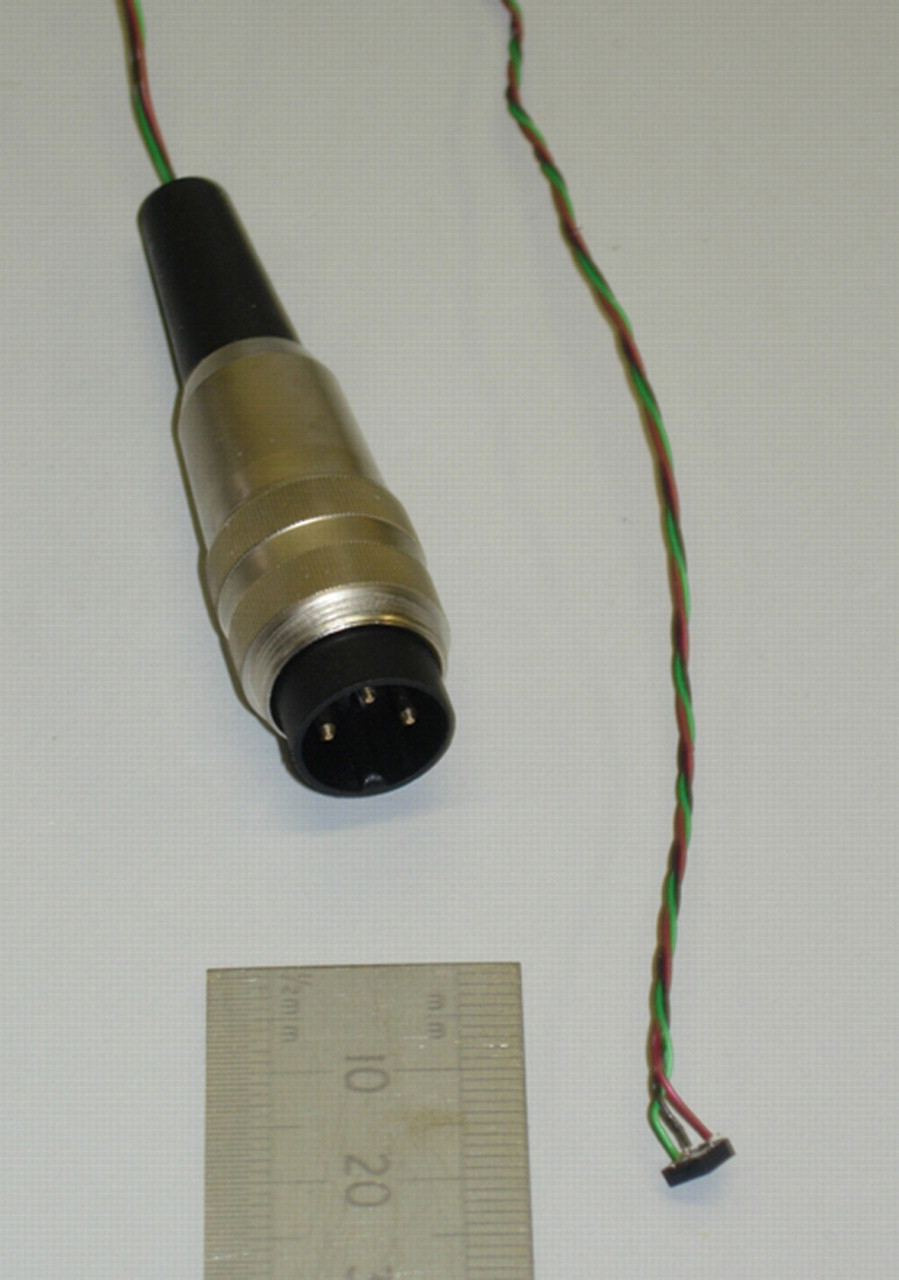
Accelerometer IC and three-pin connector plug
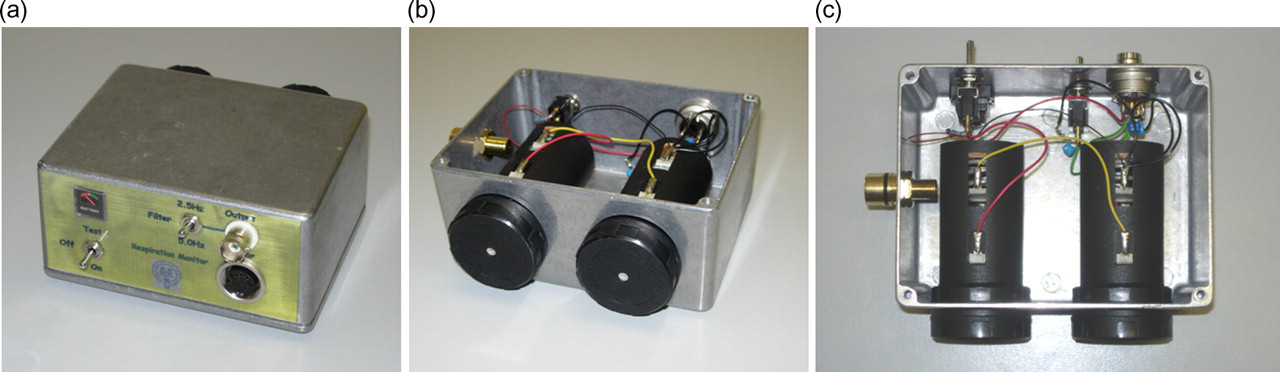
Respiratory monitor casing. (a) Front view, to show accelerometer socket connector, BNC output, filter switch, on/off switch and battery-power indicator. (b) Rear view with underside casing removed to show internal layout. (c) Close-up view of internal circuitry
Respiratory monitor assembly
The circuit diagram of the respiratory monitor is shown in Figure 3 and all components are identified in Table 1; all the accelerometer functions are carried out in the ADXL330 IC. The circuit requires no printed circuit board (Figure 2c) and all aspects of circuit construction are straightforward except cable attachment to the accelerometer IC. Due to the small size of IC contacts, this should be performed under a microscope. The casing (approx. size 8.5 × 11 × 5.5 cm; W × L × H) contains batteries to power the accelerometer, a battery-power indicator and a simple low-pass filter (2.5 or 5 Hz) to remove the high-frequency switching noise generated inside the IC. The low-pass filter should be set according to the anticipated RR of the species (e.g. 5 Hz for small rodents such as mice and hamsters). We chose a heavy-duty metal casing but other, cheaper, alternatives are available. Despite the unit being relatively light (460 g), the use of a plastic casing would reduce this weight further. A full list of the components that are required are listed in Table 1. The full cost of all components used in the construction of the device was approx. £75 (December 2008).
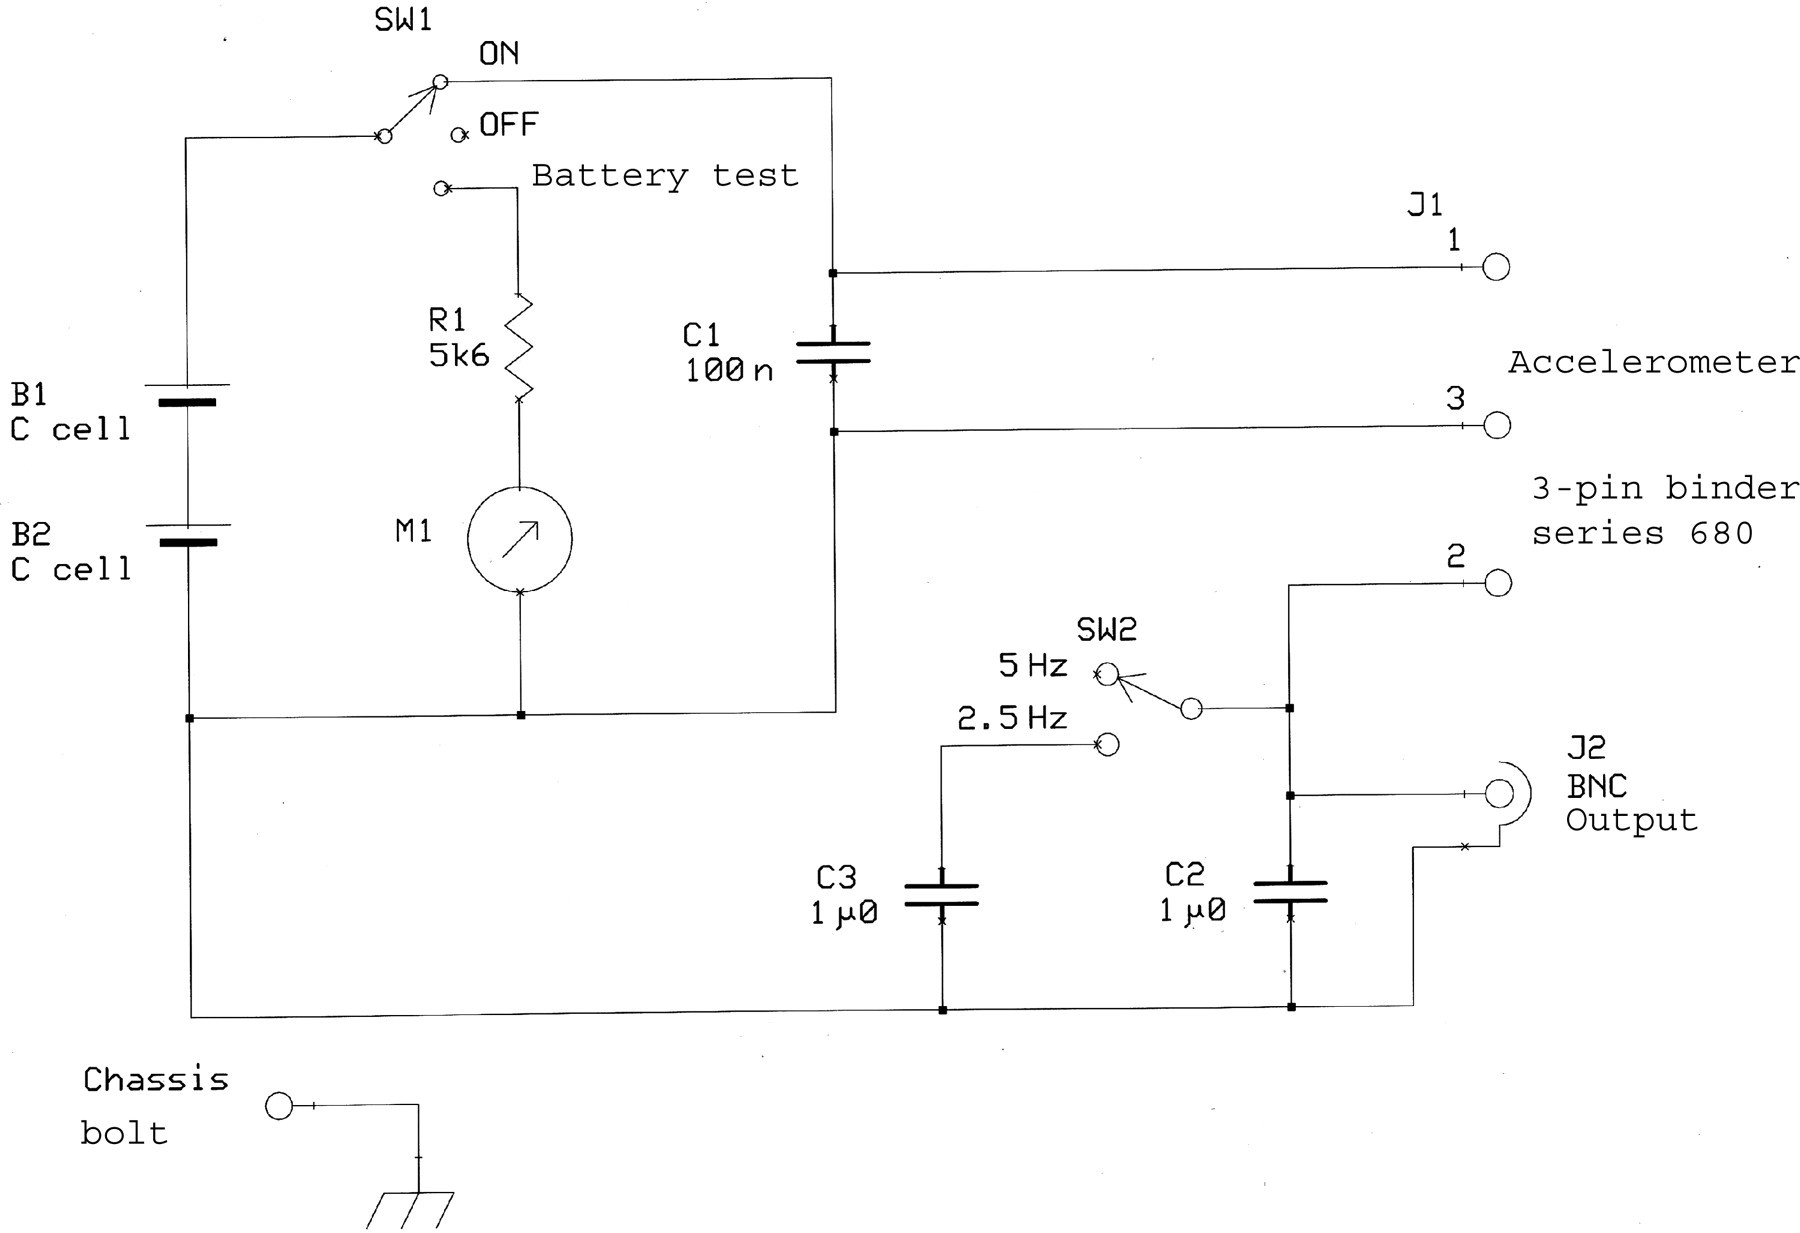
Respiratory monitor circuit diagram (see Table 1 for abbreviations)
Respiratory monitor component list
B: battery; C: capacitor; J: junction/connector; M: meter; R: resistor; SW: switch
Animals
Female Wistar-Han rats (HsdHan:WIST; n = 12) weighing between 200 and 250 g were used and transported from Harlan (Bicester, UK) by van in filter boxes. Animals were housed in groups of six and kept on a 12 h dark/artificial light cycle in an open-system holding room at a temperature of 22°C, humidity 55%; food (RM3p, Special Diets Services Ltd, Witham, UK) and water were available ad libitum. Cage material comprised plastic and wire mesh (plastic floor and sides, wire mesh ceiling and food hopper) and contained sawdust, bedding material and a cardboard house. Procedures were performed with Home Office approval under the Animals (Scientific Procedures) Act 1986. In accordance with national guidelines to reduce animal usage (UK Home Office; Research and Testing Using Animals;
Surgical procedures
Rats were anaesthetized in a red-Perspex induction chamber with 5% isoflurane in oxygen using an Isotec-3 vaporizer and then transferred to a modified facemask in a stereotaxic frame; the animal was thus allowed to breathe spontaneously. During surgical procedures, isoflurane was administered between 2.5% and 3.5%. Following surgery, animals were maintained between 0.7% and 1.8%. The accelerometer IC can be attached to the animal in a number of ways (including by glue fixation if a more secure attachment is required for longer procedures) but should be attached to the area of the maximal movement. This depends on the type of surgery performed and the species of animal. Maximal respiratory movement would ordinarily be a ventro-caudal region of the thorax but, as our surgery took place on an animal in the prone position in a stereotaxic frame, the IC was secured to the lateral abdomen (Figure 4) using micropore adhesive tape. To enable HR recordings, single-strand copper ECG recording leads were inserted subcutaneously behind each forelimb and connected to a simply constructed ECG-processing unit. The components and assembly of this unit were also very cost-effective and based on widely available circuit diagrams (which we are happy to provide upon request). Two trepanne holes (1 mm Ø) were drilled on the left-hand side of the cranium at the following stereotaxic coordinates, relative to bregma: anterior–posterior = 1 mm, medial–lateral = 2 mm; anterior–posterior = −4 mm, medial–lateral = 3 mm. Two pieces of loop-tipped silver wire (0.2 mm Ø; Intracel) served as differential and active EEG electrodes and were inserted ∼1 mm subcranially into the rostral and caudal trepanne holes, respectively. The EEG signal was sampled at 2500 Hz and processed via a NeuroLog head-stage, preamplifier and filter module (NL100AK, NL104A, NL125; Digitimer Ltd, Welwyn Garden City, UK) before being displayed in Spike2 software via a microCED1401 data acquisition unit (Cambridge Electronic Design, Cambrdige, UK). The respiratory signal was sampled at 1000 Hz, low-pass filtered using another Neurolog filter module (NL125) at 10 Hz and also digitized via a microCED1401. At the end of the experiment, animals were killed by an overdose of pentobarbitone (Pentoject, Animalcare Ltd, Ripon, UK). After breathing and heart beat had stopped, death was confirmed by dislocation of the neck.
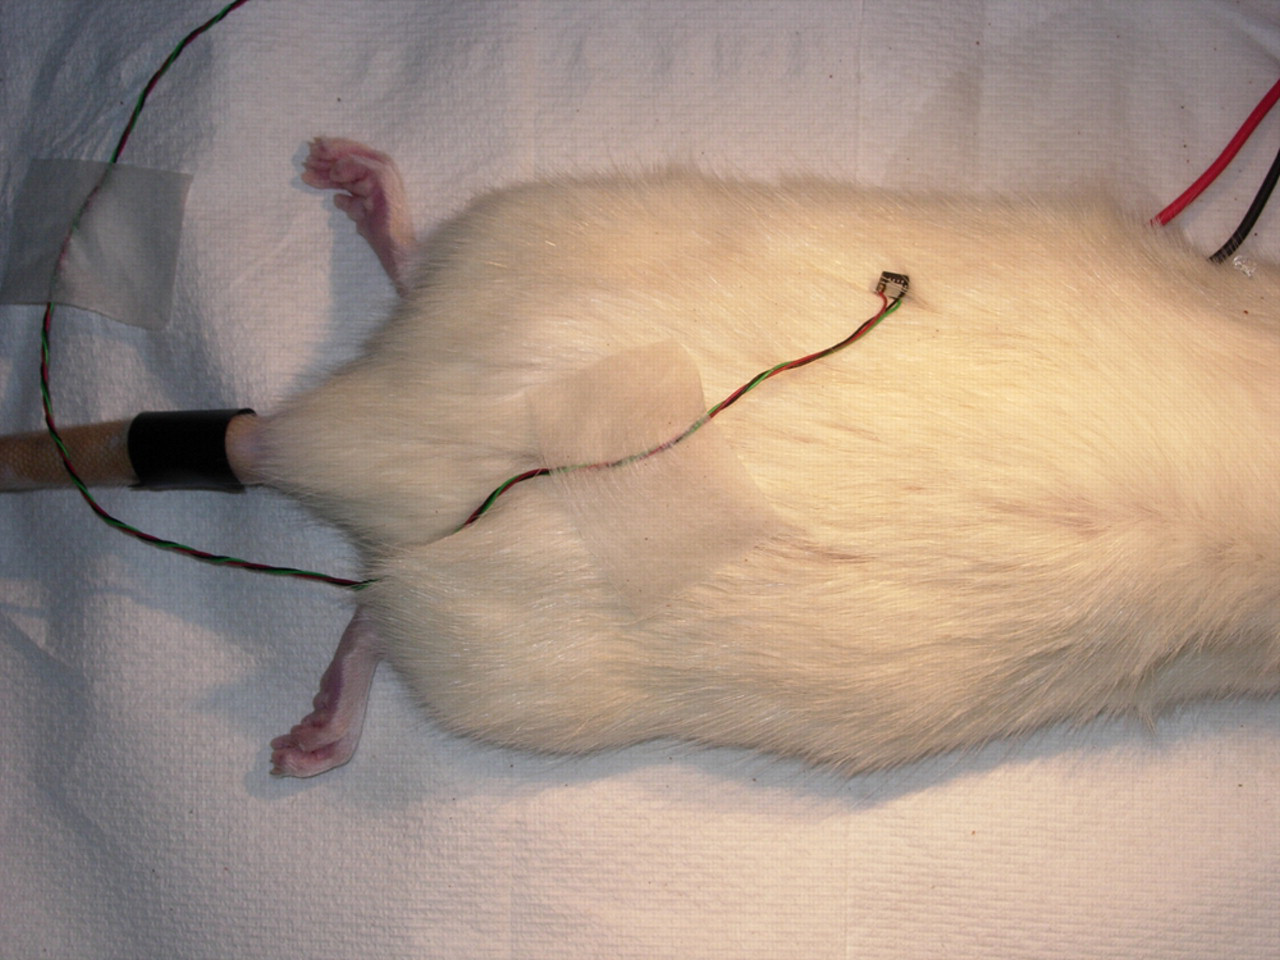
Attachment site on animal
Characterization of anaesthetic depth
Distinctive anaesthetic stages can be produced using isoflurane anaesthesia simply by altering the administered concentration and taking note of the pattern and spectral characteristics of the EEG. 9 Stages commonly observed in animal anaesthesia have previously been classified and, borrowing nomenclature from early anaesthetic research, 10 are designated as stages IV, III-4, III-3 and III-2 (deep to light). Different states can be clearly identified from the EEG with little or no processing, especially when using isoflurane and urethane anaesthesia: 9 stage IV is the isoelectric state in which little or no EEG activity is observed; stage III-4 contains a combination of EEG ‘burst’ activity and burst suppression; stage III-3 comprises continuous EEG activity but of high amplitude, low frequency; III-2 can be defined by low-amplitude, higher-frequency EEG waveforms. EEG, ECG and respiration were recorded continuously and stable 3 min periods were taken from each animal during the anaesthetic depths identified as described above. As a result of retrospective analysis of data (see the Animals section above), the numbers of animals containing the different stages (IV–III-2) varied and were as follows: n = 3, 10, 12 and 7, respectively.
Data analysis
Fast Fourier transforms were obtained from the 3 min periods of EEG, ECG and respiration data in the four anaesthetic stages. Dominant frequencies were then computed in order to provide a quantitative measure of anaesthetic depth from the EEG and to obtain HR and RR, respectively. For ease of interpretation, HR and RR were converted from cycles per second to cycles per minute (i.e. beats or breaths). To obtain a measure of RD, the root-mean square was obtained by calculating the square root of the mean of the squares from the raw respiratory data; in essence, this provides an index of the relative (i.e. not standardized or calibrated) magnitude of respiration. One-way analysis of variances (ANOVAs) and appropriate post hoc tests were performed on each measure.
Results
An example of the signal generated by the respiratory monitor is provided in Figure 5b. Both respiratory and EEG data are illustrated in Figure 5 during the transition between two anaesthetic stages, in this case produced by decreasing the concentration of isoflurane from 1.8% to 1.7% (at 0 second). Anaesthetic depth was found to be easily modulated by careful control of the isoflurane vaporizer and physiological changes were generally observed within minutes. A decrease in the depth of respiration is easily discernable with the naked eye (Figure 5b; transition beginning at ∼180 s). There was also a concomitant change in the rate of respiration, more clearly seen in the data extracts (Figures 5d and f). Of note is the concurrent change in EEG activity (Figure 5a), from a ‘burst’ state (III-4; Figure 5c) to a ‘continuous-wave’ state (III-3; Figure 5e).
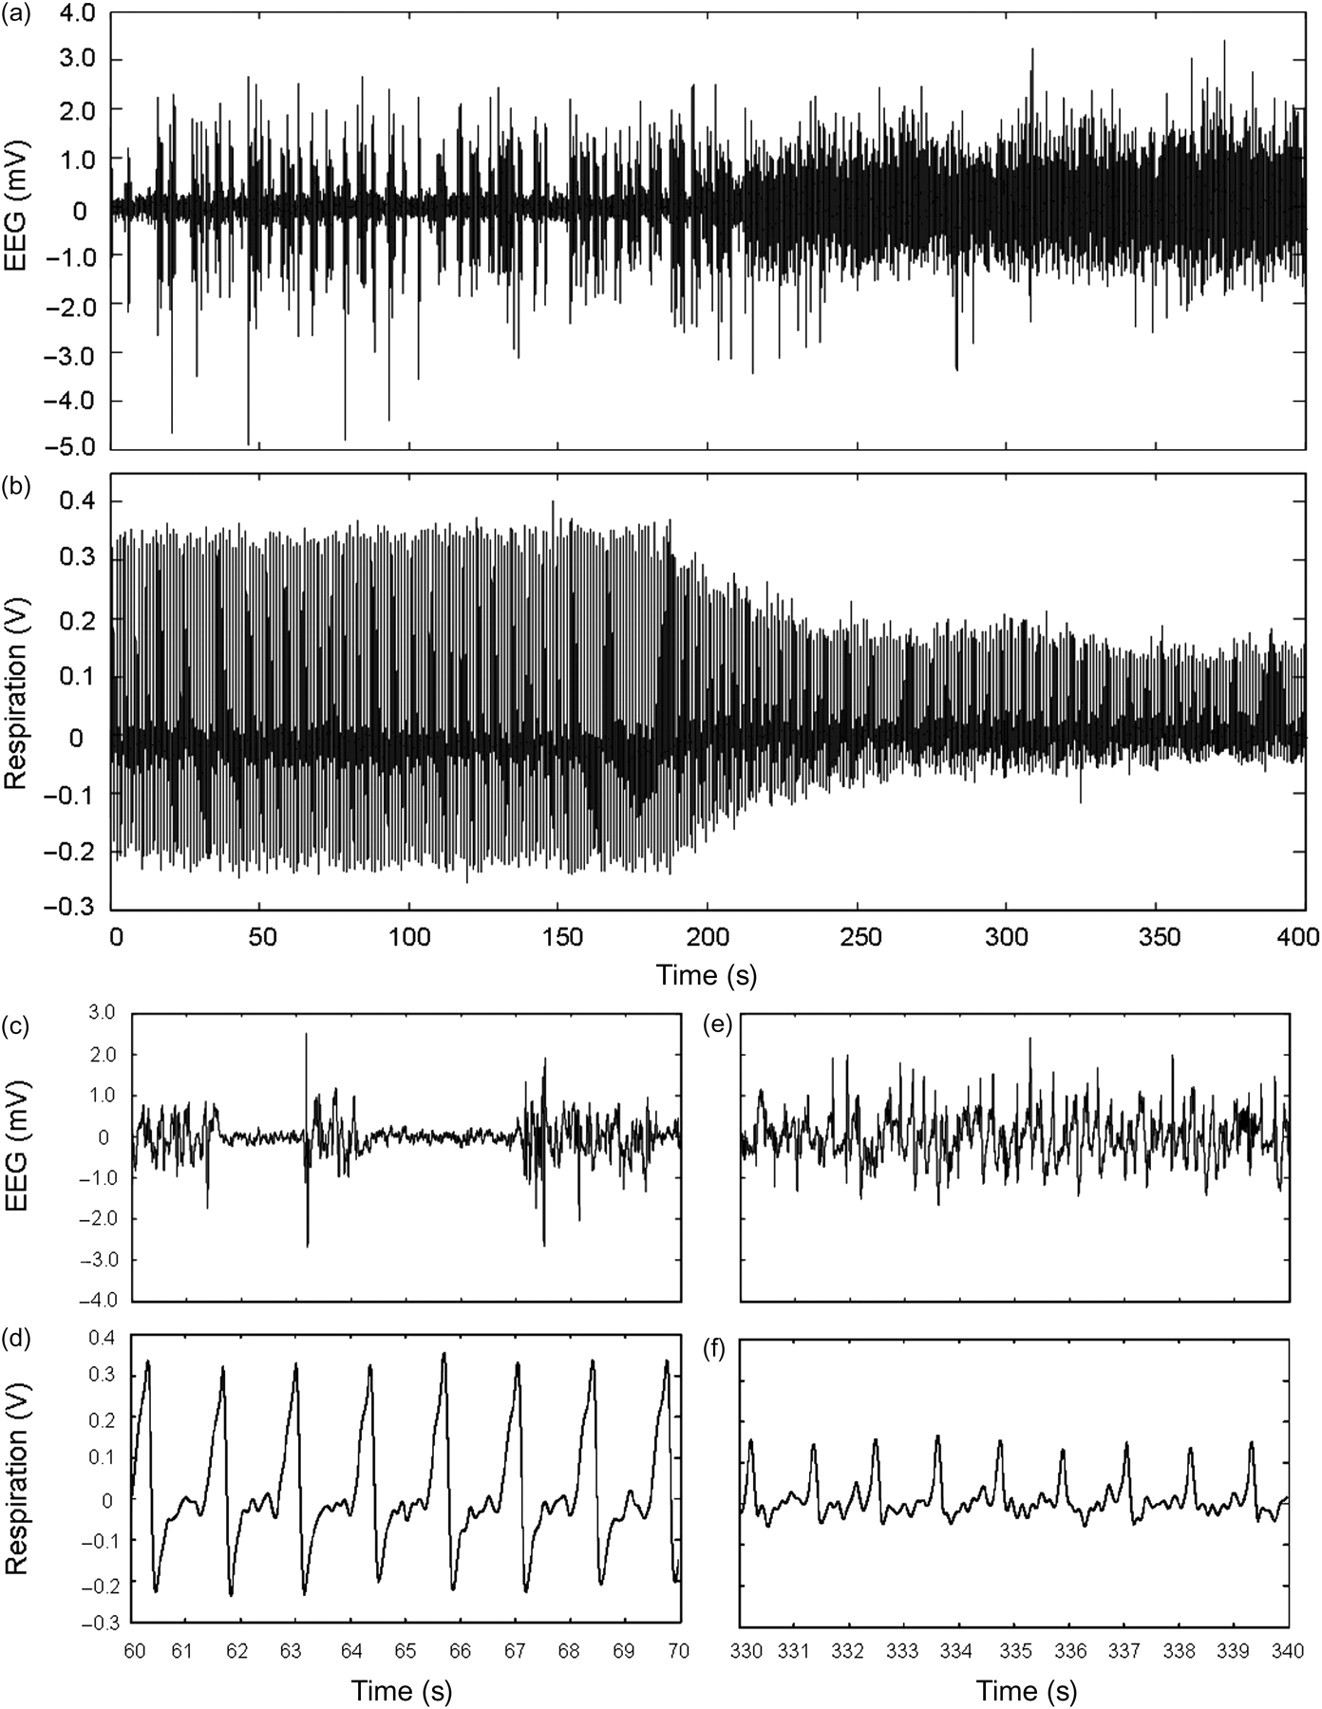
Concurrent change in electroencephalogram (EEG) and respiratory rate after a reduction in isoflurane concentration from 1.8% to 1.7% (raw data from an individual animal). Upper panels show overall changes in EEG (a) and respiration (b), while lower panels show finer details of EEG (c and e) and respiratory (d and f) waveforms, extracted from (a) and (b), respectively
The overall effect of anaesthetic depth on the dominant frequency of the EEG, HR, RR and RD in all animals is shown in Figure 6. As the depth of anaesthesia is decreased from stage IV to III-2, there are clear changes in the dominant spectral component of the EEG and RR. Both EEG and RR gradually increase through all anaesthetic stages, whereas HR remains very stable in all anaesthetic stages apart from the deepest, where it shows a slight decrease. RD decreases as anaesthesia changes from stage IV to III-3. ANOVAs showed a significant difference between anaesthetic stages for EEG (F = 28.14, df = 3, P < 0.001), RR (F = 11.19, df = 3, P < 0.001) and RD (F = 23.77, df = 3, P < 0.001). Post hoc tests showed that the EEG was significantly different between all anaesthetic stages (P < 0.001, but P < 0.05 for IV versus III-4 and III-3 versus III-2). The RR at the lightest stage (III-2) was significantly different from all other stages (versus IV and III-4, P < 0.001; versus III-3, P < 0.05) and the deepest stage (IV) was different from stage III-3 (P < 0.05). The RD at all stages was different from all others (P < 0.001, but P < 0.05 for IV versus III-4) apart from III-3 versus III-2. Notably, there was a significant correlation between EEG and RR in the ranges studied (R 2 = 0.655, P < 0.001; Figure 7a) and a strong, yet non-linear correlation between EEG and RD. This latter relationship was better represented by a fourth-degree polynomial curve due to the RD stabilizing during stage III-3 anaesthesia (R 2 = 0.680; Figure 7b).
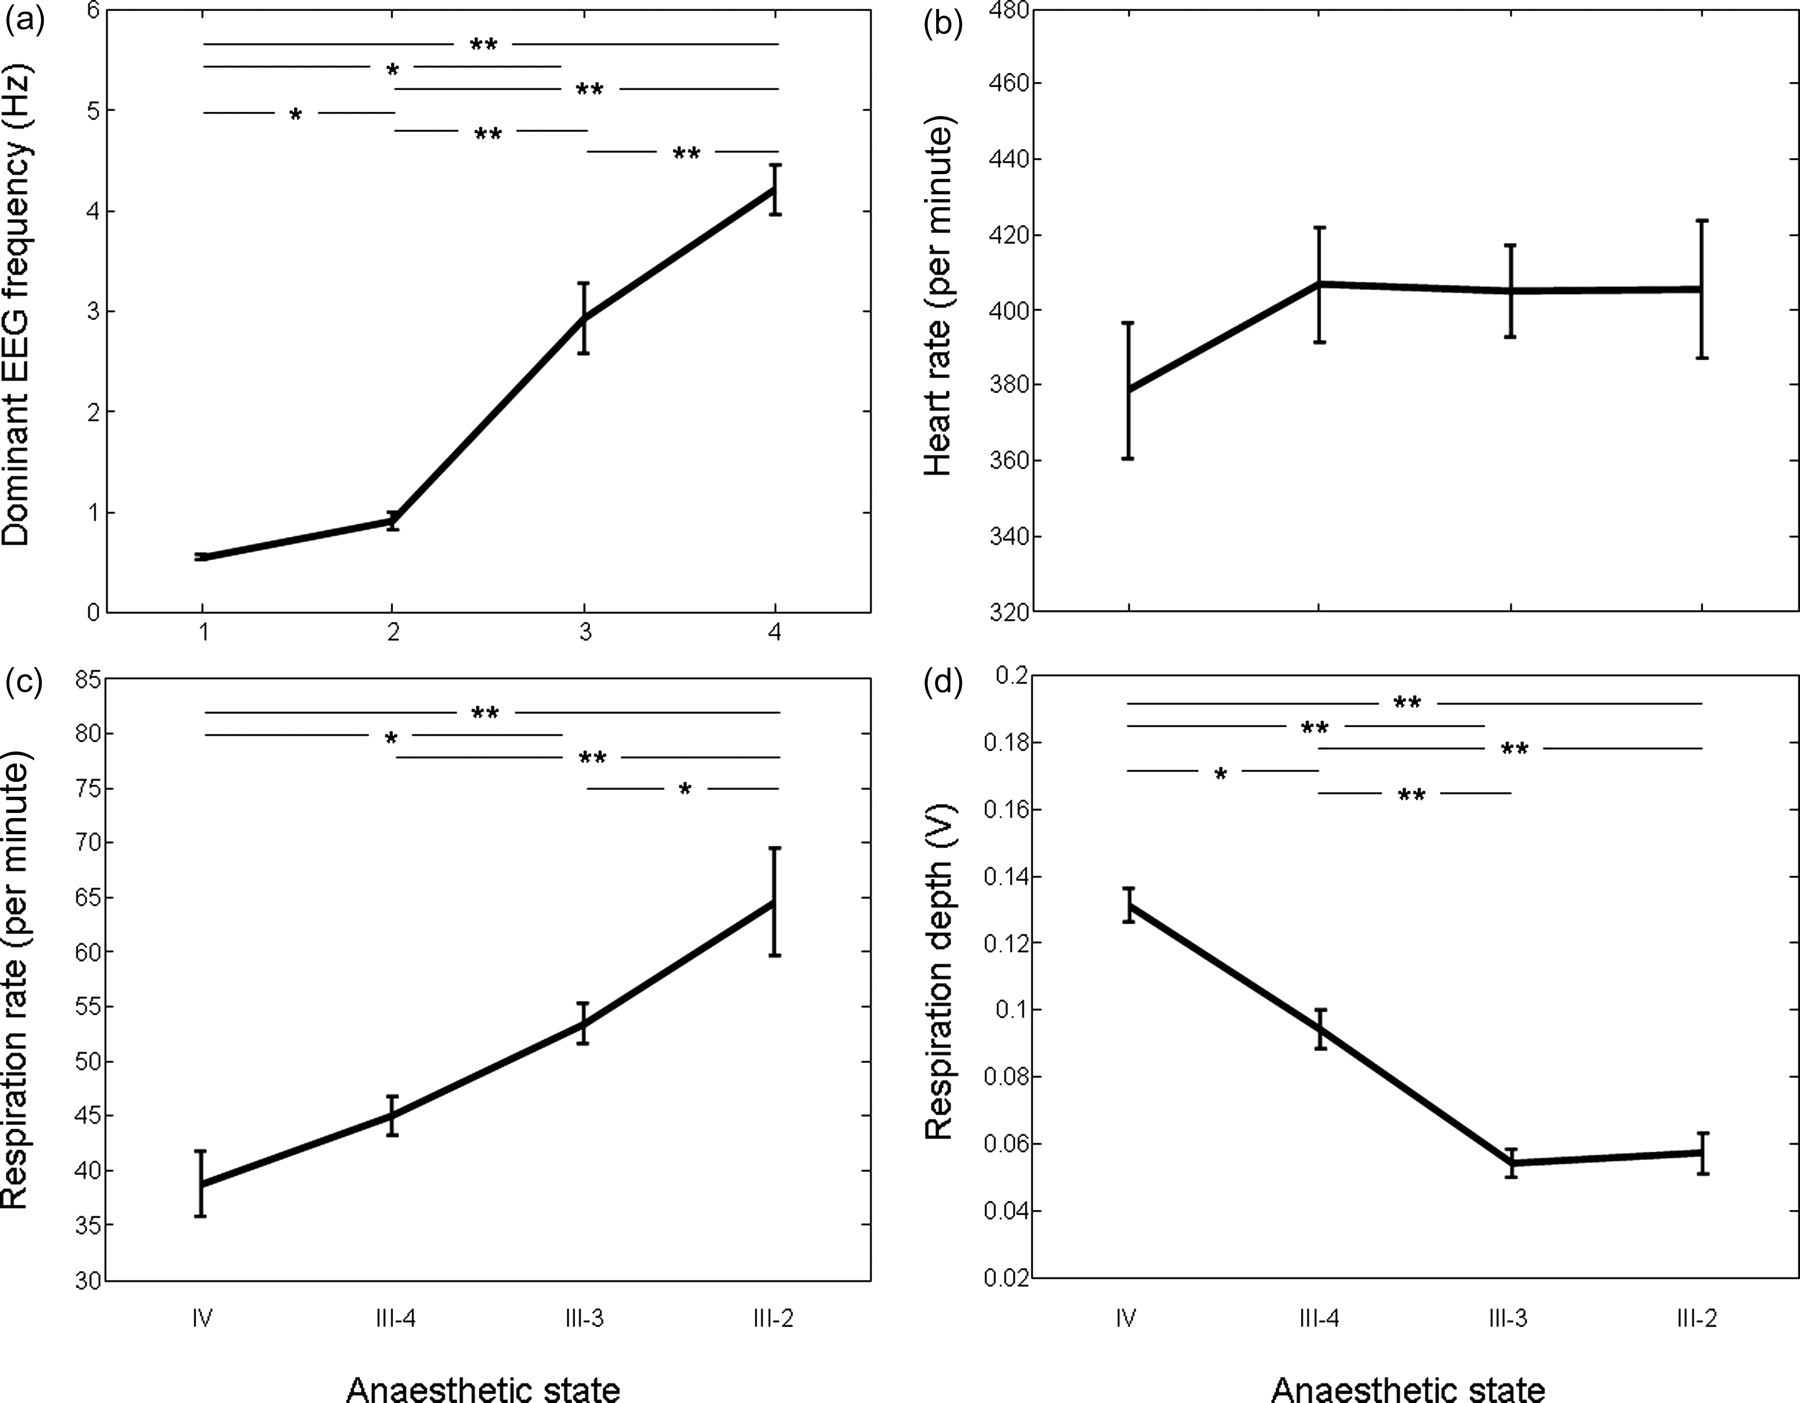
Changes in physiological parameters in different anaesthetic stages (IV–III-2). (a) Electroencephalogram; analysis of variance (ANOVA) showed a significant effect (F = 28.14, df = 3, P < 0.001) and post hoc tests showed significant differences between all anaesthetic stages (P < 0.001 but P < 0.05 for IV versus III-4 and III-3 versus III-2). (b) Heart rate; no effect between anaesthetic stages. (c) Respiratory rate (RR); ANOVA showed a significant effect (F = 11.19, df = 3, P < 0.001); RR at the lightest stage (III-2) was significantly different from all other stages (versus IV and III-4, P < 0.001; versus III-3, P < 0.05) and the deepest stage (IV) was different from stage III-3 (P < 0.05). (d) Respiratory depth; ANOVA showed a significant effect (F = 23.77, df = 3, P < 0.001); values at all anaesthetic stages were significant from all others (P < 0.001, but P < 0.05 for IV versus III-4) apart from III-3 versus III-2 (*P < 0.05, **P < 0.001)
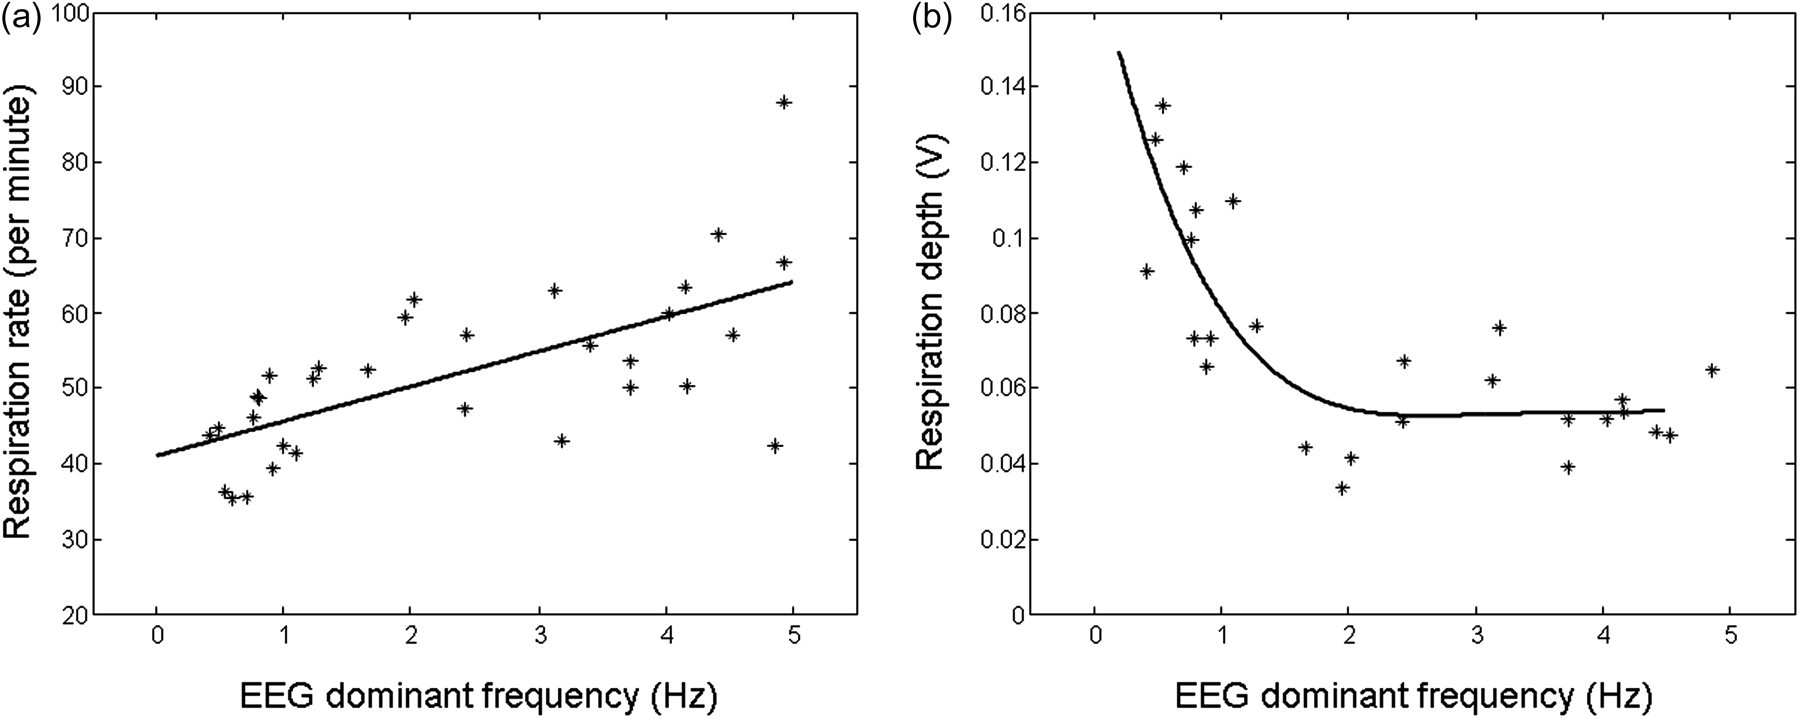
Correlations between electroencephalogram (EEG) dominant frequency and respiratory rate (RR) and respiratory depth (RD) from all animals in different anaesthetic stages. Linear fit between EEG and RR: R 2 = 0.655, P < 0.001; fourth-degree polynomial fit between EEG and RD, R 2 = 0.680
Discussion
The motivation behind the design of the respiratory monitor described in this article was to provide an inexpensive means by which respiratory parameters could be recorded under a variety of experimental and clinical conditions. We will now assess the relative successes of the device in achieving this. The overall cost of the unit at the time of the article going to press was approximately 5% of the least expensive commercially available capnograph and thus represents excellent value for money. The unit was designed with portability in mind and the size of the control unit is relatively small and lightweight, ensuring that it can be unobtrusively positioned within the surgical space and easily transported between locations. Batteries are used to power the unit, thereby reducing the weight that a transformer and other power-supply components would necessitate; this has the added advantage of reducing electrical noise, which is important for experimental applications. The accelerometer used as the sensor is one of the smallest available and has a very narrow and flexible cable attachment to enable easy and appropriate placement onto, in our opinion, a range of animal species.
The method of sensor attachment is flexible and, though we found micropore adhesive tape worked perfectly well, the sensor may be fixed with medical glue for longer-term procedures or when an animal must be moved into different positions during surgery. The sensor is placed directly onto the surface of the skin/fur (no clipping of the fur is necessary) and, as such, requires no surgical preparation (such as that for tracheal cannulation or invasive EEG electrode insertion) which would require Home Office approval in experimental settings. Attachment time is very quick and the device can begin to function immediately after (if not during) the anaesthetic induction period. Thus, there is no lag time such as that associated with the implantation of EEG electrodes or with techniques that require ventilation (e.g. tracheal cannulation).
On a practical level, construction of the unit is relatively simple as the circuit contains only 10 different components and is assembled without the use of printed circuit board. The accelerometer IC must be soldered under a microscope but all other aspects of construction are very straightforward.
Reliability of the unit has been good with no circuit component failures within a period of 12 months. The most delicate part of the device is the cable attachment to the accelerometer IC, although we have only had to re-connect the IC twice in the period stated above.
To summarize the technical elements described above, the compact size of the device and the speed and relative ease that it can be incorporated into an anaesthetic regimen, without any restrictions place on its use due to route of anaesthetic delivery or the particular surgical procedure to be performed, indicate that this cost-effective respiratory monitor is applicable to a wide range of experimental and clinical settings. We now turn our attention to the practical interpretation of data obtained with the monitor.
The respiratory monitor described here was found to transduce chest movement of anaesthetized animals into clear signals that could be used to obtain information regarding rate and depth of respiration. Consistent with the common use of respiratory parameters for the monitoring of anaesthetic depth in veterinary practice, significant differences in RR and RD were detected in the four different stages of anaesthesia studied that were identified by examination of the EEG – a more objective and standardized measure of anaesthetic depth. 11 The EEG is a common method of anaesthetic monitoring in humans when combined with electromyograms to produce simple scales of anaesthetic depth such as the bispectral index. 12,13 However, despite providing a well-trusted index of anaesthetic depth when used in this manner in humans, EEG is not widely used during veterinary surgery due to financial and technical limitations. 14 Our results were consistent with the knowledge that anaesthetics commonly depress respiratory function, with increasing concentrations of isoflurane producing a slowing of the RR and increased RD. The observation that HR shows no correspondence with anaesthetic depth (Figure 6b) is consistent with that of the literature 5,6 and what is commonly found in the veterinary clinic. It is thus likely that, in those cases where the depth of anaesthesia is poorly monitored, the recording of respiratory parameters in experimental procedures could refine physiological monitoring. This could be achieved, for example, by recognizing periods of inadequate anaesthesia by observing a fluctuating RR, thereby helping to maintain anaesthesia within more acceptable limits.
The utility of RR monitoring in the veterinary clinic is well established and widespread for the monitoring of both basic physiology and depth of anaesthesia 1,15,16 and our results are in line with experimental investigations into the relationship between RR and anaesthetic stages. 9 It is our hope that, where appropriate, respiration parameters are used to refine experimental procedures in order to maintain anaesthesia within acceptable limits. Nevertheless, the effects observed in the current study should not be generalized across all anaesthetic regimens and species as the relationship between agent, species and physiology may not always be straightforward or predictable. For example, fentanyl-fluanisone/midazolam anaesthesia produces variable effects on RR, which would make interpreting RR difficult. 17 Furthermore, the administration of pharmacological agents during surgical procedures (e.g. opioids and agents acting upon the autonomic nervous system or that influence acid/base balance) could render the absolute RR inconclusive though may maintain the utility of RR changes. Consequently, when new anaesthetics or anaesthetic combinations are used, experience is essential before interpretation of physiological measures into discrete stages of anaesthesia is valid.
The work presented here indicates that respiration can be easily recorded in realtime by a device that can be inexpensively and simply constructed, and can be used with a wide range of species, with no restrictions placed on the size of animal, lung capacity, force of expiration, route of anaesthetic delivery or procedure being performed. We hope that the use of such methods refine the monitoring of experimental animals while under general anaesthesia and serve as an alternative to less optimal alternatives currently available within the laboratory.
Footnotes
ACKNOWLEDGEMENTS
The authors gratefully acknowledge the support from the John Templeton Foundation and the James Martin 21st Century School.