
Abstract
Objectives
The aim of this study was to assess hepatic copper concentrations and zonal distribution in cat liver specimens.
Methods
For this study, 121 archived, formalin-fixed, paraffin-embedded liver specimens from cats were used. Tissue sections were stained for copper with rhodanine and scored from 0 (no copper accumulation) to 5 (panlobular copper accumulation). The tissue specimens were then deparaffinized and hepatic copper concentrations were measured using flame atomic absorption spectroscopy.
Results
Tissue samples were categorized into four groups based on histopathologic findings: (1) no significant histopathologic hepatic changes (n = 66); (2) hepatic steatosis (n = 18); (3) inflammatory or infectious disease (n = 24); and (4) neoplasia (n = 13). Of the 121 specimens, 13 (11%) stained positive for copper, with three having a score ⩾3. Thirty-seven specimens (31%) had copper concentrations above the reference interval ([RI] <180 µg/g dry weight liver). Copper concentrations in cats with hepatic inflammatory or infectious disease were significantly higher than cats with hepatic steatosis (P = 0.03). Copper-staining score and concentration were positively correlated (rs = 0.46, P <0.001).
Conclusions and relevance
Despite the fact that 31% of specimens had copper concentrations above the RI, only 11% showed positive copper staining and only 2.5% had a score ⩾3. Our findings suggest that hepatic copper concentrations greater than the upper limit of the RI are relatively common in cats. Further studies to determine the factors that influence hepatic copper staining in cats and to establish contemporary RIs for hepatic copper in healthy cats are warranted.
Keywords
Introduction
Copper is an essential trace element that serves as a cofactor for several enzymes that are essential for the growth, development and maintenance of living cells.1,2 The liver plays a major role in copper metabolism and homeostasis. Copper from the diet is stored in hepatocytes, is exported in a protein-bound form and is eliminated through biliary excretion. 3 Tight regulation of copper is essential as it is a potentially toxic transition metal that can generate reactive oxygen species (ROS) via the Fenton reaction. The disruption of copper homeostasis can lead to the accumulation of copper and ROS production. Excess ROS promote oxidative stress and consequently induce hepatic necrosis, inflammation and fibrosis.4,5 Chronic hepatitis can eventually progress to hepatic cirrhosis and liver failure. 6
Copper-associated hepatopathy, which results from excessive hepatic copper accumulation, is common in dogs. This disease can be caused by a genetic defect of a copper transporter gene leading to disturbance in the biliary copper elimination,7,8 exposure to an increased amount of copper in the diet or a combination of the two.7,9,10 The mutation of the copper metabolism domain containing 1 (COMMD1) gene has been reported in the Bedlington Terrier. 9 In contrast, copper-associated hepatopathy in the Labrador Retriever is multifactorial. An inherited predisposition and an association with the P-type copper-transporting ATPases genes, ATP7B and ATP7A, have been reported.10–12 Diet has been suggested to play a crucial role in copper accumulation, especially in the Labrador Retriever with its hereditary predisposition.6,13 Copper-associated hepatopathy has also been reported in other breeds, including the West Highland White Terrier, Skye Terrier, Doberman Pincher and Dalmatian.14–17 Copper accumulation from an inherited defect typically appears in the centrilobular zones of the liver. 7
In people, hepatic copper accumulation can occur secondarily to cholestasis. Cholestatic liver disease decreases the ability of copper excretion through the biliary system and results in copper accumulation in the periportal areas. However, the magnitude of copper accumulation secondary to cholestasis in dogs is low and thus cholestasis may not be an important contributor to copper accumulation in this species.11,18,19
Copper-associated hepatopathy has not been well characterized in cats, with only a limited number of studies and case reports describing cats with presumed primary copper-associated hepatopathy.20–23 In two case reports, copper accumulation was mainly localized in the centrilobular area, and both of those cats had extremely high hepatic copper concentrations (4074 and 4170 µg/g dry weight liver; reference interval [RI] 150–180 µg/g dry weight liver).22,23 Electron microscopic examination was performed in one of the cats and showed electron-dense aggregates, which were probably copper-laden lysosomes in hepatocytes and macrophages. This finding is similar to the findings in Bedlington Terriers with inherited copper toxicosis. 23
One study of copper accumulation in cats with various liver diseases revealed that the accumulation was varied in location. 20 Another study suggested that copper accumulation in cats may be primary or secondary to other hepatobiliary diseases. 21 Cats suspected to have primary copper-associated hepatopathy (PCH) had copper concentrations (>700 µg/g dry weight liver) that were higher than those in cats with other hepatobiliary diseases. Moreover, the areas of copper accumulation appeared to be similar to those seen in dogs. In contrast, cats with cholestatic disorders had copper accumulation in the periportal or intermediate zones. 21 However, no other reliable clinical markers can be used to differentiate between primary and secondary copper-associated hepatopathy and possible causes of copper hepatopathy in cats are unknown. Therefore, the role of hepatic copper accumulation in feline liver disease is not fully understood.
The purpose of our study was to assess hepatic copper content and zonal distribution in liver specimens from cats with various liver diseases, comparing them with those with no significant histopathologic changes of the liver.
Materials and methods
Sample collection
In total, 121 archived formalin-fixed paraffin-embedded (FFPE) liver specimens from cats were used. These specimens were collected during non-study-related necropsy or surgical biopsy from 2015 to 2016, and were submitted to the Texas A&M Veterinary Medical Diagnostic Laboratory for histopathologic analysis.
Tissue sample classification
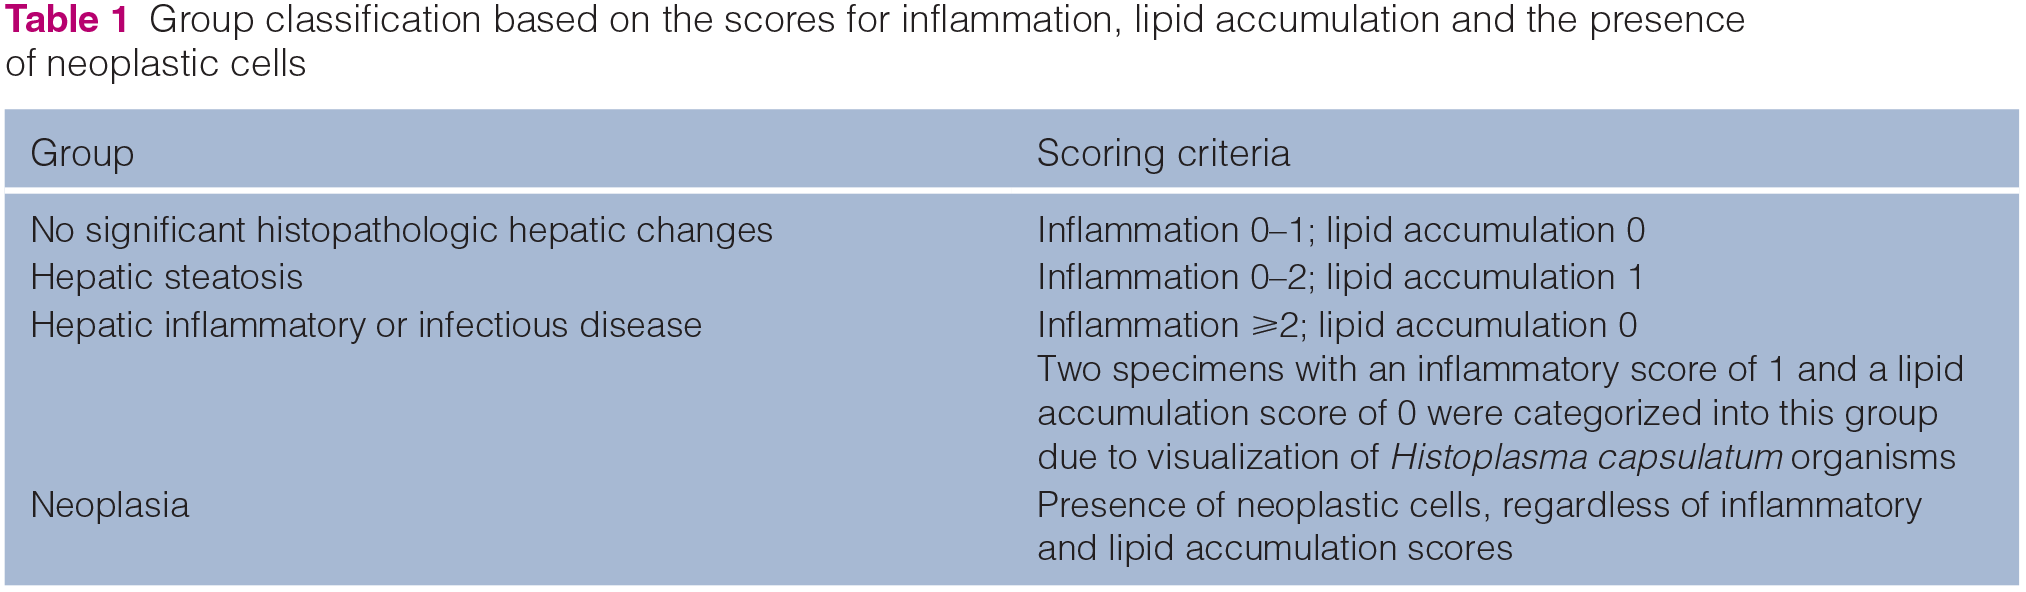
FFPE specimens were cut at 4 µm thickness and tissue sections were stained with hematoxylin and eosin (H&E) and a second set was stained with rhodanine using standard techniques. The H&E-stained slides were used for histopathologic analysis using a modified scoring system for inflammation (0 = none; 1 = mild; 2 = mild to moderate; 3 = moderate; 4 = severe) 24 and lipid accumulation (0 = in <80% of hepatocytes; 1 = in ⩾80% of hepatocytes).21,25 Tissue samples were classified into four groups based on scores for inflammation, lipid accumulation and the presence of neoplastic cells (Table 1). All tissue sections were evaluated in a blinded fashion by a single board-certified veterinary pathologist (RMG).
Group classification based on the scores for inflammation, lipid accumulation and the presence of neoplastic cells
Qualitative copper assessment
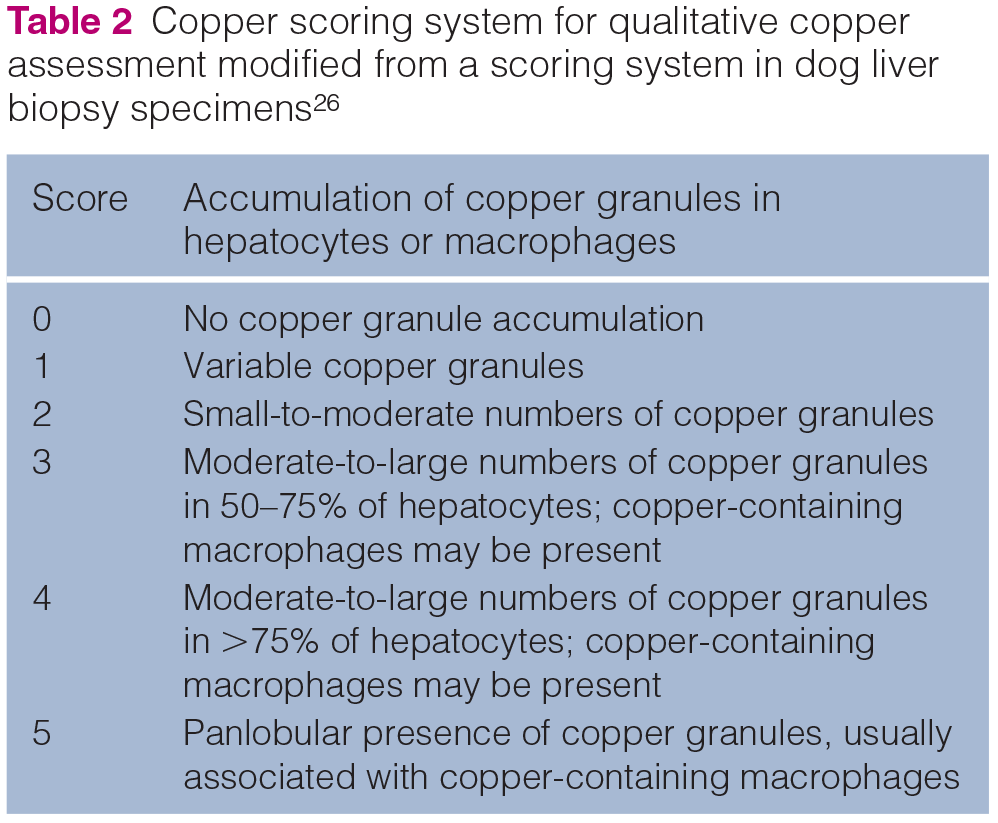
The same pathologist also evaluated the hepatic copper accumulation in rhodanine-stained sections. The copper staining was scored using a modified scoring system for copper in dog liver biopsy specimens (Table 2). 26
Copper scoring system for qualitative copper assessment modified from a scoring system in dog liver biopsy specimens 26
Quantitative copper assessment
FFPE specimens were used for copper quantification as the deparaffinized liver specimens have been shown to have comparable copper concentrations to fresh frozen liver specimens. 27 After tissue sectioning, FFPE specimens were submitted to the Veterinary Diagnostic Laboratories at Colorado State University. They were deparaffinized and hepatic copper concentrations were measured using flame atomic absorption spectroscopy (FAAS). This method of copper quantification has been validated for a sample size of 10 mg dry weight or greater. Thus, specimens that weighed <10 mg dry weight were excluded from the analysis. The RI was 150–180 µg/g dry weight liver and copper concentrations <100 µg/g dry weight liver were considered to be deficient.28,29
Statistics
Data were tested for normality using the Shapiro–Wilk W test and data were reported as median (range) values. A comparison of hepatic copper concentrations between groups was performed using the Kruskal–Wallis test with a post-hoc Dunn’s multiple comparison test. The relationship between hepatic copper concentrations and copper-staining scores was evaluated by Spearman’s rank correlation. Values of P <0.05 were considered significant. Data were analyzed with commercially available statistical software (JMP Pro version 14; SAS Institute).
Results
Initially, 154 liver specimens were considered for use in the study. Twenty-eight specimens were excluded owing to tissue weight <10 mg dry weight. Five specimens were also excluded owing to autolysis on histopathologic examination and the remaining 121 specimens were used in this study. The specimens were categorized into one of four groups: (1) no significant histopathologic changes; (2) steatosis; (3) inflammatory/infectious disease; or (4) neoplasia (found in 13 specimens, comprising four with lymphoma, four with cystadenoma, and one each with myelolipoma, hemangiosarcoma, round-cell tumor, mast-cell tumor and metastatic adenocarcinoma) as shown in Table 3.
Summary of histopathologic scoring criteria and median with range of hepatic copper concentrations of 121 cats

There was a significant difference in hepatic copper concentration between specimens with hepatic steatosis and those with inflammatory/infectious disease (P = 0.03)
Distribution of age, sex and breed of cats were analyzed. Information on age and sex was not recorded for six cats and breed information was missing for 11 cats. The median age (n = 115) was 36 months (range 0.5–204 months). Cats with hepatic neoplasia (median 138 months, range 24–192 months) were significantly older than those with no significant histopathologic changes of the liver (median 24 months, range 0.5–204; P = 0.002) or those with hepatic inflammatory/infectious disease (median 36 months, range 0.5–180; P = 0.035). Of the 115 cats, there were 15 intact males (13%), 39 castrated males (34%), 23 intact females (20%) and 38 spayed females (33%). Of the 110 cats, 88 were domestic mixed breed (80%), four each were Persian or Ragdoll (3.6% each), three each were Bengal or Oriental Shorthair (2.7% each), two were Birman (1.8%) and one each were Bombay, Himalayan, Maine Coon, Norwegian Forest Cat, Siamese and Tonkinese (0.9% each).
Rhodanine staining was positive in 13/121 specimens (11%). Of these specimens, nine had a score of 1, one had a score of 2, two had a score of 3 and one had a score of 4 (Figure 1; see Appendix 1 in the supplementary material for individual information of histopathologic analysis, copper concentration, copper score and copper distribution). Thirty-seven of 121 specimens (31%) had copper concentrations above the upper limit of the RI (Figure 2; see Appendix 2 in the supplementary material). Median hepatic copper concentrations of specimens in each group are shown in Table 3. In this study, hepatic copper concentrations were significantly higher in specimens with hepatic inflammatory/infectious disease compared with those with hepatic steatosis (P = 0.03).
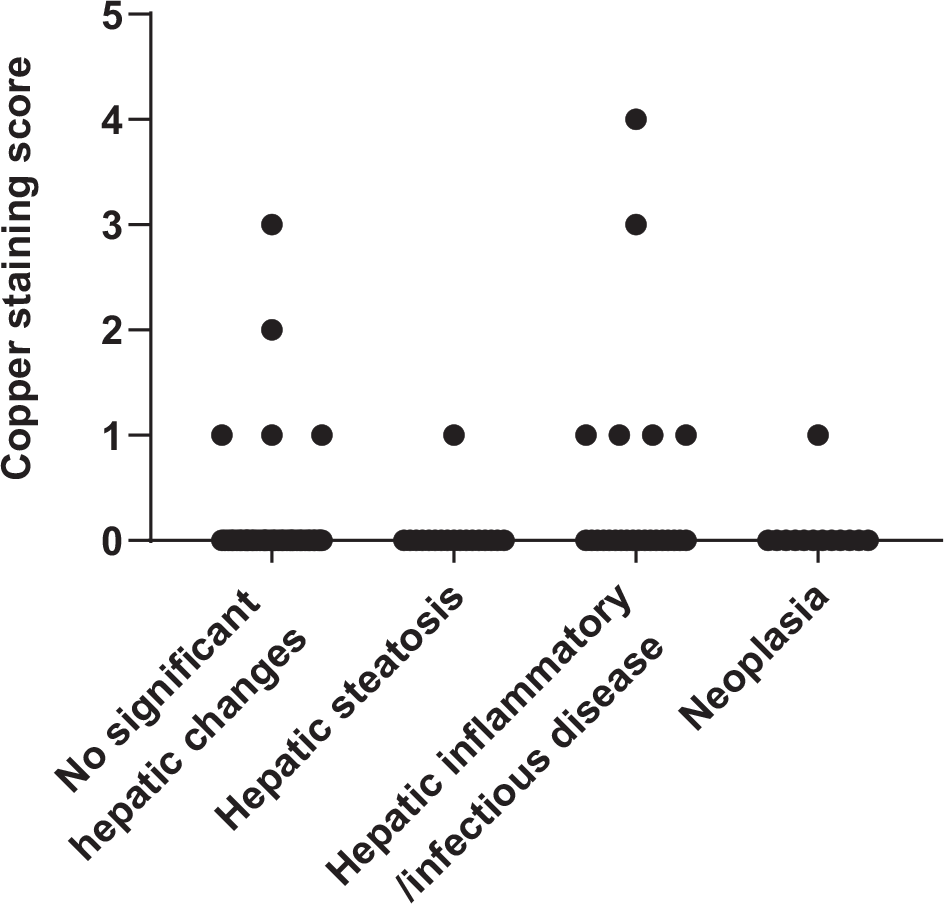
Copper-staining scores for 121 archived liver specimens from cats. Copper-staining intensities were scored from 0 (no copper accumulation) to 5 (panlobular copper accumulation). Positive staining was found in 13 specimens. Only three specimens had copper-staining scores ⩾3. Hepatic copper concentrations for these cases were 227, 787 and 2010 µg/g dry weight, respectively
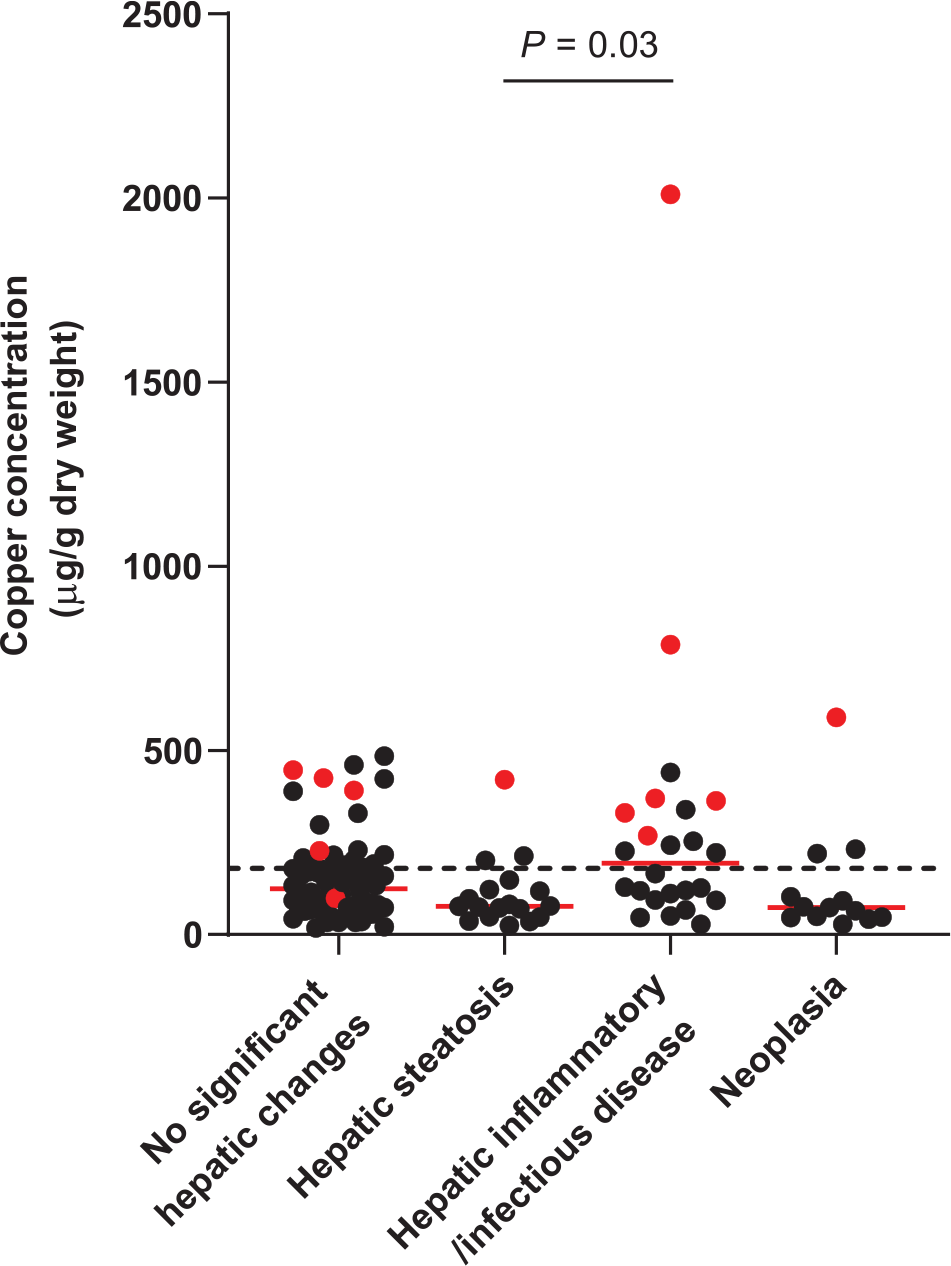
Hepatic copper concentrations for 121 archived liver specimens from cats. A total of 37 specimens (31%) had hepatic copper concentrations above the upper limit of the reference interval (<180 µg/g dry weight liver, represented by the dotted line). The red dots represent specimens with positive staining
Three specimens with copper-staining scores ⩾3 had histomorphological diagnoses of no significant histopathologic hepatic changes, randomly distributed hepatitis and histoplasmosis, and their copper concentrations were 227, 787 and 2010 µg/g, respectively. In the case with no significant histopathologic hepatic changes, the copper accumulation was centrilobular. In the other two specimens, copper granules were found in the centrilobular and midzonal areas. The 10 specimens with copper-staining scores of 1–2 had copper accumulation in various areas of the liver. In total, centrilobular accumulation was noted in four specimens, for one of which the copper was also mid zonal; periportal accumulation was reported in three specimens; and mid-zonal and random accumulations were found in the other three specimens. Copper-staining score and copper concentration were positively correlated (rs = 0.46, P <0.001; Figure 3).

Correlation between hepatic copper concentrations and copper (rhodanine)-staining scores for 121 archived liver specimens from cats (rs = 0.46, P <0.001)
Discussion
In this study, hepatic copper was assessed in archived cat liver specimens submitted to a veterinary diagnostic laboratory with both qualitative (rhodanine staining) and quantitative approaches. The tissue samples were classified based on histopathologic analysis.
Eleven percent of the liver specimens showed positive rhodanine staining. The prevalence in our study resembled that of a previous study, which found positive copper staining in 12/104 cats (12%). 20 In that study, the researchers used a different copper-scoring scheme with scores ranging from 0 (no staining) to 3 (marked staining). Copper staining in periportal, mid zonal or random areas was found in cats with scores of 1 or 2, whereas copper staining in the centrilobular area was found in cats with scores of 2 or 3 with various histopathologic diagnoses. In addition, in the same study, copper staining was not present in cats with histologically normal livers. 20 In our study, copper staining in periportal, mid zonal or random areas was found in specimens with scores of 1 or 2, whereas copper staining mainly in the centrilobular area was found in specimens with a wide range of scores (1–4) but mainly in those with a score ⩾3. Additionally, 5/66 specimens (7.6%) with no significant histopathologic changes had positive copper stains with scores ranging between 1 and 3. The reason for these differences between studies is not known.
In another study of hepatic copper accumulation in cats, the investigators found that cats with presumed PCH had marked centrilobular copper accumulation and copper concentrations typically greater than 700 µg/g dry weight liver. In contrast, copper accumulation from other causes, especially cholestatic disorders, was found in the periportal areas adjacent to inflammatory infiltrations. 21 As previously discussed, in our study, the pattern of copper accumulation varied; copper staining in specimens with scores ⩾3 was mainly in centrilobular areas, while the copper staining in specimens with scores ⩽2 did not show a specific localization. However, only 3/121 specimens had a copper score ⩾3. Additionally, H capsulatum was the likely etiologic agent in one of the three specimens and so concurrent PCH seems unlikely. In the other two specimens, the histologic diagnoses were no significant histopathologic hepatic changes and randomly distributed hepatitis, and the copper staining in these two specimens did not colocalize with inflammation, and so, again, PCH seems unlikely. Overall, PCH was not convincingly documented in any of the specimens we evaluated.
Measurement of hepatic copper concentrations showed that 37/121 specimens (31%) had copper concentrations above the upper limit of the RI. Nineteen of these specimens showed no significant histopathologic changes and 15 of these (78.9%) were negative for rhodanine staining. This suggests that cats can have copper concentrations greater than the upper limit of the RI without any significant hepatic changes and/or copper staining. Considering the previously proposed criteria for copper-associated hepatopathy in cats, 21 in the absence of histologic changes and/or copper staining, it is unlikely that hepatic copper concentrations greater than the upper limit of the RI are clinically relevant to PCH. However, these samples were evaluated at a single time point and the copper concentrations from these specimens were higher than the RI but all still <700 µg/g dry weight liver (the previously speculated threshold for PCH in cats). 21 Therefore, it cannot be ruled out that the specimens were collected during an early stage of copper-associated hepatopathy. During the initial stage of copper-associated hepatopathy in the Bedlington Terrier, the copper concentration can be increased without histologic hepatic alterations and clinical signs. 11 It is also possible that the increased hepatic copper concentrations in these specimens were influenced by other factors, such as diet. The change made to the type of copper premixes used in commercial cat food made in the late 1990s increased the bioavailability of copper. In the Labrador Retriever and other breeds of dogs, increased copper bioavailability in commercial dog food has been suggested to be a risk factor for copper-associated hepatopathy.13,30 Furthermore, the RI for hepatic copper content in cats was taken from a textbook published in 1988, and at that time this range (150–180 µg/g dry weight liver) was described as an adequate copper tissue level. 28 There was only one study of dietary copper in cats mentioned in the bibliography of this book. 29 In that study, the copper concentrations in various tissues were obtained from a total of 35 25-week-old kittens fed with different concentrations of dietary copper. However, it is still unclear exactly how the current RI was derived and it possibly needs to be updated. Establishment of a contemporary RI in a well-characterized group of cats being fed commercial diets would provide useful information for future studies. Additionally, even though copper concentrations measured from FFPE specimens have been shown to be clinically useful in dogs, 27 the effects of formalin on the hepatic copper concentration and the clinical copper assessment in cats have not been investigated. Therefore, fresh liver specimens should be ideally used for the most accurate results.
In the present study, specimens with hepatic inflammatory/infectious disease had significantly higher hepatic copper concentrations than those with hepatic steatosis. Two specimens in this group had abundant copper accumulation in the centrilobular and midzonal areas. One of these cats had been diagnosed with randomly distributed hepatitis with a copper score of 3 and a hepatic copper concentration of 787 µg/g. The other specimen had H capsulatum organisms with a copper score of 4 and a hepatic copper concentration of 2010 µg/g. These findings are consistent with those of a previous study, in which cats with inflammatory and/or infectious hepatic diseases also had copper accumulation in the liver. 20 In our study, specimens with hepatic steatosis had a lower median copper concentration than specimens with inflammatory/infectious disease, and 12/18 specimens (67%) had copper concentrations below the deficient level (<100 µg/g dry weight liver). However, these cats were not necessarily copper deficient. This is because copper concentration may be affected by many factors. For instance, a study of hepatic copper concentrations in dairy cattle found a negative correlation between hepatic copper concentrations and hepatic lipidosis. 31 The researchers suggested that increased hepatic fat can have a dilutional copper concentration. Increased fat accumulation displaces other molecules including protein that can bind with copper reducing the measured copper concentration. Additionally, we did not know the dietary history of these cats.
A study in dogs has shown a moderate correlation (r = 0.66, P <0.001) between hepatic copper concentration and copper-staining score. 30 To our knowledge, no prior study has examined this correlation in cats. In our study, we found a weaker positive correlation (rs = 0.46, P <0.001) between hepatic copper concentration and copper-staining score. The relative weakness of this correlation might be related to the techniques used to measure hepatic copper concentrations and copper accumulation. FAAS, which was used to measure copper concentrations, quantifies chemical elements from the absorption of radiation by free atoms. FAAS technique uses a flame to evaporate and dissociate the copper elements in tissue samples into atoms. 32 After the atomization, copper atoms absorb the radiation and the absorption is later detected and calculated as the concentration. In contrast, rhodanine, a chelating agent, has a strong affinity for proteinaceous copper deposits.33,34 Thus, it has been suggested that it detects protein-bound copper rather than detecting the copper itself.11,35,36 Additionally, our ability to precisely define the relationship between hepatic copper staining and concentration from our data is impeded by the low number of specimens with positive copper staining. However, we think it is important to note that, in general, as copper concentration increases so does the copper-staining score. Our findings support that the assessment of hepatic copper accumulation in cats should not rely solely on the rhodanine staining or copper quantification; the two techniques should ideally be performed together. 30
This study was subject to some limitations. First, we studied archived liver specimens from a diagnostic laboratory and so we did not have the full clinical records of the cats. We also could not identify the lobe of liver specimens. A study of sample sites in dogs reported no significant difference in copper concentration between liver lobes within dogs. 37 In contrast, uneven distribution and lobar pattern have been reported in rats and humans.38–40 The specimens in our study may be collected from various lobes; thus, regional variation cannot be ruled out. Additionally, we did not have a healthy control group and instead defined a group without significant histopathologic changes of the liver. The group sizes were unequal, and the groups of cats with specific liver diseases were small, which could limit the statistical power and lead to a type II error. Future prospective studies using a well-characterized larger sample size of cats with a variety of hepatobiliary diseases are warranted.
Conclusions
Hepatic copper concentrations greater than the upper limit of the currently used RI were relatively commonly found in cats, regardless of the presence of hepatic histologic changes. It is possible that hepatic copper accumulation plays a bigger role in feline liver disease than is currently recognized. Further studies to determine the factors that influence hepatic copper staining in cats and to establish contemporary RIs for hepatic copper in healthy cats are warranted.
Supplemental Material
Appendix 1
List of specimens with positive copper staining (n = 13) and the information of individual histopathologic analysis, hepatic copper concentration, copper score and the area of copper distribution.
Supplemental Material
Appendix 2
List of specimens with copper concentrations above the upper limit of the RI (n = 37) and the corresponding information of histopathologic analysis, hepatic copper concentration, copper score and the area of copper distribution.
Footnotes
Acknowledgements
The authors acknowledge the Texas A&M Veterinary Medical Diagnostic Laboratory (TVMDL) for providing the liver specimens.
Author note
This paper was presented, in part, as an abstract at the 2019 American College of Veterinary Internal Medicine Forum in Phoenix, AZ, USA.
Supplementary material
The following files are available online:
Appendix 1: List of specimens with positive copper staining (n = 13) and the information of individual histopathologic analysis, hepatic copper concentration, copper score and the area of copper distribution.
Appendix 2: List of specimens with copper concentrations above the upper limit of the RI (n = 37) and the corresponding information of histopathologic analysis, hepatic copper concentration, copper score and the area of copper distribution.
Conflict of interest
The authors declared no potential conflicts of interest with respect to the research, authorship, and/or publication of this article.
Funding
The authors received no financial support for the research, authorship, and/or publication of this article.
Ethical approval
This work involved the use of non-experimental animals only (including owned or unowned animals and data from prospective or retrospective studies). Established internationally recognised high standards (‘best practice’) of individual veterinary clinical patient care were followed. Ethical approval from a committee was therefore not necessarily required.
Informed consent
Informed consent (either verbal or written) was obtained from the owner or legal custodian of all animal(s) described in this work (either experimental or non-experimental animals) for the procedure(s) undertaken (either prospective or retrospective studies). No animals or humans are identifiable within this publication, and therefore additional informed consent for publication was not required.
References
Supplementary Material
Please find the following supplemental material available below.
For Open Access articles published under a Creative Commons License, all supplemental material carries the same license as the article it is associated with.
For non-Open Access articles published, all supplemental material carries a non-exclusive license, and permission requests for re-use of supplemental material or any part of supplemental material shall be sent directly to the copyright owner as specified in the copyright notice associated with the article.