
Abstract
Objectives
Cytological assessment of the bone marrow is an essential tool for understanding and investigating haematological abnormalities. Sometimes it represents the only way to reach a definitive diagnosis. The purpose of this study was to provide a general overview regarding the prevalence of feline bone marrow disorders encountered in a private European laboratory setting, to classify them and to assess the differential cell counts related to such disorders.
Methods
In total, 152 bone marrow samples were classified using cytological and numerical criteria. The bone marrow cytological examinations were performed after the identification of haematological alterations, such as cytopenias, increased number of cells or suspicion of malignant blood disorders.
Results
Of the 152 bone marrow samples evaluated, 71 (46.7%) were classified as hyperplastic, primarily granulocytic and erythroid hyperplasia (50.7% and 45.1%, respectively, of the total hyperplasia); 23 (15.1%) showed dysmyelopoiesis, mainly in the form of myelodysplastic syndrome (39.1% of the total dysmyelopoiesis); 21 (13.8%) had no cytological abnormalities; 17 (11.2%) were malignant blood disorders; 15 (9.9%) had hypoplastic conditions; and two (1.3%) were miscellaneous diseases. Metastatic disease was detected in only two cases (1.3%). Differential cell counts and myeloid-to-erythroid (M:E) ratios were reported for normal, erythroid hypoplastic, erythroid and granulocytic hyperplastic and dysplastic conditions.
Conclusions and relevance
This study provides a general overview of the prevalence and incidence of feline bone marrow disorders together with ranges for differential nucleated cell counts and M:E ratios for the various conditions reported.
Introduction
Cytological bone marrow examination represents an easy, semi-invasive diagnostic tool, useful for assessing haematological disorders. The most common indications in cats are persistent non-regenerative anaemia, neutropenia, abnormal blood cell morphology or unexplained presence of immature cells in blood.1,2
In cats, blood and bone marrow disorders are more often associated with other diseases, for example retrovirus infection (feline immunodeficiency virus [FIV] and feline leukaemia virus [FeLV]), parvovirus infection (feline panleukopenia virus), or adverse drug reactions (griseofulvin, phenylbutazone, chemotherapeutic agents) and exposure to toxins (lead poisoning), but primary malignant blood disorders like myelodysplasia or leukaemia can also occur.3–5 Few studies have been performed on feline bone marrow disorders and a cytological bone marrow differential cell count has not been provided for a range of diseases affecting this tissue.6,7 The aim of the present study was to provide a general overview of the prevalence of feline bone marrow disorders encountered in a private European laboratory setting, to classify them and to report the differential cell count associated with different disorders.
Materials and methods
Feline bone marrow samples examined between January 2013 and July 2016 were retrospectively reviewed. In total, 152 bone marrow aspirate samples were classified using cytological and numerical criteria. The bone marrow cytological examinations were performed after the identification of haematological alterations, such as cytopenias, increased number of cells or suspicion of malignant blood disorders. The results of a complete blood count (CBC), including blood film examination performed within 24 h of bone marrow collection, were available for all patients. The instrumental CBC data were obtained with the haematology analyser Advia 120 Hematology System (Siemens). Anaemia, thrombocytopenia and neutropenia were diagnosed when the haemoglobin concentration was <9 g/dl, platelets <150,000/μl and neutrophils <3000/μl, respectively. Erythrocytosis, thrombocytosis and leukocytosis were diagnosed when the total erythrocyte count was >10,000,000/μl, platelet count >550,000/μl and leukocyte count >11,000/μl (with lymphocytosis considered when the total lymphocytes exceeded 6000/μl), respectively. Less than 10% of cases had concurrent bone marrow core biopsy collected. Samples were obtained from female and male cats referred for a variety of disorders and originating from several different European countries (Italy, France, Germany, Sweden, Norway, the Netherlands). Bone marrow sampling was performed almost always from proximal humerus, iliac crest or trochanteric fossa of the proximal femur, and the smears were prepared through a squash technique, immediately after sample collection of patients under deep sedation or general anaesthesia. Aspirates were stained with May–Grünwald–Giemsa.
All the bone marrow samples were reviewed by a single-board-certified clinical pathologist using a standardised method. The first step of the analysis was assessment of sample quality. Only samples with at least 8–10 unit particles (even if these particles were on multiple different slides) were included in the study. All samples of inadequate quality (ie, poor cellularity, or crushed or formalin-fixed samples) were excluded from the study. The cellularity of bone marrow samples was estimated by examining the proportion of cells vs fat presence in particles using a ×200 magnification. Normal cellularity varies between 75% and 25% cells (young and old animals, respectively) of the unit particles. 1 A differential cell count was performed by evaluating 500 nucleated cells in a monolayer within the preparations using a ×1000 magnification. For the erythroid lineage the cells were separated into rubriblasts, pro-rubricytes, rubricytes and meta-rubricytes. For the myeloid–granulocytic lineage the cells were separated into myeloblasts together with pro-myelocytes, neutrophil myelocytes, neutrophil meta-myelocytes, band/segmented neutrophils, total eosinophilic cells and total basophilic cells. Lymphocytes, plasma cells, monocytes, macrophages and blasts of lymphoid and uncertain lineage were counted separately. Megakaryocytes and their precursors were not included in the differential cell count.
The megakaryocytic lineage was evaluated at low magnification using a ×100 magnification and counting the number of megakaryocytes per particle. The degree of maturation and morphology were also assessed. The myeloid-to-erythroid (M:E) ratio was calculated as previously described.1,8
Bone marrow was considered unremarkable when bone marrow cellularity and morphology were within normal limits compared according to literature- and laboratory-established reference intervals, the number of megakaryocytes per unit particles was 3–7, the M:E ratio was 1.21–2.16:1, the rubriblasts plus pro-rubricytes were <5% of all nucleated cells and myeloblasts plus pro-myelocytes were <5% of all nucleated cells.1,8
Aplastic anaemia or bone marrow panhypoplasia was defined by the presence of pancytopenia in blood and the presence of unit particles composed of >75% adipose tissue with all cell lines under-represented or absent.6,8,9
Generalised bone marrow hyperplasia was reported when >75% of the haemopoietic space in unit particles consisted of haemopoietic cells. 6
Erythroid hypoplasia was reported when anaemia was present, as well as normal or decreased bone marrow cellularity, M:E >2.16:1, and rubriblasts plus pro-rubricytes were rare or absent.6,8–10
Pure red cell aplasia was defined as the presence of severe non-regenerative anaemia and a marked increase in the M:E ratio.6,11
Erythroid hyperplasia was reported when the bone marrow cellularity was normal or increased, the absolute blood neutrophil count was normal or increased, the M:E ratio was <1.2:1, and rubriblasts plus pro-rubricytes were >5% of all nucleated cells.8–10
Granulocytic–neutrophilic hypoplasia was defined when the bone marrow cellularity was normal or decreased, the haemoglobin and haematocrit were normal, the M:E <1.2:1, and myeloblasts plus pro-myelocytes were rare or absent.8–10
Granulocytic–neutrophilic hyperplasia was defined when the bone marrow cellularity was normal or increased, the haematocrit was normal or increased, the M:E ratio was >2.16:1, and myeloblasts plus pro-myelocytes were >5% of all nucleated cells.6,8–10
Granulocytic–eosinophilic hyperplasia was diagnosed when the number of eosinophils exceeded 6% of total nucleated cells.6,8–10
Megakaryocytic hypoplasia was defined by blood thrombocytopenia, normal total bone marrow cellularity, normal granulocytic and erythrocytic lineage cellularity and <3 megakaryocytes per low-power field or per particle.9,10,12
Megakaryocytic hyperplasia was defined by the presence of >10 megakaryocytes per low-power field or >7 per unit particle. The proportion of large mature megakaryocytes with granular eosinophilic cytoplasm compared with earlier stages of development was also evaluated.9,12
Dysmyelopoiesis was defined as a broad haematological disorder characterised by the presence of morphological or maturational abnormalities in one or more cell lineage of blood and/or bone marrow. 2 Dyserythropoiesis is a particular bone marrow disorder characterised by abnormal erythroid maturation and/or morphology. It is sometimes associated with ineffective erythropoiesis that corresponds to a particular haematological condition in which the bone marrow seems to be stimulated for the erythroid lineage, but the total erythrocyte count is decreased in the peripheral blood. The anaemia is suggested to be due to a premature, abnormal death of the erythroid cells in the bone marrow.8–10 The most important morphological abnormalities that may be observed during dyserythropoiesis are abnormal nuclear shape and chromatin pattern, megaloblastic cells, nuclear fragmentation and asynchrony in nuclear to cytoplasm maturation. Dysgranulopoiesis was defined by the presence of abnormal granulocyte maturation and/or morphology, along with ineffective granulopoiesis resulting in neutropenia in peripheral blood even if the bone marrow appeared stimulated for the granulocytic lineage.8–10 Dysmegakaryocytopoiesis was reported when maturation and/or morphological abnormalities were observed in the megakaryocytic series.8–10 Myelodysplastic syndrome (MDS) was defined by hypercellular bone marrow associated with blood cytopenias, severe qualitative anomalies (ie, abnormal chromatin pattern, prominent nucleoli and presence of mito-necrosis) of the three cell lineages and <20% of blasts in the bone marrow and blood.8,9,10,12–14
Lymphocytic hyperplasia was reported when small, normal-appearing lymphocytes exceeded 20% of total nucleated cells in association with peripheral lymphocytosis, whereas plasma cell hyperplasia was reported when isolated plasma cells exceeded 3% of total nucleated cells without any relevant bone marrow abnormalities. 8,9,10,12,15,16
Macrophage hyperplasia was diagnosed when the number of mononuclear phagocytes (monocytes and macrophages) exceeded 3% of total nucleated cells.8,9,12,15,16
Malignant blood disorders included acute and chronic lymphoid and myeloid leukaemia, as well as lymphoma infiltrating bone marrow.8,9,10,17 Acute lymphoid leukaemia was diagnosed when the lymphoid blasts were >20% of total nucleated cells in the bone marrow. Lymphoid blasts could be observed also in the peripheral blood. Chronic lymphocytic leukaemia (CLL) was diagnosed when small mature lymphocytes exceeded 20% of total bone marrow nucleated cells and a permanent and growing peripheral lymphocytosis was reported after excluding other possible causes.9,10,15 Acute myeloid leukaemia was reported when >20% of total nucleated cells in the bone marrow were myeloid blasts. Myeloid blasts could also be observed in the peripheral blood.10,12
Statistical analysis was performed using a software package (MedCalc Version 13.0.2). Ranges were defined by the 2.5 and 97.5 percentiles if the number of measured values were adequate. In addition, mean, median, SD, and maximum and minimum values were determined.18–20
Results
Fifty-five samples were excluded from this study because of inadequate quality.
In total, 152 bone marrow aspirates were analysed after the identification of a haematological alteration or suspicion of malignant blood disorders. The results of the bone marrow examination and numerical classification are reported in Table 1. The groups of hyperplasia, hypoplasia and dysplasia were subclassified into smaller classes, including generalised, megakaryocytic, erythroid and granulocytic. In the miscellaneous group macrophagic and eosinophilic hyperplasia were included, whereas in the metastasis group mast cell tumour, carcinoma, histiocytic sarcoma and sarcoma were included. Male and female subdivision was also applied for all groups.
Bone marrow cytological classification

M = male; F = female
The malignant blood disorders group was sub-classified into five classes, including acute myeloid and lymphoid leukaemia, CLL, multiple myeloma and lymphoma. No chronic myeloid leukaemia was diagnosed. The results are listed in Table 2.
Subclassification of malignant blood disorders

A bone marrow cell differential count was performed in the majority of the samples (except in case of severe aplasia or massive malignant cell proliferation).
The results of bone marrow differential counts for the samples diagnosed as normal or without cytological abnormalities (n = 21) are reported in Table 3, and their main haematological alterations are summarised in Table 4.
Nucleated cell differential count for normal bone marrow

All the values are % (except myeloid-to-erythroid [M:E] ratio)
Haematological abnormalities in cats with bone marrow differential counts within expected ranges

The results of bone marrow differential counts for the samples diagnosed as hyperplasia (n = 71) or hypoplasia (n = 15) for at least one lineage are reported in Tables 5 and 6, respectively, with the main haematological abnormalities and indications summarised in Tables 7 and 8, respectively.
Bone marrow differential cell count in hyperplastic conditions

All the values are % (except myeloid-to-erythroid [M:E] ratio)
Bone marrow cell differential count in hypoplastic conditions
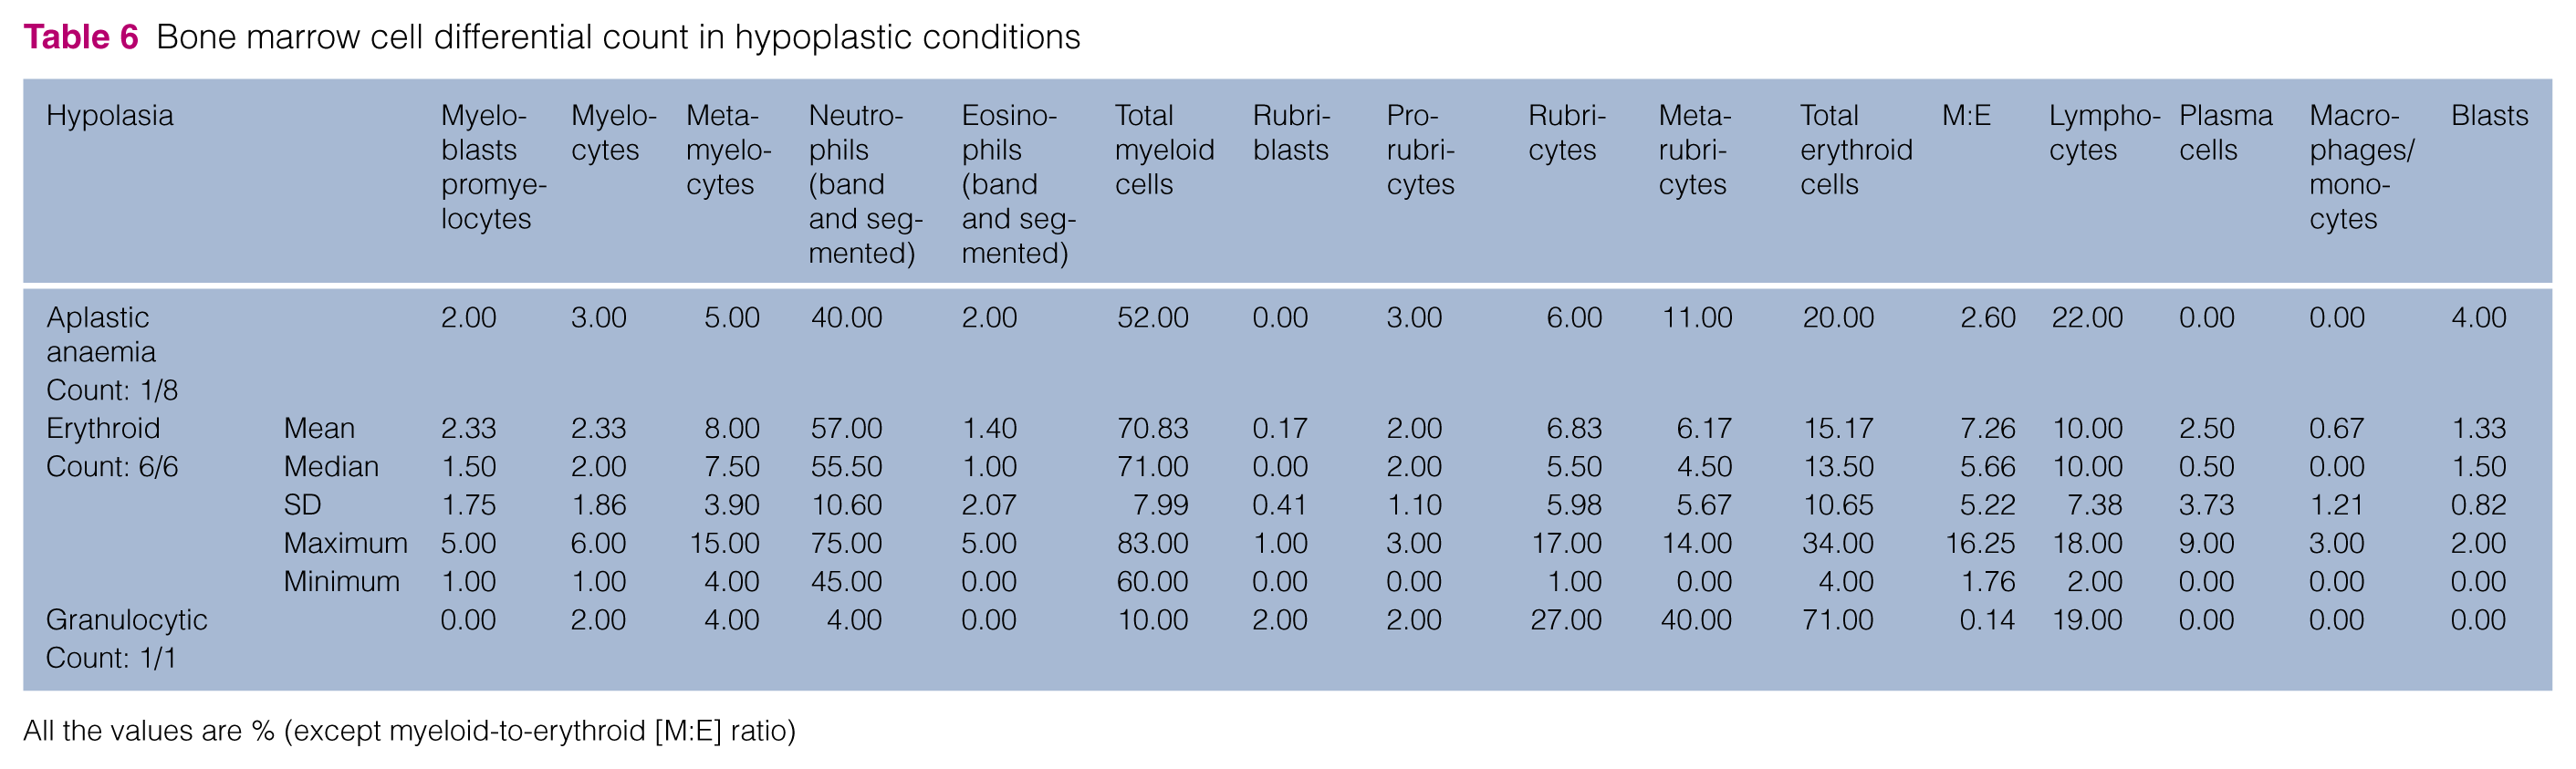
All the values are % (except myeloid-to-erythroid [M:E] ratio)
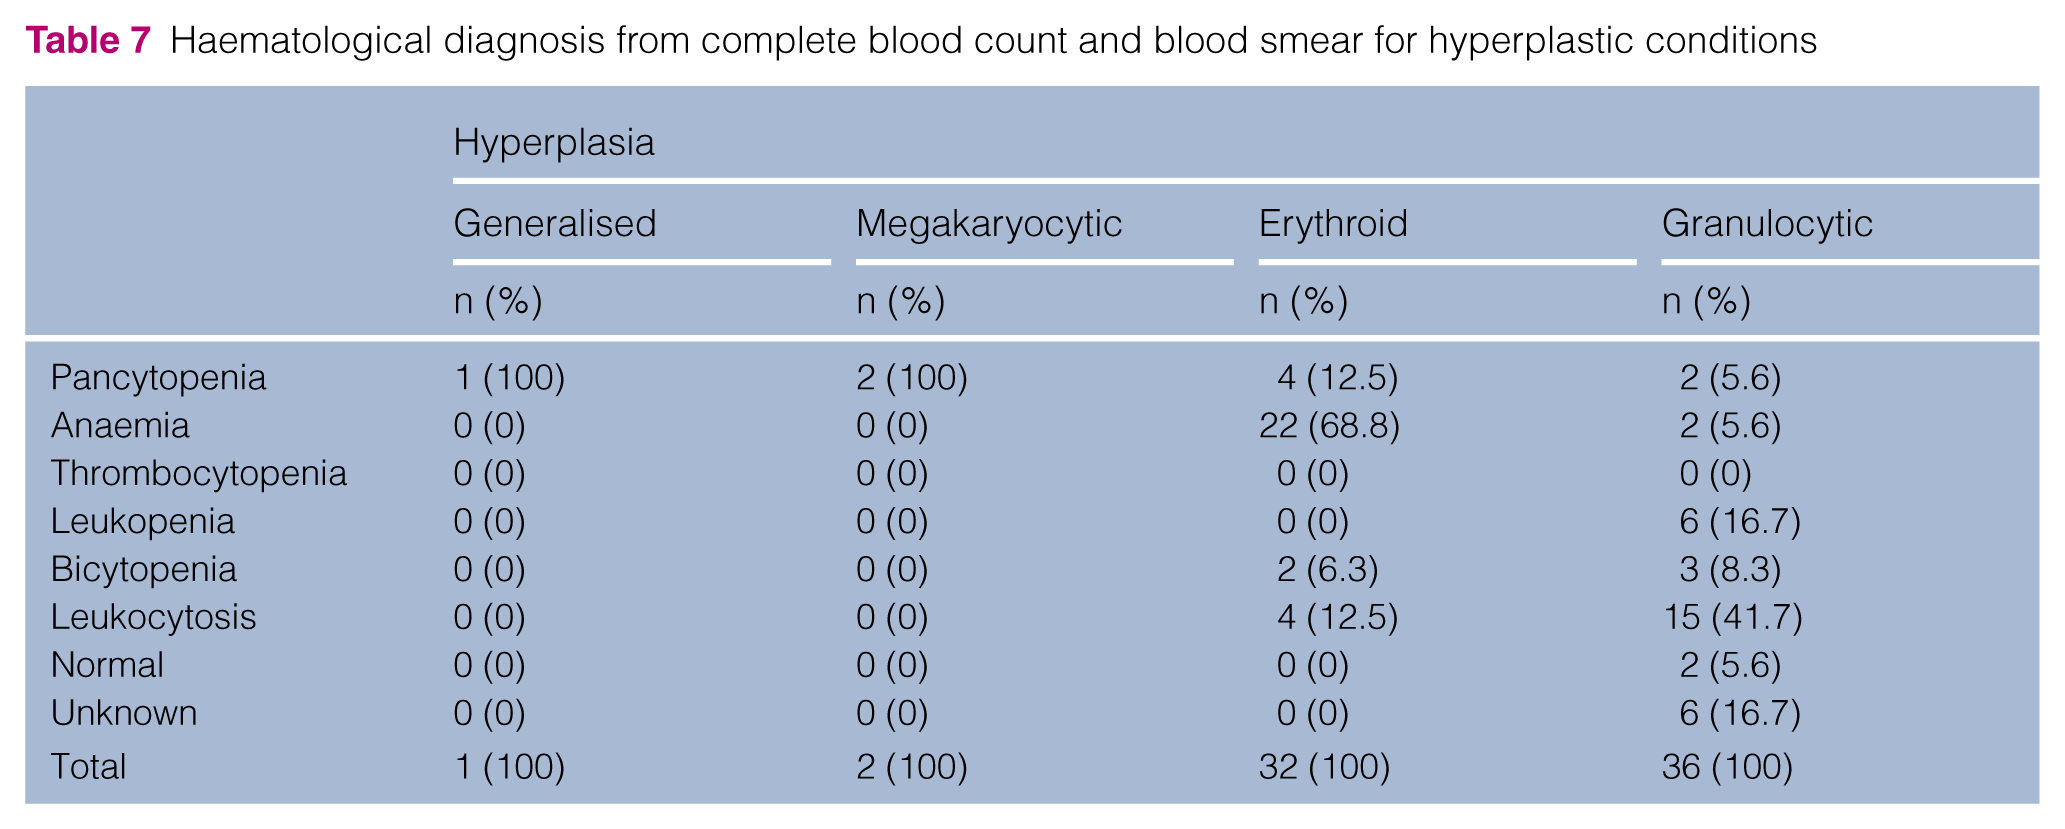
Haematological diagnosis from complete blood count and blood smear for hyperplastic conditions
Haematological diagnosis from complete blood count and blood smear for hypoplastic conditions

The dyserythropoiesis, dysgranulopoiesis and MDS differential cell counts are listed in Table 9, with the haematological abnormalities and indications for each sub-group reported in Table 10. Of the myelodysplastic sub-group, two cases (22.2%) were FeLV positive, whereas three (33.3%) were FeLV negative, one (11.1%) was vaccinated and three (33.3%) had unknown vaccination status and serological results.
Bone marrow differential cell count in dysmyelopoiesis

All the values are % (except myeloid-to-erythroid [M:E] ratio)
Haematological diagnosis from complete blood count and blood smear for dysmyelopoiesis

Discussion
Haematological disorders are frequent findings in feline medicine and can be secondary to infection (eg, FIV, FeLV or mycoplasmosis), intoxication/adverse drug effects or immunological diseases, or can be the result of a primary neoplastic condition. A complete haematological diagnostic investigation should include patient history, clinical findings, current and previous CBCs, and a complete bone marrow cytological examination that includes estimation of bone marrow cellularity, enumeration of all of the cell subpopulations, calculation of the M:E ratio and assessment of the cell morphology and other features (eg, stainable iron stores and parasites). All these data should be interpreted together.1,2 Unfortunately, because this study was conducted in a private laboratory setting, it lacks clinical information, and this could be considered a study limitation.
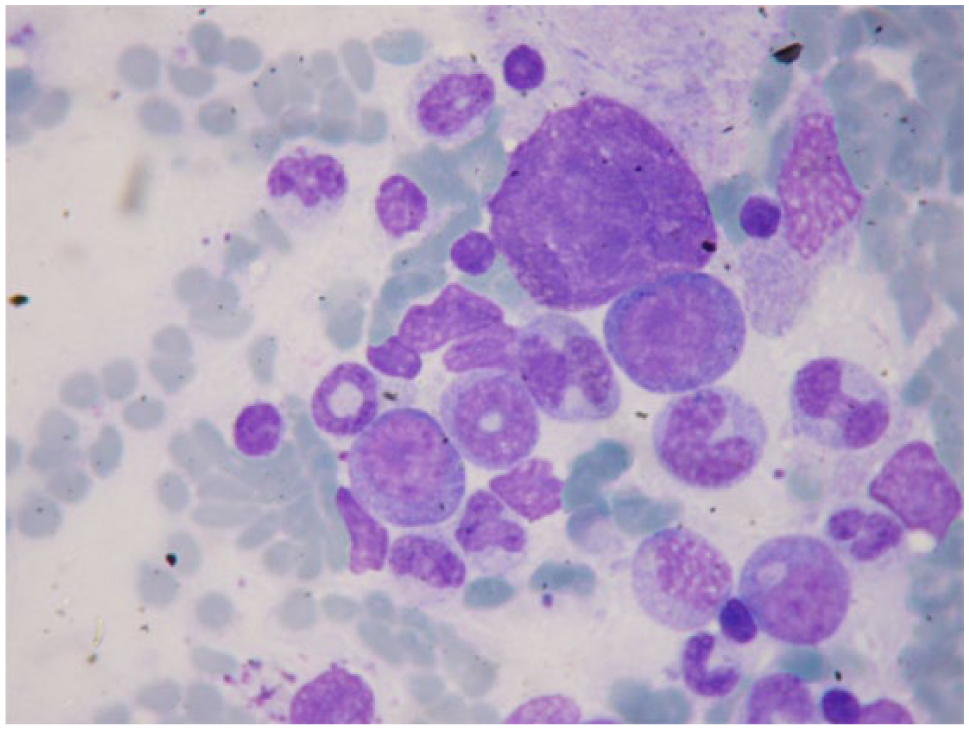
In the present study, the most represented category was hyperplasia of one or more cell lineages (46.7%) and, within this broad category, granulocytic and erythroid hyperplasia represented the most frequent diagnoses (50.7% and 45.1% of the total hyperplasia cases, respectively), whereas generalised and megakaryocytic hyperplasia appeared to be rare (1.4% and 2.8%, respectively). This finding is similar to what was previously reported by the authors in previous studies but differs from what was observed by Weiss, where granulocytic hyperplasia appeared to be very rare (1% of the non-myelodysplastic and non-malignant pathological changes).2,3,6 Because neutrophilic cells are significantly more numerous in bone marrow samples than eosinophilic or basophilic cells, the term ‘granulocytic hyperplasia’ often refers to neutrophilic hyperplasia. 9 Granulocytic hyperplasia (Figure 1) was often associated with peripheral leukocytosis (41.7% of cases) and uncommonly with peripheral leukopenia (16.7%). In contrast, erythroid hyperplasia (Figure 2) was more often associated with anaemia (68.7%) than with erythrocytosis. Erythroid hyperplasia can be effective when associated with reticulocytosis (>50,000/μl) in peripheral blood, which represents an appropriate response to a decreased erythrocyte mass (secondary to blood loss or haemolysis). 9 Erythroid hyperplasia can also be ineffective, characterised by inadequate reticulocytosis, compared with the severity of the anaemia, and often associated with peripheral erythroblastosis due to destruction of erythroid precursors or maturation arrest in bone marrow. 21 This last entity was included within the dysmyelopoiesis group, which represents the second most common category found in our study. Dyserythropoiesis and myelodysplastic syndrome were the most represented subcategories of the large dysmyelopoiesis group (47.8% and 39.1%, respectively) that included 23 cases (15.1% of all cases). This finding is similar to that described by Weiss previously, where dysmyelopoiesis cases represented 13.6% of all cases. 6 However, this finding differs significantly from what has been observed in dogs, in which dysmyelopoiesis appears to be rare and myelodysplastic syndrome very rare. 2

Feline bone marrow cytological examination. Granulocytic hyperplasia in a leukopenic, 5-year-old female cat. Note the increased number of young granulocytic precursors (myeloblasts and promyelocytes). May–Grünwald–Giemsa × 400 magnification

Feline bone marrow cytological examination. Erythroid hyperplasia in an anaemic, 5-year-old female cat. Note the increased number of young erythroid precursors (rubriblasts and prorubricytes). May–Grünwald–Giemsa × 400 magnification
Dyserythropoiesis was often associate with peripheral anaemia alone, or bicytopenia or pancytopenia (36.4%, 27.3% and 27.3%, respectively), and was characterised by the presence of morphological abnormalities of the erythroid cells and abnormal maturation of the erythroid lineage. The other cell lineages were not affected.
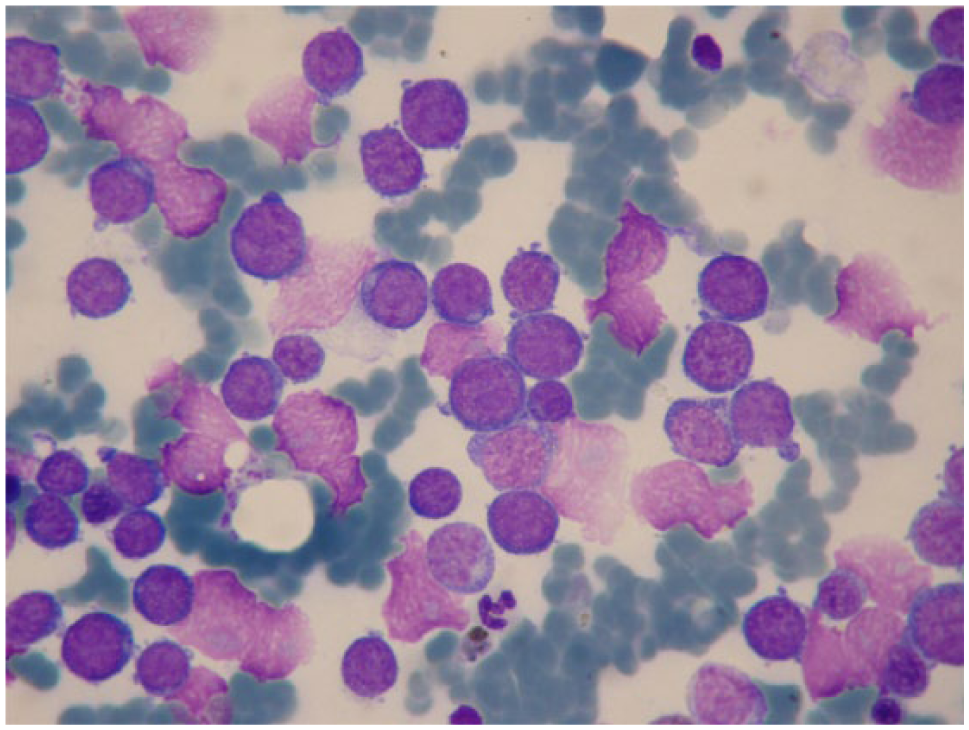
In our study, we did not subclassify MDS as has been done in other studies, but we found that the erythroid lineage was predominantly affected even if the dysplastic features involved all the three bone marrow cell lineages (Figure 3).6,13,14 MDS is always characterised by variable cytopenia and/or cytosis, and morphological abnormalities in all the cell lineages in the peripheral blood and bone marrow. In the present study pancytopenia and leukocytosis were the most representative haemogram alterations (33.3% and 33.3%, respectively), and the most important dysplastic erythroid features included fragmented and lobulated nuclei, abnormal chromatin patterns, asynchrony of nuclear and cytoplasmic maturation, visible nucleoli in rubricytes, degenerative left shift with increased number of more immature erythroid precursors and few reticulocytes in peripheral blood. The abnormal morphological features of the myeloid lineage included giant metamyelocytes, hypersegmented and hyposegmented nuclei, ‘donut form’ (Figure 4), karyorrhexis, erythroblastocytosis/haemophagocytosis and presence of atypical blasts (always <19%) in blood and bone marrow. The morphological abnormalities of the megakaryocytic lineage included multi-nucleation and nuclear fragmentation of the megakaryocytes, dwarf megakaryocytes, abnormal chromatin pattern and presence of giant or nucleated platelets in the blood smear. Feline MDS is often associated with FeLV infection. 14 In the present study only two cases (22.2%) were FeLV positive, whereas three (33.3%) were negative, one (11.1%) was vaccinated and three (33.3%) had an unknown vaccination FeLV status. In the FeLV-infected cases, the numerical and morphological alterations found in the haemogram and in the blood smear were similar to what has been already reported in another study. 22

Feline bone marrow cytological examination. Myelodysplastic syndrome in a 2-year-old male cat with leukocytosis. The chromatin pattern of the majority of the cells (both erythroid and granulocytic) is atypical with irregular clumps and prominent nucleoli. May–Grünwald–Giemsa × 1000 magnification
Feline bone marrow cytological examination. Donut form of neutrophil granulocytes in a leukopenic, 2-year-old female cat. May–Grünwald–Giemsa × 1000 magnification
The third most common category in this study was an apparently normal bone marrow without significant cytological abnormalities (13.8%). This finding is similar to what has been described by Weiss, 6 who found that 12.1% of bone marrow samples had no cytological abnormalities. In this group were included all the bone marrow samples that appeared without morphological and numerical changes (Figure 5), even if the associated haemogram was abnormal. Indeed, only 14.3% of the cases included in this group showed a normal CBC, whereas haematological alterations (including anaemia [33.3%] and leukopenia [19.1%]) were identified in the remaining cases. The lack of significant bone marrow cytological abnormalities in a cytopenic patient should also be considered a pathological finding because the absence of an adequate bone marrow response is contributing (at least partially) to the peripheral cytopenia.

Feline bone marrow cytological examination. Normal bone marrow in an anaemic, 5-year-old male cat. Both erythroid and granulocytic precursors are present without morphological abnormalities. May–Grünwald–Giemsa × 400 magnification
Malignant blood disorders (Figure 6) were diagnosed in 11.2% of cases. Interestingly, lymphoma represented the most prevalent malignancy (47.1%). This finding differed from what was previously reported by Weiss, 6 who found a 25.1% incidence of haemic neoplasia, with a predominance of acute myeloid leukaemia and a small number of lymphomas (1.5%).
Feline bone marrow cytological examination. Acute myeloid leukaemia in a 4-year-old female cat with leukocytosis. Note the monomorphic appearance of the neoplastic cell population. May–Grünwald–Giemsa × 1000 magnification
The hypoplasia category was less common (9.9%) and, within this group, aplastic anaemia represented the most frequent diagnosis (53.3%), most often associated with peripheral pancytopenia or bicytopenia (62.5% and 25%, respectively). Aplastic anaemia can be the result of drug toxicity, or infections (parvovirus, FeLV), or can be classified as idiopathic. 9 Accurate determination of bone marrow panhypoplasia requires assessment of a bone marrow core biopsy, which is not performed in all cases. 12 This can be considered a limitation of this study.
Bone marrow metastatic disease was only observed in two cases: (1) a mast cell neoplasia characterised by lymph node, blood and bone marrow infiltration with atypical mastocytes; (2) a histiocytic sarcoma characterised by 20% of atypical histiocytic cells, erythroid hyperplasia and haemophagocytic syndrome in the bone marrow. Peripheral pancytopenia was observed in both cases.
Another interesting finding of this study was the presence of blasts of unknown origin in some bone marrow conditions like erythroid hyperplasia, MDS and dyserythropoiesis, where they reached a maximum of 6%, 19% and 19%, respectively. In the bone marrow of healthy animals, blasts are rarely observed, and they are often of lymphoid origin. 1
Bone marrow differential counts and M:E ratio were performed for many types of cytological subclassification, whenever possible. Interestingly, we found that the total lymphocyte count could exceed the cut off of 20% in some particular conditions like erythroid or granulocytic hyperplasia, MDS, dyserythropoiesis and dysgranulopoiesis, where they could reach a maximum of 35%, 22%, 26%, 30% and 22%, respectively. 1 They also could be increased in normal bone marrow with a maximum of 30%, but without associated peripheral lymphocytosis. This confirms that neither the total number of lymphocytes in the blood, nor the percentage of lymphocytes in the bone marrow can clearly differentiate a reactive lymphocytosis from a CLL. 15 Moreover, it is important to note that an increased number of well-differentiated small lymphocytes in normal and granulocytic hyperplasia bone marrow samples cannot lead to a significant alteration in the M:E ratio. Lymphocytes, in fact, were not included in the calculation of M:E ratio and were counted separately, but when they were numerous they could affect the ratio by decreasing the number of myeloid and erythroid cells counted.
Concerning the M:E ratio, we found the lowest values in the erythroid hyperplasia category where it could reach a minimum of 0.08 and the highest values in the erythroid hypoplasia category, where it could reach a maximum of 16.25. In our normal bone marrow group, the M:E ratio varied from 0.31 to 3.18, which differs from what has been reported by Jain. 7 However, it is important to outline that the reference interval reported by Jain was only based on a small number of cats (n = 7). 7 As already mentioned, a bone marrow without significant cytological abnormalities in association with numerical alterations of the haemogram cannot be considered truly normal. In this study, all bone marrow cytological samples were not evaluated and classified considering only numerical aspects, and also contextually with the overall impression of the cell population, the haemogram data and the quality of the sample (ie, haemorrhagic samples). Finally, another important finding emerged from the present study (even if it was observed in a small number of cases): a sex difference for the various conditions was not observed with the exception of aplastic anaemia where females were three times more represented than males, and MDS, where males were over-represented (3.5 times) vs females. A prolonged exposure to high endogenous oestrogen concentration has already assessed as a potential cause of aplastic anaemia in dogs and ferrets. 1 Perhaps a toxic effect of oestrogens can also be suspected in cats. Concerning the prevalence of males in MDS, our finding is similar to what was previously reported, but any possible link or pathological mechanism has not been hypothesised so far. 14
Conclusions
Cytological assessment of bone marrow can provide useful information to help understand the pathogenesis of the haematological abnormalities identified on CBC, and is often an essential tool to reach a definitive diagnosis of haematological disorders. This study provides a general overview regarding the prevalence and incidence of feline bone marrow disorders together with ranges for differential nucleated cell counts for each pathological condition. This, together with morphological analyses, can be useful to assess the degree of bone marrow stimulation or depression during a state of cytopenia, cytosis, infection and/or neoplasia. Moreover, this study outlines a high incidence of granulocytic and erythroid hyperplasia and dysmyelopoiesis.
To our knowledge, this is the first study to provide ranges for each bone marrow–haematological alteration/condition, and modifies the current values for normal bone marrow.
Footnotes
Conflict of interest
The authors declared no potential conflicts of interest with respect to the research, authorship, and/or publication of this article.
Funding
The authors received no financial support for the research, authorship, and/or publication of this article.