
Abstract
Objectives
The aim of this study was to evaluate whether the frequency of electrophoretic changes in serum of cats with feline infectious peritonitis (FIP) changed in recent years vs past years.
Methods
Agarose gel electrophoresis (AGE) and capillary zone electrophoresis (CZE) from cats with FIP and healthy cats recorded in the periods 2004–2009 and 2013–2014 were retrospectively analysed. Relative and absolute values of each electrophoretic fraction were recorded and the number of cats showing single or combined electrophoretic changes consistent with FIP (hypoalbuminaemia, inverted albumin to globulin [A:G] ratio, increased total protein, total globulin, alpha [α]2-globulin and gamma [γ]-globulin concentration) were counted. Additionally, a visual analysis of electrophoretograms was also performed. Results for the two time periods were statistically compared.
Results
The details of 91 AGE procedures (41 from cats with FIP and 50 from healthy cats) and 45 CZE procedures (26 from cats with FIP and 19 from healthy cats) were obtained from the database. No significant differences between the two time periods were found both in FIP and in healthy cats analysed with CZE and in healthy cats analysed with AGE. Compared with 2004–2009, cats with FIP sampled in 2013–2014 with AGE showed a significantly lower concentration of total protein, γ-globulins and total globulins, and a significantly higher A:G ratio and percentage of albumin and α2-globulins. Using both AGE and CZE, in recent years the proportion of cats with high α2-globulins without gammopathy and the proportion of cats with gammopathy alone decreased. With a visual approach, the number of patterns considered as dubious increased in the second period with AGE (non-statistically significant).
Conclusions and relevance
The frequency of electrophoretic abnormalities in cats with FIP decreased in recent years, independently of the technique employed. Although the mechanism responsible for this change was not investigated in this study, this altered frequency may decrease the diagnostic accuracy of serum protein electrophoresis for FIP.
Introduction
Serum protein electrophoresis (SPE) is a classic indirect test used to support the diagnosis of feline infectious peritonitis (FIP).1–4 One of the most supporting findings for the diagnosis of FIP is the increased total protein concentration in serum, along with a decreased albumin to globulin (A:G) ratio. 1 The FIP electrophoretic pattern is typically characterised by an increase in the alpha (α)2- and the gamma (γ)-globulin fractions.5,6 In experimentally induced FIP, the α2-globulin fraction rapidly increases owing to the increased plasmatic concentration of acute-phase proteins. The γ-globulin fraction increases after about 2 weeks, when the humoral immune response that will lead to seroconversion in about 3 weeks is ignited, 7 and when the clinical signs occur. 2 Abnormal electrophoretic patterns were recently found in 95.1% of cats affected by FIP, 8 the majority of which showed an increased γ-globulin fraction, while α2-globulins were less frequently increased. Even if a polyclonal gammopathy can be found in diseases other than FIP, lowering its specificity, SPE is a useful test with which to support the diagnosis of FIP. 5 Recently, a high number of FIP cases not showing the typical pattern described in the literature were recorded in our caseload. Specifically, cats with immunohistochemically confirmed FIP often showed the presence of only some of the electrophoretic alterations typical of FIP and, in some cases, no alterations at all.
The aim of this study was to assess the frequency of electrophoretic patterns not consistent with FIP in cats with FIP sampled in recent years (2013–2014) compared with a less recent time period (2004–2009), when cats with FIP frequently showed the typical electrophoretic alterations mentioned above.
Materials and methods
Retrospective search of the database
For each sample, serum was obtained by centrifugation (10 mins at 2500 × g) of blood collected in plain tubes. The database of our laboratory was retrospectively analysed. All the results from 2004–2014 were downloaded in an Excel spreadsheet (Microsoft) for the following selection procedures. Electrophoresis on samples collected for diagnostic purposes between 2004 and 2007 were performed on sera stored and frozen at −20°C on which electrophoresis had been already performed using other procedures (cellulose acetate electrophoresis) at the time of sampling. Frozen samples from 2004–2009 were thawed and re-tested during 2008–2009. On samples collected in 2008, 2009, 2013 and 2014, SPE was performed for diagnostic purposes immediately after sampling or on samples frozen for no more than 1 week.
Electrophoretic methods
Data referred to capillary zone electrophoresis (CZE) or to agarose gel electrophoresis (AGE) were retrieved from the database. Results referred to the two techniques were analysed separately.
AGE was performed using an automated system and kits provided by the manufacturer (Sebia Italia Srl). After the manual loading of 10 μl of each serum sample in the applicator, a 0.8% agarose gel was run in trisbarbital buffer at pH 8.6, with a migration time of 7 mins at 20 W Gels were then dried (10 mins at 65°C), automatically stained with Amido Schwarz, destained and dried again for scanning by the appropriate gel scanner. Data were then transferred to the software (Phoresis; Sebia Italia Srl), which analyses the density of each band, creates a corresponding peak and separates each fraction based on the slopes of the curves.
CZE was performed using the Minicap automated analyser (Sebia Italia Srl) according to manufacturer’s instructions. Serum samples were aspirated from the anode end of a silica capillary; proteins were then separated at 35°C by migration for 2.5 mins at high voltage (9000 V) in an alkaline buffer (pH 9.9). Variations of absorbance due to the protein flow were read through a spectrophotometer at a wavelength of 240 nm and recorded in real time by the same software as above, producing the typical electrophoretic peaks.
For both the techniques, albumin, and α1-, α2-, beta β1-, β2- and γ-globulin fractions were generated. For the purpose of this study, only data regarding electrophoretic fractions important for the diagnosis of FIP (total protein, albumin, α2-, and γ-globulin, total globulin and A:G ratio) were recorded and statistically analysed.
For both the techniques, electrophoretograms were visually inspected by a trained staff member in order to correct the possible errors in fractions separation generated by the software. Peaks were assigned to the different fractions as recommended by previous studies on AGE and CZE.9,10 Absolute protein concentrations (g/dl) for each electrophoretic fraction were calculated based on the percentage of the area under each peak and on total serum protein concentrations measured through an automated spectrophotometer (Cobas Mira; Roche) using the biuret method, 10 except for six cases (five processed with AGE and one with CZE) where total proteins were not measured. In these cases, only the percentages of the different fractions were included in the statistical analysis.
Inclusion criteria
Data regarding SPE were included in the study only when a final diagnosis was achieved based on other data recorded in the database (clinical information regarding the follow-up, haematology, clinical biochemistry, effusion analysis, necropsy, histology and immunohistochemistry). All the samples for which a final diagnosis was not available were excluded from the study.
Based on these criteria, data regarding SPE were divided in two groups: (1) FIP – cats with necropsy and histology consistent with FIP, and with intralesional coronaviruses detected by immunohistochemistry; (2) healthy cats – samples included in this group were submitted for annual wellness visits or for preoperative examinations or were included as a control group in previous studies,11,12 and had unremarkable clinical or laboratory findings.
Statistical analysis
Statistical analysis was performed in an Excel spreadsheet using the Analyse-it v-2.1 software.
Results obtained in the two time spans (2004–2009 vs 2013–2014) from FIP and healthy cats were compared with each other using a non-parametric t-test for independent measurements (Mann–Whitney U-test). The significance level was set at P <0.05.
For the two time periods examined in this study, the number of cats from the FIP group showing single or combined electrophoretic changes consistent with FIP was counted.6,10 The relative and absolute value of the electrophoretic parameters listed above (expressed as percentage and g/l, respectively) were compared with the reference intervals described in a previous study for AGE and CZE. 10
In addition, each electrophoretogram obtained from FIP cats underwent visual analysis performed by two operators blinded to the procedures. Electrophoretograms were interpreted as ‘consistent with FIP’ if showing both α2- and γ-globulin polyclonal peaks; as ‘dubious’ if showing only one of the mentioned peaks; and as ‘not consistent with FIP’ if α2- and γ-globulin polyclonal peaks were both absent or if alterations typical of other diseases (eg, monoclonal gammopathy) were detected (Figure 1). In the case of disagreement between the two observers, electrophoretograms were re-evaluated by the two observers to reach a final consensual interpretation.

Examples of electrophoretograms considered (a,d) not consistent with feline infectious peritonitis (FIP), (b,e) dubiously consistent with FIP and (c,f) consistent with FIP, performed with (a–c) agarose gel electrophoresis and (d–f) capillary zone electrophoresis. (a,d) No electrophoretic abnormality; (b,e) α2-globulin but not γ-globulin increased; (c,f) both α2- and γ-globulin are increased
Both the comparison with reference intervals and the visual analysis were used to calculate the number of FIP cats with electrophoretic pattern consistent with FIP in order to calculate the sensitivity of the method.
A Pearson χ2 analysis was used to evaluate the possible differences in the proportion of changes consistent with FIP either in terms of relative or absolute changes compared with the reference intervals or in terms of visual analysis.
Results
Retrospective search and final caseload
From a database of 4786 electrophoresis procedures, 723 AGE and 446 CZE tests on feline samples were selected. The following selection procedures led to a final caseload of 91 AGE and 45 CZE samples, as reported in Figure 2. A similar proportion of effusive and non-effusive forms was found in the two study periods either for AGE (dry forms = 3/17 [17.6%] in the first period; 5/24 [20.8%] in the second period) or for CZE (2/10 [20.0%] in the first period; 4/16 [25.0%] in the second period).

Flow diagram summarising the selection of cases from the database. *Absence of a final diagnosis; samples collected outside the study period (2004–2009 or 2013–2014); wrong/difficult separation of fractions. SDS-AGE = sodium dodecyl sulfate agarose gel electrophoresis; FIP = feline infectious peritonitis
Comparison between results obtained in the two study periods in healthy cats and in cats with FIP
Results about the comparison of each electrophoretic fraction obtained in the two study periods are reported in Table 1.
Comparison of each electrophoretic fraction between the two study periods in cats with feline infectious peritonitis (FIP) and healthy cats analysed with agarose gel (AGE) and capillary zone (CZE) electrophoresis

Results are presented as mean ± SD, median (in brackets) and I–III interquartile intervals
n = 14 for values in g/dl
n = 22 for values in g/dl
n = 9 for values in g/dl
P <0.001 vs 2004–2009
P <0.05 vs 2004–2009
P <0.01 vs 2004–2009
A:G = albumin to globulin
Using AGE, no significant differences between the study periods were found in healthy cats. Conversely, in cats with FIP, the concentration of total protein and the concentration and the percentage of total and γ-globulin were significantly lower, while the percentage albumin, α2-globulins and the A:G ratio were significantly higher in recent years (2013–2014) compared with the earlier period (2004–2009).
Using CZE, no significant differences were found between the two study periods, either in cats with FIP or in clinically healthy cats.
Frequency of electrophoretic alterations in comparison with reference intervals
In the first period (2004–2009) all the cats with FIP tested with AGE and most of the cats with FIP tested with CZE had hyperproteinaemia (Table 2), while the proportion of cats with FIP and hyperproteinaemia was lower in the second period, with a significant difference found for AGE.
Frequency of electrophoretic alterations compared with the reference intervals
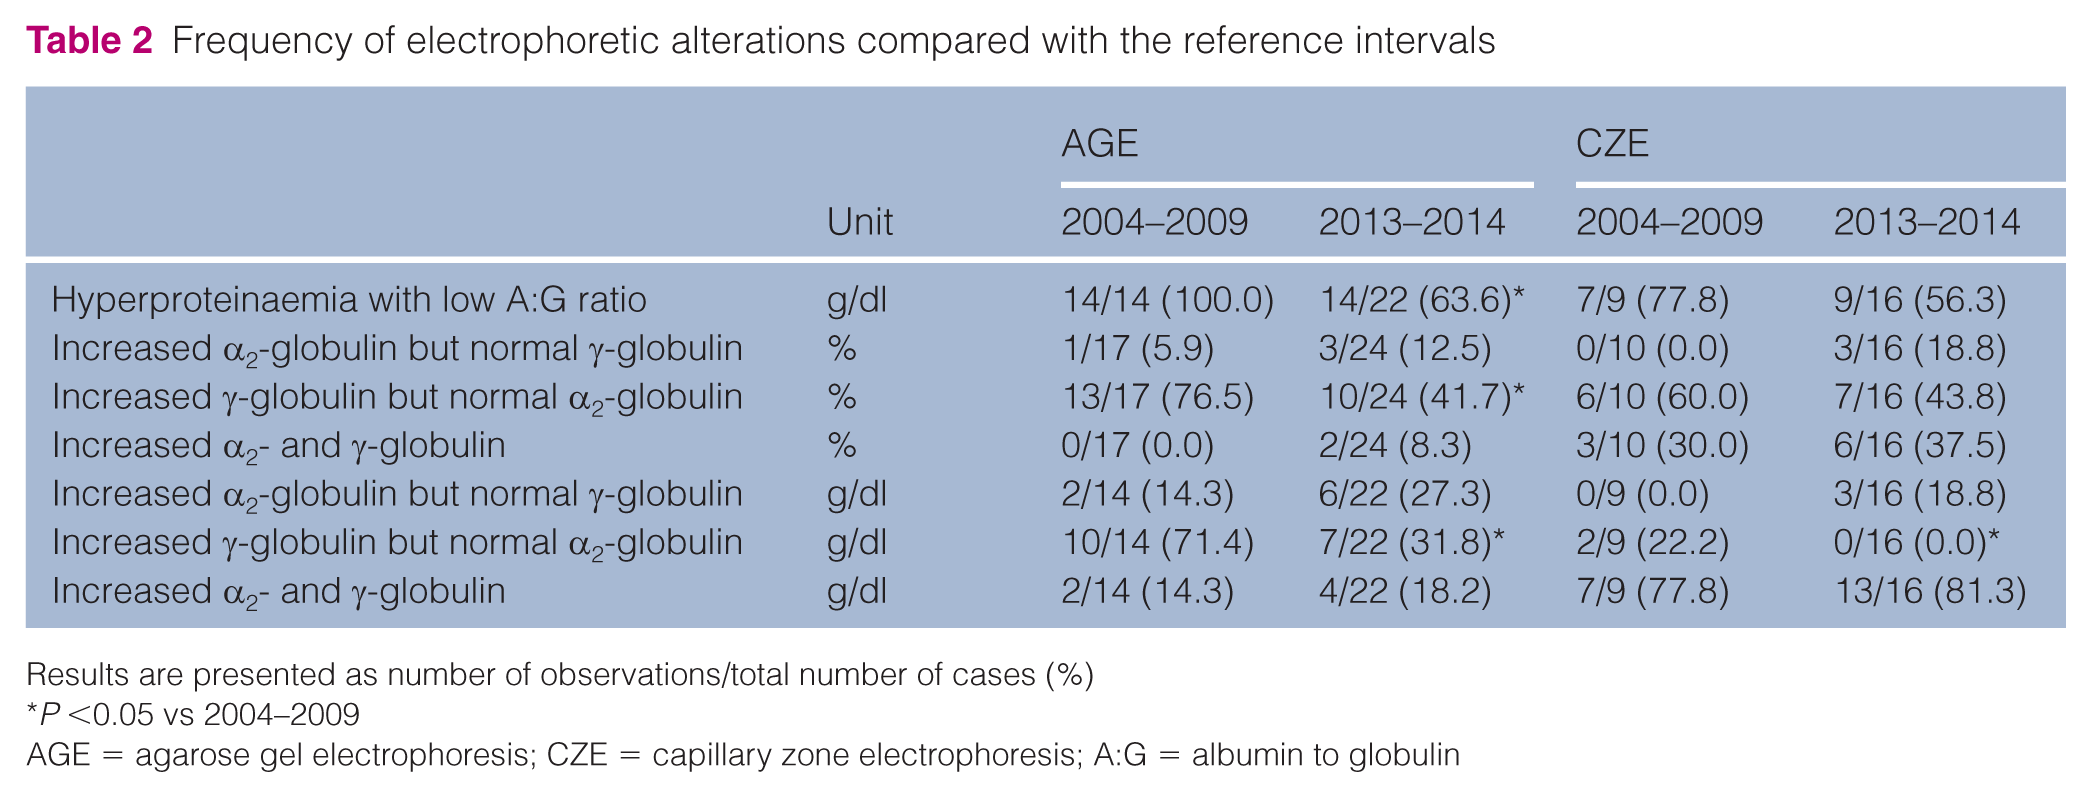
Results are presented as number of observations/total number of cases (%)
P <0.05 vs 2004–2009
AGE = agarose gel electrophoresis; CZE = capillary zone electrophoresis; A:G = albumin to globulin
Independently of the electrophoretic technique, the proportion of FIP cats with a simultaneous increase of α2- and γ-globulin was similar in the two study periods, while in the second period a higher rate of cases characterised by an increase of α2-globulins without gammopathy and a lower rate of cases characterised by gammopathy but not by the increases of α2-globulin was found. In this latter case, a significant difference was found for percentage values in samples processed by AGE, and for absolute values in samples processed with both the techniques.
Visual interpretation of electrophoretograms in the two time spans
The agreement between the two operators resulted absolute (100%) for both AGE and CZE. Using AGE, only half of the FIP cats showed the typical pattern of FIP, while this proportion increased using CZE, confirming that the sensitivity of this test is not absolute (Table 3). The diagnostic sensitivity of SPE was similar in the two time spans examined, while the number of the dubious patterns increased in the second period with AGE but not with CZE. However, all these differences were not statistically significant.
Results of the visual interpretation analysis performed by two operators on the electrophoretograms of cats with feline infectious peritonitis (FIP)

Results are presented as number of observations/total number of cases (%)
AGE = agarose gel electrophoresis; CZE = capillary zone electrophoresis
Discussion
The diagnosis of FIP is still challenging and several tests are necessary to reach a provisional diagnosis in vivo. 1 A high total protein concentration and a low A:G ratio (<0.8) are often found in cats with FIP.13,14 Moreover, a simultaneous increase of α2- and γ-globulins is considered peculiar for FIP. 6 Serum protein electrophoresis is therefore a useful diagnostic tool to support a clinical diagnosis of FIP. In this study, the performances of SPE were retrospectively studied in order to understand if electrophoretic patterns not consistent with FIP, anecdotally observed in recent years in our laboratory in FIP cats, were really more frequent than in the past. In order to exclude that the possible difference between periods depends on the technique, either samples processed with AGE or with CZE were investigated.
In addition, in order to assess whether the possible differences observed over time may depend on variations on the analytical performances of the instruments or of the methods, samples from healthy cats tested with both methods in the two periods of time were also analysed. This latter comparison showed no statistically significant differences among the time spans, even if in a few cases in both periods relative or absolute values of some fractions were outside the reference intervals. This latter finding was moderate (<5% deviation from the reference limits) and may therefore be imputable to the analytical variability of the method, 10 and mostly occurred in Abyssinian cats, Norwegian Forest cats or Siberian cats, which are known to have electrophoretic values slightly different from the reference intervals of our laboratory.11,12 Hence, the absence of statistically significant differences between the time spans for both AGE and CZE in healthy cats demonstrates that any possible difference found in FIP cats over time are unlikely imputable to changes in the analytical performance of the technique.
In the FIP group, the percentage of effusive and non-effusive forms was similar for the two electrophoretic techniques examined in this study, with a higher but constant proportion of effusive forms, confirming the higher prevalence of effusive forms, 6 and showing that changes in the electrophoresis patterns are unlikely associated with a different rate of effusive vs non-effusive FIP. Moreover, the proportion of samples retrospectively analysed after freezing and analysed with the two techniques was similar in the two periods, excluding that differences in the patterns could be associated with storage artefacts, which are known to affect SPE minimally.15,16
Regarding FIP cats tested with AGE, total protein concentration was significantly lower in the recent period in comparison with the previous one. In addition, total protein concentrations in the recent period were frequently close to or lower than the interval references established in our laboratory, confirming what has been reported by Riemer et al, 14 who described that hyperproteinaemia was present in only the 17.5 % of FIP cats, while the proportion of hyperproteinaemic cats was higher (39% of FIP cats) in previous studies. 3 The concentrations of albumin and α2-globulins were significantly higher in the recent period – but only in terms of percentage values. Conversely, both the relative and the absolute concentrations of total and γ-globulins were significantly lower in the second period. Therefore, the A:G ratio was significantly higher and frequently within the reference interval in FIP cats in the second period, in contrast with what was reported by Sparkes et al, 5 who recorded a high prevalence of low A:G ratio in FIP cats.
The analysis of results obtained with CZE revealed the same trends over time either for total proteins and for electrophoretic fractions, but the differences were not statistically significant, likely because of the lower number of cases and to a skewed distribution of data, as evidenced by the differences between mean and median values. The lack of statistical significance may also depend on the fact that samples analysed with CZE were different from those analysed with AGE and often characterised by a lower total protein concentration. However, the presence of a similar trend suggests that with a larger caseload the results of CZE, as for AGE, may become statistically significant.
Along with the statistical comparison between periods, the comparison with the reference intervals in the two periods also confirmed that the proportion of electrophoretic alterations in FIP cats for both the electrophoretic techniques was higher in the first period. This is also the case with a different statistical significance between AGE and CZE, likely owing to the different numbers of samples in the caseload. While hyperproteinaemia was frequent in the first period, this alteration was less frequent in the recent time period. The most frequent difference between the two periods was the decreased frequency of hypergammaglobulinaemia, which is known to be the most typical finding in FIP cats. 6 Another interesting aspect was the increased percentage in the second period, and for both the techniques, of increased α2-globulins not associated with a concurrent gammopathy. Theoretically, the absence of the gammopathy may be imputable to the time of sampling as experimental studies showed that γ-globulins increase a couple of weeks later than the increase of α2-globulins. 2 In the current study, in two cats with increased α2-globulin and normal γ-globulins tested in the first period of time (one with AGE and one with CZE), the gammopathy appeared when electrophoresis was repeated 2 weeks later. Conversely, three cats with the same electrophoretic profile tested in the second period (two with AGE and one with CZE) did not develop the gammopathy in samplings repeated in the following month (data not shown). This suggests that in the second period the high frequency of increased α2-globulin in the absence of gammopathy does not depend on the stage of the disease.
The results of this study seem to indicate a less intense antigenic stimulation in FIP cats, reflected by γ-globulin concentrations lower than in the past and closer to the reference intervals of our laboratory. This finding is likely related to a lower concentration of immunoglobulins, which are the most relevant proteins known to migrate in the gamma region. 16 A possible explanation for this finding is a variation of the host–coronavirus interactions, possibly due to changes in viral immunogenicity and/or to the development of a different immune response of the feline population analysed. The design of this study does not allow investigation of this pathogenic aspect, but our results are encouraging and will help to design future studies on the characteristics of viral populations recently isolated or on host–virus interactions. Conversely, results on repeated samplings tend to exclude the possibility that the differences reported over time depend on an earlier identification of clinical signs as compatible with FIP by the referring veterinarians and, consequently, on the analysis of samples collected in an early stage of disease, when the antigenic response has not yet been triggered. Also, the possible effect of drug administration seems unlikely as samples were submitted before starting any treatment.
Even if the possible reasons for these changes cannot be investigated in this study, it is important to highlight how the absence of the typical electrophoretic alterations could affect the interpretation of electrophoretograms and the diagnosis of FIP, especially in its non-effusive form. In fact, in this latter form tests on effusions (eg, immunofluorescence, Rivalta’s test, delta total nucleated cells measurement, reverse transcriptase PCR or quantitative PCR), which are known to be very accurate,17–19 are not available. Regarding this aspect, the visual interpretation performed on the electrophoretic patterns pointed out the low sensitivity of this approach for the diagnosis of FIP and also how the ‘dubious patterns’ (eg, the presence of one of the typical alterations for FIP alone) increased in the second period for AGE. The results obtained in this study with AGE were slightly discordant with those obtained with CZE, likely owing to the higher resolution typical of this latter technique, 10 which allows the detection of higher and narrower peaks that may thus become visually evident when percentage or absolute values are closer to or lower than the upper reference limits. This information suggests that CZE, probably owing to its analytical properties, may have a better sensitivity than AGE, especially in identifying the gammopathy, which seems to be less frequent in FIP cats in the recent time period.
Conclusions
The present study has shown that hyperproteinaemia and hypergammaglobulinaemia in FIP cats were less noticeable in recent years, either in terms of statistical comparison between the two time spans or in terms of comparison with reference intervals or visual analysis. It could be interesting to investigate the causes of these changes, as the decreased frequency of gammopathy may decrease the sensitivity of this test for FIP and it may suggest changes in the virus–host interaction.
Footnotes
Conflict of interest
The authors declared no potential conflicts of interest with respect to the research, authorship, and/or publication of this article.
Funding
The authors received no financial support for the research, authorship, and/or publication of this article.