
Abstract
Objectives
The aim of the study was to evaluate whether a handheld creatinine analyser (StatSensor Xpress; SSXp), available for human patients, can be used to measure creatinine reliably in cats.
Methods
Analytical performance was evaluated by determining within- and between-run coefficient of variation (CV, %), total error observed (TEobs, %) and sigma metrics. Fifty client-owned cats presenting for investigation of clinical disease had creatinine measured simultaneously, using SSXp (whole blood and plasma) and a reference instrument (Konelab, serum); 48 paired samples were included in the study. Creatinine correlation between methodologies (SSXp vs Konelab) and sample types (SSXpwhole blood vs SSXpplasma) was assessed by Spearman’s correlation coefficient and agreement was determined using Bland–Altman difference plots. Each creatinine value was assigned an IRIS stage (1–4); correlation and agreement between Konelab and SSXp IRIS stages were evaluated.
Results
Within-run CV (4.23–8.85%), between-run CV (8.95–11.72%), TEobs (22.15–34.92%) and sigma metrics (⩽3) did not meet desired analytical requirements. Correlation between sample types was high (SSXpwhole blood vs SSXpplasma; r = 0.89), and between instruments was high (SSXpwhole blood vs Konelabserum; r = 0.85) to very high (SSXpplasma vs Konelabserum; r = 0.91). Konelab and SSXpwhole blood IRIS scores exhibited high correlation (r = 0.76). Packed cell volume did not significantly affect SSXp determination of creatinine. Bland–Altman difference plots identified a positive bias for the SSXp (7.13 μmol/l SSXpwhole blood; 20.23 μmol/l SSXpplasma) compared with the Konelab. Outliers (1/48 whole blood; 2/48 plasma) occurred exclusively at very high creatinine concentrations. The SSXp failed to identify 2/21 azotaemic cats.
Conclusions and relevance
Analytical performance of the SSXp in feline patients is not considered acceptable. The SSXp exhibited a high to very high correlation compared with the reference methodology but the two instruments cannot be used interchangeably. Improvements in the SSXp analytical performance are needed before its use can be recommended in feline clinical practice.
Introduction
Chronic kidney disease (CKD) is highly prevalent within the feline population, affecting up to 20% of clinic-attending cats, with increasing incidence with age.1,2 The disease is invariably progressive and remains an important cause of morbidity and mortality, particularly within the geriatric population.3–5 Recent literature has explored the incidence of occult, hospital-acquired, acute kidney injury and identified a prevalence within the feline population of up to 21.2%. 6 Despite a trend towards evaluating more sensitive serum and urine biomarkers of renal disease, creatinine remains an important diagnostic marker.7,8
Point-of-care (PoC) creatinine testing has found utility in human medicine in both screening programmes for the prevalence of CKD and early identification of kidney injury in at-risk patients.9–11 PoC analysers typically have small sample requirements and a rapid turnaround time, providing real-time clinical information.11–15
A PoC creatinine analyser is an attractive tool in feline clinical practice, given the high incidence of CKD in this species and their relative risk of kidney injury. Various publications have assessed the use of PoC creatinine analysers in human medicine and a single abstract reports their use in dogs. 16 To our knowledge, such devices have not previously been evaluated in cats. We evaluated a handheld analyser that is available for use in human patients: the StatSensor Xpress-i Creatinine Hospital Meter (SSXp; Nova Biomedical). The aims of this study were: (1) to perform imprecision studies using the SSXp to determine whether device performance was acceptable for the measurement of creatinine in cats; and (2) to compare the results obtained from clinical samples using the SSXp to those generated from a commercial high-throughput wet chemistry analyser (Konelab PRIME 60; Thermo Scientific). Ethical approval was granted for the study by the University of Bristol’s ethics committee.
Materials and methods
Clinical cases and samples
Privately owned cats presented to The Feline Centre at Langford between January 2013 and January 2014 for investigation of clinical disease were eligible for inclusion. Blood (1.5–3.0 ml, jugular venepuncture) was collected into an EDTA tube (TEKLAB, 0.5 ml) for routine haematology and a non-anticoagulant (plain) tube (BD Vacutainer, 1.0–2.5 ml) for serum biochemical analysis, which included creatinine measurement using the Konelab analyser (Konelabserum). The remaining blood was used for immediate creatinine measurement by the SSXp (1.2 µl whole blood [SSXpwhole blood]) and then to fill a microhaematocrit tube (NRIS microhaematocrit tubes, soda lime glass Na-heparinised [80 IU/ml]; Vitrex Medical) to enable centrifugation for determination of packed cell volume (PCV) and measurement of creatinine in the supernatant plasma using the SSXp (SSXpplasma).
Icteric, haemolysed or lipaemic samples were excluded from analysis owing to known interferences of bilirubin, haemoglobin and lipaemia with the creatinine methodology employed by the Konelab, and the lack of information regarding the effect of these interferences on the SSXp methodology. 17
For the imprecision studies, a pooled serum sample was created using excess serum from clinical samples, stored in frozen aliquots; this sample was first analysed in duplicate using the Konelab to confirm that the creatinine concentration was within the analytical range of the SSXp.
SSXp
The SSXp is a small handheld battery-powered device that utilises amperometric methodology, detecting H2O2 elimination from an immobilised three-enzyme membrane. Single-use Multi-Well technology reagent test strips are inserted into the device. Delivery of the clinical sample fills the test strip by capillary action. An audio sound confirms sample receipt and the creatinine concentration (µmol/l or mg/dl) is displayed after 30 s. The reported measurable creatinine range is 27–1056 µmol/l (0.31–11.95 mg/dl); results outwith this are reported as ‘Hi’ or ‘Lo’.
Three quality control solutions (QCM) (StatSensor Creat Control C1, C2, C3; Nova Biomedical) were provided which were run daily and each time a new canister of strips was opened. 18 The purpose of this was to evaluate device performance prior to sample analysis. In the event of the QCM results falling outside the provided reference interval (RI), algorithms for device calibration were available from the manufacturer.
Konelab
Creatinine concentration was measured in serum samples using an enzymatic colorimetric methodology. Calibration procedure and sample analysis were performed according to the manufacturer’s instructions. 17 Control material (Biostat Diagnostic Systems) with low, normal and high values was included in every run of Konelab samples. Methodology accuracy was assessed by continuous bimonthly participation in an external quality assurance programme (RIQAS; Randox). The measuring range is 10–2500 µmol/l (0.11–28 mg/dl), extending to 10,000 µmol/l (113 mg/dl) following dilution. Imprecision is ⩽4.5% total coefficient of variation (CV); within-run and between-day CV range from 0.4–1.4% and 0.3–0.5%, respectively. This laboratory’s established RI for feline serum creatinine was 133–175 µmol/l (0.37–1.98 mg/dl).
Imprecision
Imprecision is the lack of repeatability of a result during sequential analysis of a sample and is expressed as coefficient of variation (CV; %). 19
SSXp imprecision was assessed by within- and between-run repeatability using the three QCM and the serum pool.
Within-run repeatability was determined by measuring creatinine in the same sample 20 times sequentially (QCM and feline serum pool).
Between-run repeatability was determined from the values generated over a 20 day period (QCM) and by measuring creatinine in duplicate daily for five consecutive days (feline serum pool). 19
Sample type and method comparisons
On each day of testing, SSXpwhole blood was analysed immediately following sample collection and SSXpplasma within 15–30 mins afterwards. Plain tubes were transported to the Diagnostic Laboratories where Konelabserum was run within 45–60 mins of blood collection.
Data collection and statistical analysis
Data regarding the date of sample acquisition, cats’ signalment, disease, creatinine results and PCV were recorded in a commercially available spreadsheet (Microsoft Excel). All statistical analyses were performed using the two-dimensional graphing and statistics software Prism 4 GraphPad (GraphPad Software).
Imprecision, total error observed and sigma (σ) metrics
Within- and between-run imprecision were determined by calculating the CV (%):
Total error observed (TEobs; %) is the sum of random error (imprecision) and systematic error, with the former represented by CV and the latter represented by bias (inaccuracy of the generated result compared to the true value). TEobs for creatinine was determined by the following formula: 19

Bias was calculated using the QCM according to the following formula:

Where ‘target’ is the mean creatinine value reported by the manufacturer and ‘measured’ is the mean creatinine value measured by the SSXp over the 20 day period. 18
Since three different QCM (C1, C2, C3) were used daily, bias was determined from each of the three controls.
TEobs was assessed in two ways: (1) TEobs(%) values for each of the QCM [TEobs-C1, TEobs-C2, TEobs-C3] were calculated using the specific between-run CV and bias for each of the QCM as determined above; (2) feline-specific TEobs(%) was calculated using the between-run CV for the feline serum pool and each one of the three QCM bias as determined above. As bias was determined for C1, C2 and C3, feline-specific TEobs-C1(%), TEobs-C2(%) and TEobs-C3(%) were calculated for comparison. SSXp methodology was considered acceptable if TEobs < total allowable error (TEA). As published TEA values vary throughout the literature, these were taken from the guidelines of the American Society for Veterinary Clinical Pathology (TEA: 20%) and published studies (TEA: 17%).19,20
Sigma metric values (σ), a universally accepted objective measure of analytical methodologies, were calculated according to the following formula:19–21

TEA values were taken from published studies, bias was taken as the bias for the QCM C1 and CV as the between-run CV for the feline serum pool.19,20 As the TEA values differed between the two sources (17% vs 20%), σ was calculated for both to generate one for the low (σLow) and one for the higher (σHigh) TEA value. Interpretation of σ values was performed as follows: ⩽3 = poor; >3 = marginal; >4 = good; >5 = excellent; >6 = world-class.22,23
Sample type and method comparisons
Relationships between creatinine values for each collected set of data (Konelabserum vs SSXpwhole blood, Konelabserum vs SSXpplasma, SSXpwhole blood vs SSXpplasma) were evaluated for normality using the D’Agostino–Pearson omnibus normality test.
Using the same data sets, Spearman’s correlation coefficient was calculated to measure the strength of relationship between: (a) methodologies (SSXp vs Konelab); (b) SSXp values obtained from different sample types (whole blood vs plasma); and (c) PCV and SSXpwhole blood creatinine results. To further explore the clinical applicability of the device, every creatinine value was also assigned an International Renal Interest Society (IRIS) stage (<140 µmol/l [<1.6 mg/dl] = IRIS stage 1; 140–250 µmol/l [1.6–2.8 mg/dl] = IRIS stage 2; 251–440 µmol/l [2.9–5.0 mg/dl] = IRIS stage 3; >440 µmol/l [>5.0 mg/dl] = IRIS stage 4) and correlation of IRIS staging between methodologies (Konelab vs SSXp) was evaluated, with IRIS stage 1 considered non-azotaemic and IRIS stages 2–4 considered azotaemic. 24 Correlation coefficients were interpreted as proposed by Zady: 25 0.9–1 very high correlation, 0.70–0.89 high correlation, 0.50–0.69 moderate correlation, 0.30–0.49 low correlation and <0.30 little, if any, correlation.
Sensitivity and specificity for the SSXp’s ability to determine non-azotaemic vs azotaemic samples (using a cut-off of 140 µmol/l, based upon IRIS staging) were calculated using the following formulae:

Deming regression analysis was used to determine the mathematical relationship and the constant (intercept) and proportional (slope) error of the SSXp relative to the Konelab and SSXpplasma relative to the SSXpwhole blood values. Bland–Altman analysis was used to assess agreement between the two instruments and between SSXp results obtained from the two different sample types. 26 Agreement was considered good when the 95% limits of agreement (LOA; mean of the differences ± 2SD) were narrow and the bias was small.
Results
Clinical cases
Fifty samples from 44 cats were analysed for inclusion in the study. Two samples, both from the same cat on different occasions, were visibly icteric, thus excluded from analysis. No sample was visibly haemolysed or lipaemic. Of the 43 cats included in the study, ages ranged from 1 year 1 month to 16 years (median 9 years 11 months). There were 20 male neutered, one male entire and 22 female neutered cats of a variety of breeds: 33 domestic shorthairs, two domestic longhairs, two British Shorthairs, two Persian and one each of Burmese, Norwegian Forest Cat, Siamese and Somali. Thirty-one of the 43 cats presented for a single clinical problem and 12 had multiple clinical problems, encompassing a variety of diseases: endocrine (n = 20), urinary tract (n = 15), respiratory (n = 6), cardiac (n = 6), hepatic (n = 4), neurological (n = 3), nutritional (n = 2), gastrointestinal (n = 2), neoplastic (n = 1) and haematological (n = 1).
StatSensor
No technical problems occurred when using the device. The error code ‘E-4’, indicating insufficient sample, occurred three times during precision analysis and repeatability; repeat samples were successfully measured. No error codes occurred while measuring clinical samples.
Manufacturer-provided target ranges for C1, C2 and C3 QCM were 44–124 µmol/l, 133–239 µmol/l and 398–663 µmol/l (0.50–1.40 mg/dl, 1.50–2.70 mg/dl and 4.50–7.50 mg/dl), respectively. No QCM failures were identified during the study; every result was within its designated range.
Imprecision, TEobs and sigma (σ) metrics
The imprecision studies identified SSXp imprecision (CV, %) within- and between-run of 4.23–8.85% and 8.95–11.72%, respectively (Table 1).
Precision values for creatinine measurement by the SSXp, as determined by within-run and between-run CV for the three levels of quality control media (QCM) and the pooled feline serum sample

CV = coefficient of variation (%); C1, C2 and C3 = levels 1, 2 and 3 QCM, respectively
Quality requirements
Average (mean) TEobs (between-run) for QCM was 29.36 (range 22.15–34.92) and for the feline serum pool it was 25.87 (range 19.78–29.39) (Tables 2 and 3). No within-run QCMs fell outside 20% of the mean target value. Five of 20 C1, 1/20 C2 and 5/20 C3 between-run QCMs fell outside 20%.
Calculated bias and total error observed (TEobs) of the SSXp at all three levels of quality control media (QCM; C1, C2 and C3)

TEA = total allowable error; TEobs-C1-3 = total error observed for each of the three QCM
Calculated total error observed (TEobs) and sigma metrics of the SSXp for measurement of creatinine in the feline serum pool

TEA = total allowable error; SigmaLow = sigma metrics calculated for TEA of 17%; SigmaHigh = sigma metrics calculated for TEA of 20%; TEobs-C1-3 = total error observed for each of the three quality control media, C1,C2, C3
Creatinine
Analysis of the 48 clinical samples generated a wide range of Konelab creatinine values (range 48–1299 µmol/l [0.54–14.69 mg/dl], median 129.5 µmol/l [1.46 mg/dl]), reflecting all IRIS CKD stages (stage 1: 27 samples; stage 2: 17 samples; stage 3: one sample; stage 4: three samples) thus enabling evaluation of SSXp performance across a wide range of creatinine concentrations.
The range of creatinine results generated by the SSXp on clinical samples was 63–682 µmol/l (0.71–7.71 mg/dl; median 141 µmol/l [1.60 mg/dl]) for SSXpwhole blood and 73–664 µmol/l (0.83–7.51 mg/dl; median 170.5 µmol/l [1.93 mg/dl]) for SSXpplasma. No ‘Hi’ or ‘Lo’ results were generated.
Comparison studies
Comparing SSXp and Konelab, very high correlation was demonstrated between SSXpplasma and Konelabserum (r = 0.91, P <0.0001) and high correlation between SSXpwhole blood and Konelabserum (r = 0.85, P <0.0001). LOA were very wide (474.6 µmol/l [5.37 mg/dl] and 433.6 μmol/l [4.90 mg/dl], respectively). Similarly high correlation was demonstrated between SSXpwhole blood and SSXpplasma (r = 0.89, P <0.0001, although again, with relatively wide LOA; 206.78 μmol/l [2.34 mg/dl]). There was no statistically significant correlation between PCV and SSXpwhole blood creatinine values (r = −0.28), across the tested range (PCV 18–42%). These findings are shown in Tables 4 and 5.
Comparison studies, as expressed by Spearman’s correlation coefficient and 95% confidence intervals (CIs)

(a, b) Creatinine measurement between different methodologies; (c) creatinine measurement between different matrices; (d) SSXp creatinine measurement vs PCV; (e) IRIS stages between different methodologies
Not statistically significant
r = Spearman’s correlation coefficient; PCV = packed cell volume
Deming regression analysis results, depicting constant (intercept) and proportional (slope) error, with 95% confidence intervals (CIs). Bland–Altman data used to determine agreement between methodologies
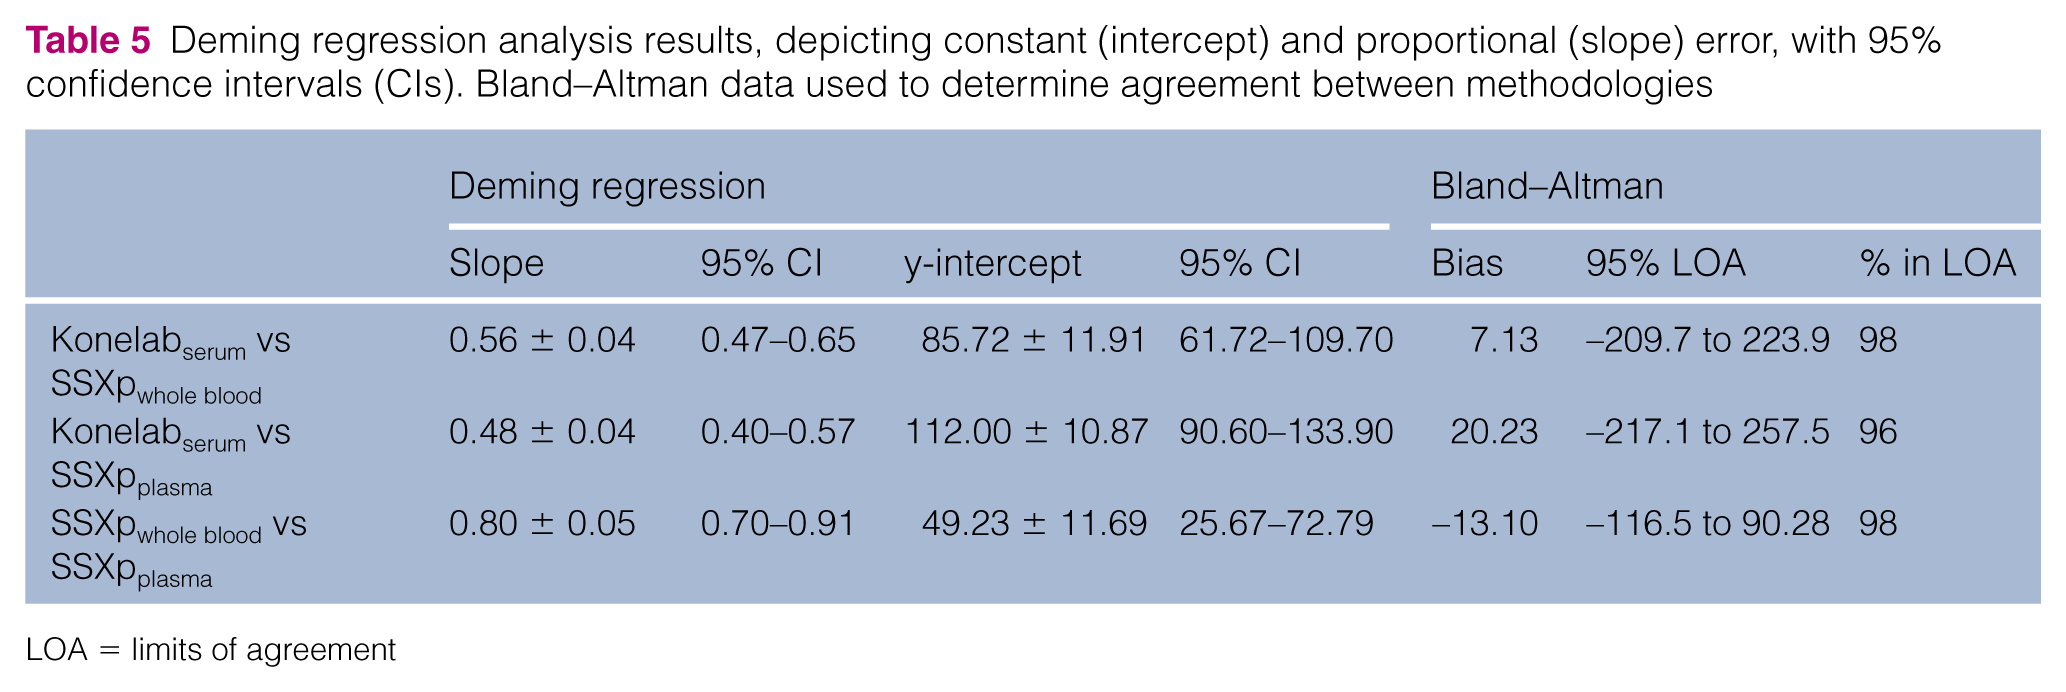
LOA = limits of agreement
SSXpwhole blood determination of azotaemia (compared with Konelabserum) as based on IRIS staging (creatinine ⩾140 µmol/l [⩾1.6 mg/dl]) had sensitivity of 90% and specificity of 82%.
Constant error, proportional error and bias for the SSXp relative to the Konelab and SSXpplasma relative to the SSXpwhole blood values are presented in Table 5 and Figures 1(a–d) and 2(a, b).

Deming regression plots between Konelab and (a) SSXpwhole blood and (b) SSXpplasma. Bland–Altman difference plots between Konelab and (c) SSXpwhole blood and (d) SSXpplasma

Deming regression and Bland–Altman difference plots demonstrating very high correlation (a) and agreement (b), respectively, between SSXpwhole blood and SSXpplasma creatinine values
Discussion
To our knowledge, this is the first study in which analytical and clinical performance of a handheld PoC creatinine analyser has been evaluated for use in cats.
Imprecision guidelines are provided by Westgard, the governing standard for analytical quality requirements, with desired within- and between-run imprecision for serum creatinine of 2.98% and 3.96%, respectively, indicating inadequate precision of the SSXp (within- and between-run CV of 4.23–8.85% and 8.95–11.72%, respectively) compared with laboratory standards. 27 A recent study evaluating the SSXp in human patients (whole blood) reported comparable findings, with mean within-run imprecision of 2.3–5.9% and mean between-run imprecision (using three-level QCM) of 4.2–9.0%; therefore, similarly failing to meet desired specifications. 11 CV values for pooled feline serum (our study) and whole blood (previous human studies) were lower than for QCM. 11 This is unexpected; the uniform matrix of the latter would be expected to yield a more consistent result compared with the less homogeneous matrix of whole blood, plasma or serum. 11
Average TEobs (QCM: mean 29.36%, range 22.15–34.92%; feline serum pool: mean 25.87%, range 19.78–29.39%) also failed to meet the desired TEA (17, 20%).18–20 Possible explanations for this include machine, reagent strip, operator or environmental error; further work would be needed to identify which factors are most influential. Sigma metrics for the SSXp was consistent with very poor performance (σ ⩽3) at both creatinine TEA thresholds. A recent study evaluating the SSXp in human patients neither reported TEobs nor sigma metric values, so a direct comparison cannot be made. 11 While creatinine is reported to be among those biochemical analytes having the greatest imprecision, bench-top veterinary devices perform considerably more precisely; a recent study evaluating analytical performance of a dry chemistry analyser reported TEobs and σ for feline creatinine of 10 and 5.7, respectively.28,29
The population of cats in our study had a serum creatinine range, as determined by Konelab, of 48–1299 µmol/l (0.54–14.69 mg/dl). Despite being reported to measure creatinine over a range of 27–1056 µmol/l (0.31–11.95 mg/dl), the SSXp range for the same population was from 63 to 682 µmol/l (0.71–7.71mg/dl) and from 73 to 664 µmol/l (0.83–7.51 mg/dl) for SSXpwhole blood and SSXpplasma, respectively, indicating a failure of the SSXp to quantify higher creatinine values accurately. Further studies evaluating greater numbers of markedly azotaemic samples are required to further elucidate the SSXp performance at high creatinine concentrations.
Although SSXp is intended for creatinine measurement in whole blood, we also measured creatinine in plasma as the similar matrix of plasma and serum rendered comparison between SSXp and reference methodology more representative. Indeed, SSXpplasma exhibited greater correlation with Konelabserum (r = 0.91, P <0.0001) than did SSXpwhole blood with Konelabserum (r = 0.85, P <0.0001).
The Konelabserum vs SSXpplasma and Konelabserum vs SSXpwhole blood regression plots revealed two (1299 µmol/l vs 644 µmol/l [14.69 mg/dl vs 7.29 mg/dl], 799 µmol/l vs 408 µmol/l [9.04 mg/dl vs 4.62 mg/dl]) and one (1299 µmol/l vs 601 µmol/l [14.69 mg/dl vs 6.80 mg/dl]) data points, respectively, markedly deviating from the line of best fit. While the trend at lower creatinine values was for the SSXp (whole blood and plasma) to have a positive bias relative to the Konelab, this trended towards a considerable negative bias of SSXp compared with Konelab at higher creatinine values, with increased discordance associated with higher creatinine concentrations as indicated above. The reason for this switch from a positive to negative bias was not apparent and would require further investigation. Furthermore, this is of considerable importance when considering clinical applicability of the device; had a consistent positive or negative bias been identified, this may have enabled either generation of a device-specific reference interval, or application of a linear algorithm to SSXp results to yield greater correlation with reference methodology. However, the switch from a positive to negative bias makes exploring both of these options obsolete. The finding of a negative bias of the SSXp vs reference methodology at higher creatinine values was also identified in a recent human study; with demonstration of improved correlation if values >600 µmol/l (>6.79 mg/dl) were excluded from analysis (r = 0.99 and r = 0.97, respectively). 11 The higher correlation in this previous study can be accounted for by excellent correlation at lower creatinine values, in comparison with the positive bias exhibited when SSXp is used to evaluate feline creatinine. Similarly, apparently higher correlation between reference methodology and SSXp evaluation of canine creatinine (r = 0.954) in a previous study can be explained by a narrower range of creatinine values (maximum 610 µmol/l [6.9 mg/dl]). 16 Discordance from laboratory methodology with increasing creatinine values has also been identified in earlier models of the SSXp.12,15 It is possible that unmeasured metabolites associated with azotaemia cause interference with the methodology at higher creatinine values. These deviated data points also appeared as the only outliers on the Bland–Altman difference plots. If these outliers were excluded from analysis, this considerably narrowed the 95% LOAs, from 424.9 µmol/l (4.81 mg/dl) with outliers to 150.1 µmol/l (1.70 mg/dl) without outliers for Konelabserum vs SSXpwhole blood and from 464.8 µmol/l (5.26 mg/dl) with outliers to 114.1 µmol/l (1.29 mg/dl) without outliers for Konelabserum vs SSXpplasma.
Comparing Konelabserum vs SSXpwhole blood, in 36/48 paired samples the same IRIS stage was established by both instruments. In the remaining 12 paired samples, the SSXp and Konelab IRIS stages differed by a single stage; in 6/12 the SSXp creatinine value would have resulted in a falsely diagnosed azotaemia (SSXp stage 2 vs Konelab stage 1) and in 2/12 the SSXp failed to identify an azotaemia (SSXp stage 1 vs Konelab stage 2 for both). These findings (36/48 correctly staged, 19/21 azotaemic patients identified) demonstrate reasonable sensitivity (90%) and specificity (82%) of the SSXp for identification of azotaemia as based on IRIS staging (creatinine ⩾140 µmol/l [⩾1.6 mg/dl]).
Previous studies have considered variability between whole blood and plasma matrices and thus evaluated the impact of PCV on PoC testing, specifically regarding blood glucose and lactate concentrations.30,31 Regarding the former, previous studies have consistently identified an inverse correlation between haematocrit and blood glucose concentration; proposed mechanisms for this relationship include erythrocytes causing mechanical impedance of plasma diffusion into the reagent strip, blood viscosity affecting fluid permeability in the reagent layer and other matrix-associated complications (eg, micro-clot formation, protein deposition, fibrin aggregation) or haemolysis. 31 Conversely, PCV does not appear to influence lactate measurement, with a lack of correlation reported (r = 0.04; P = 0.77; PCV range 14.0–57.5%). Our findings of no significant correlation between PCV and SSXpwhole blood (r = −0.28) suggest that within the tested range (18–42%) PCV does not significantly affect SSXp measurement of creatinine. Further testing would be required to evaluate the effect of severe anaemia or erythrocytosis. The previous study evaluating the SSXp in human patients used whole blood but did not evaluate the impact of PCV on creatinine determination. 11
Conclusions
The SSXp was easy to use, providing rapid patient-side results. Precision studies identified poor repeatability and reproducibility, not meeting acceptable guidelines for a PoC device. Despite this, high to very high correlation was exhibited compared with the reference methodology for creatinine determination. The SSXp correctly classified the IRIS stage in 36/48 of patients, although 2/21 azotaemic cats were not identified. Improved device precision and accuracy are required prior to recommending its use in feline patients.
Footnotes
Acknowledgements
We would like to thank all the clinicians and nursing staff involved in the cases included in the study and Nova Biomedical for providing the StatSensor Xpress and associated materials.
Conflicts of interest
The authors declared no potential conflicts of interest with respect to the research, authorship, and/or publication of this article.
Funding
The authors received no financial support for the research, authorship, and/or publication of this article.